-Brice, Sheila, Camilla
We are looking to see if there are any aux channels that are affected by certain types of locklosses. Understanding if a threshold is reached in the last few seconds prior to a lockloss can help determine the type of lockloss, which channels are affected more than others, as well as
We have gathered a list of lockloss times (using https://ldas-jobs.ligo-wa.caltech.edu/~lockloss/index.cgi) with:
- only Observe and Refined tags (plots, histogram)
- only Observe, Refined, and Windy tags (plots, histogram)
- only Observe, Refined, and Earthquake tags (plots, histogram)
- Observe, Refined, and Microseism tags (note: all of these also have an EQ tag, and all but the last 2 have an anthropogenic tag) (plots, histogram)
(issue: the plots for the first 3 lockloss types wouldn't upload to this aLog. Created a dcc for them: G2401806)
We wrote a python code to pull the data of various auxilliary channels 15 seconds before a lockloss. Graphs for each channel are created, a plot for each lockloss time are stacked on each of the graphs, and the graphs are saved to a png file. All the graphs have been shifted so that the time of lockloss is at t=0.
Histograms for each channel are created that compare the maximum displacement from zero for each lockloss time. There are also a stacked histogram based on 12 quiet microseism times (all taken from between 4.12.24 0900-0930 UTC). The histrograms are created using only the last second of data before lockloss, are normalized by dividing by the numbe rof lockloss times, and saved to a seperate pnd file from the plots.
These channels are provided via a list inside the python file and can be easily adjusted to fit a user's needs. We used the following channels:


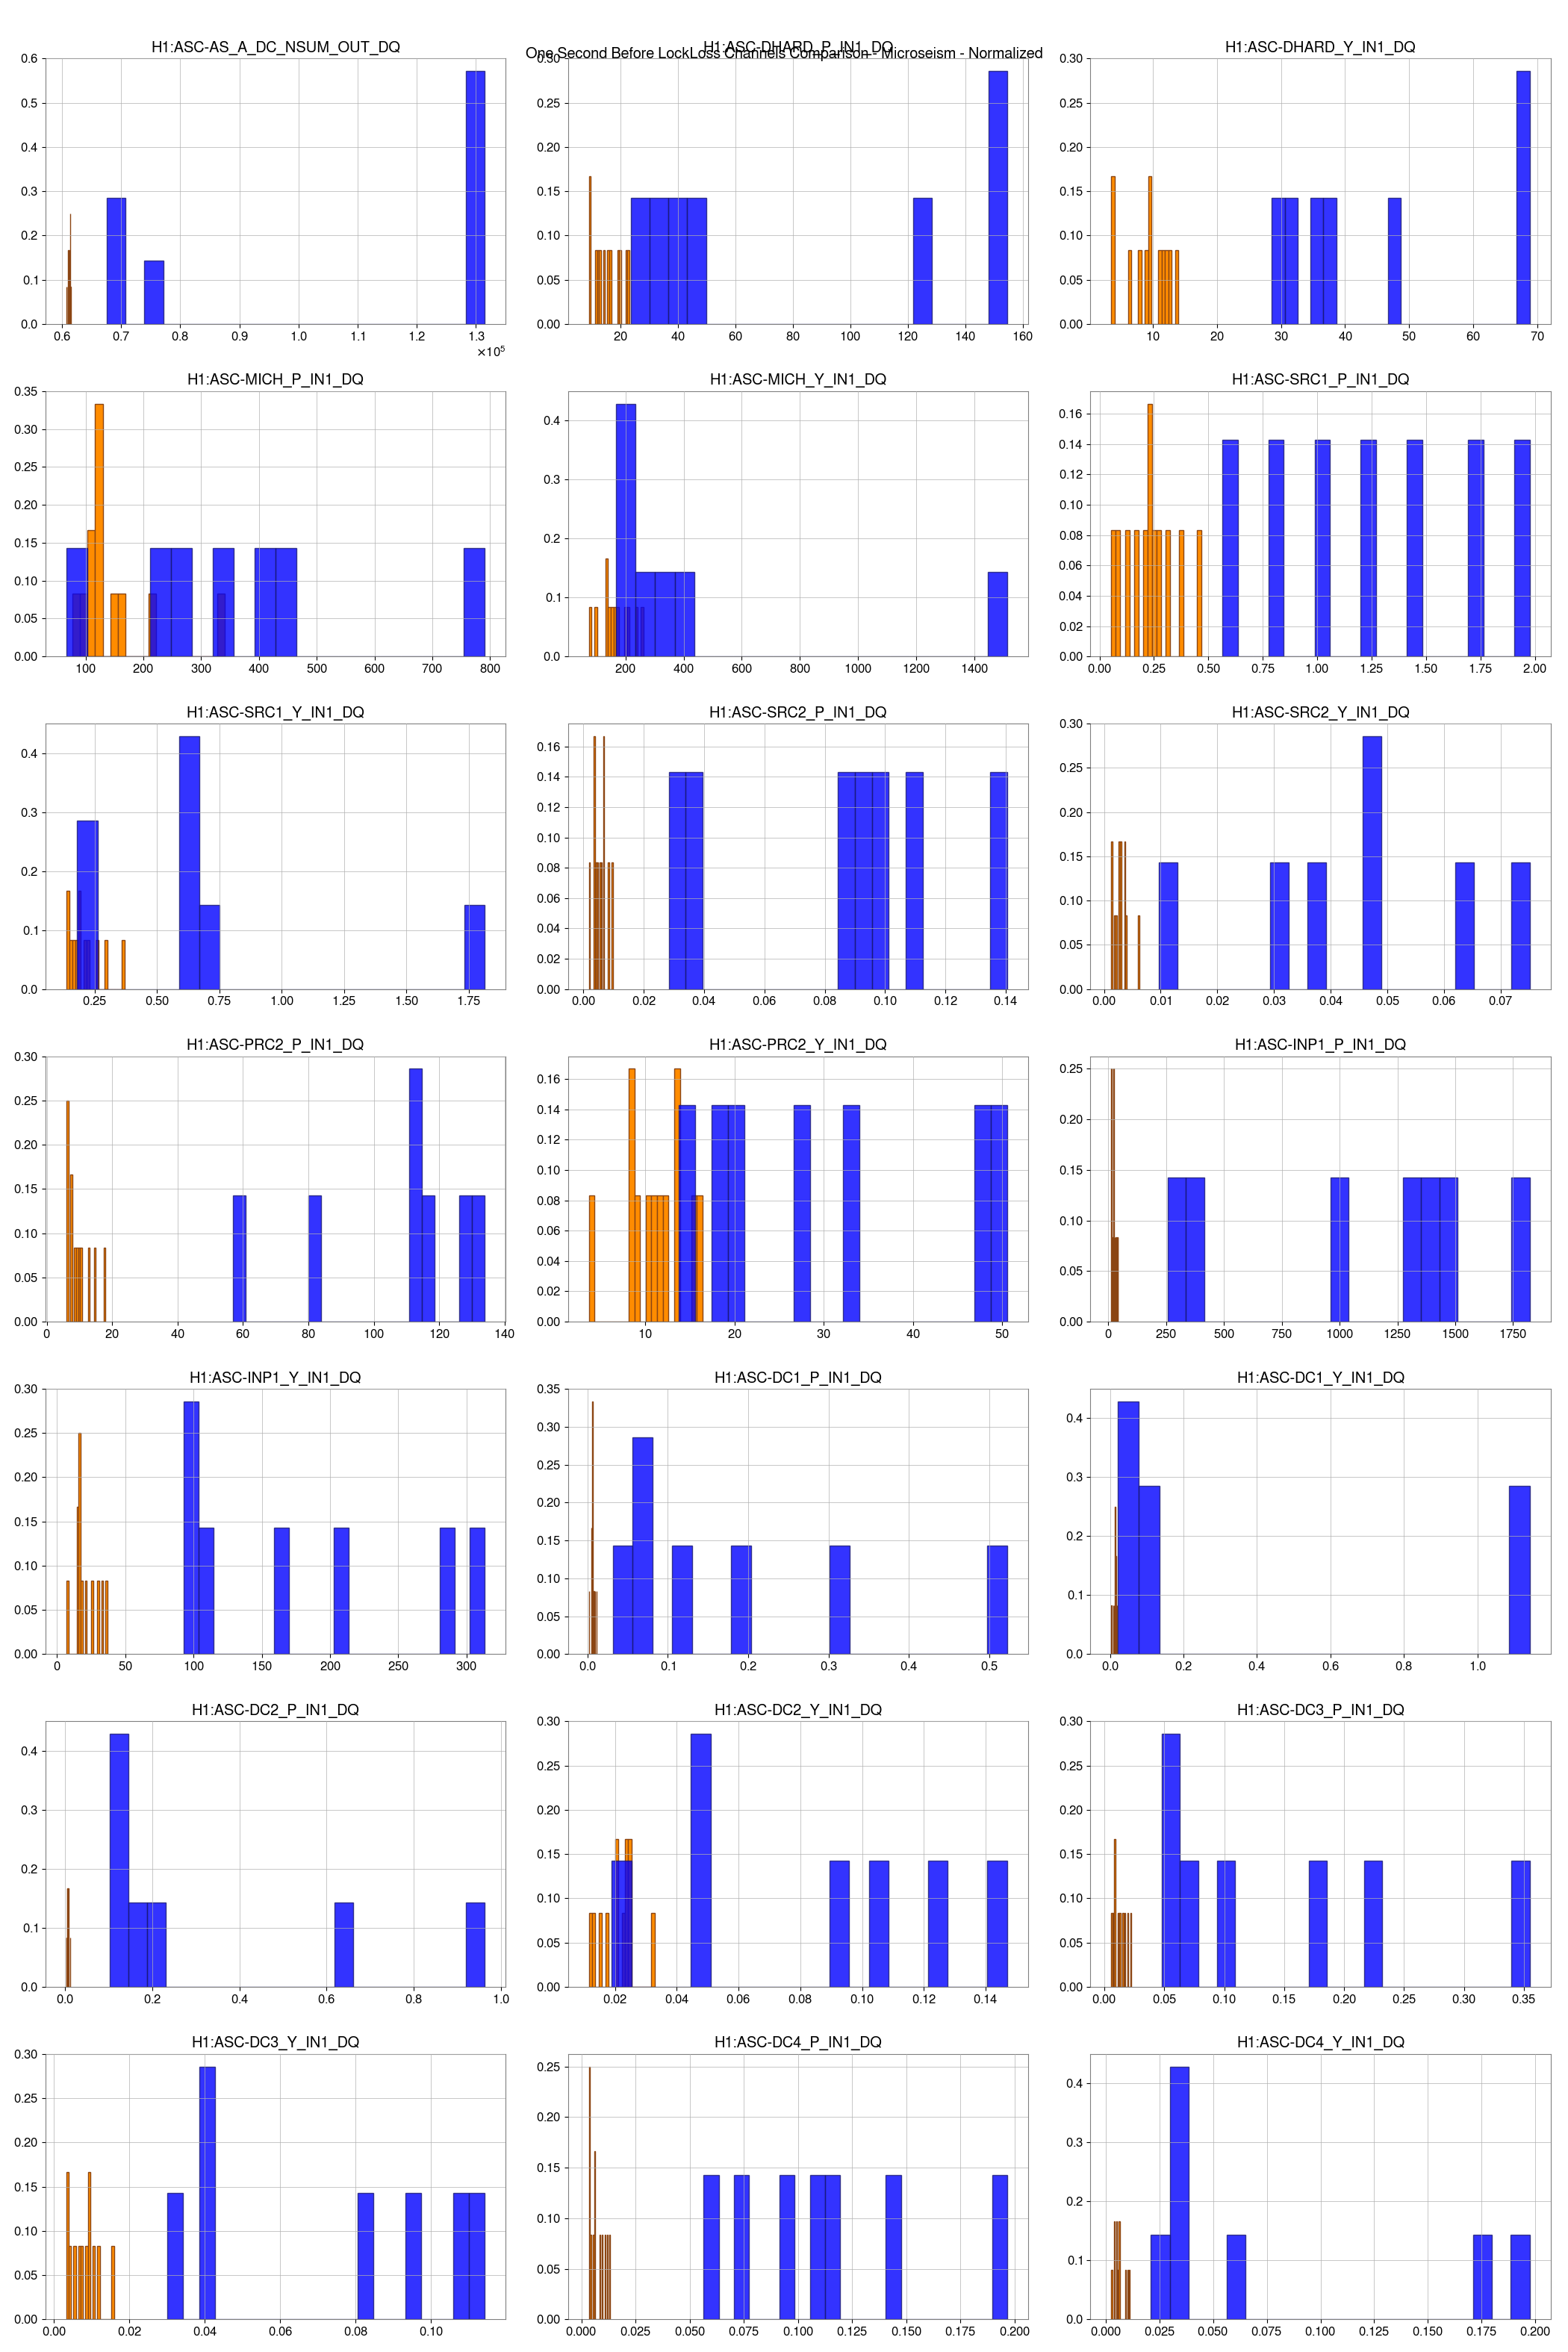

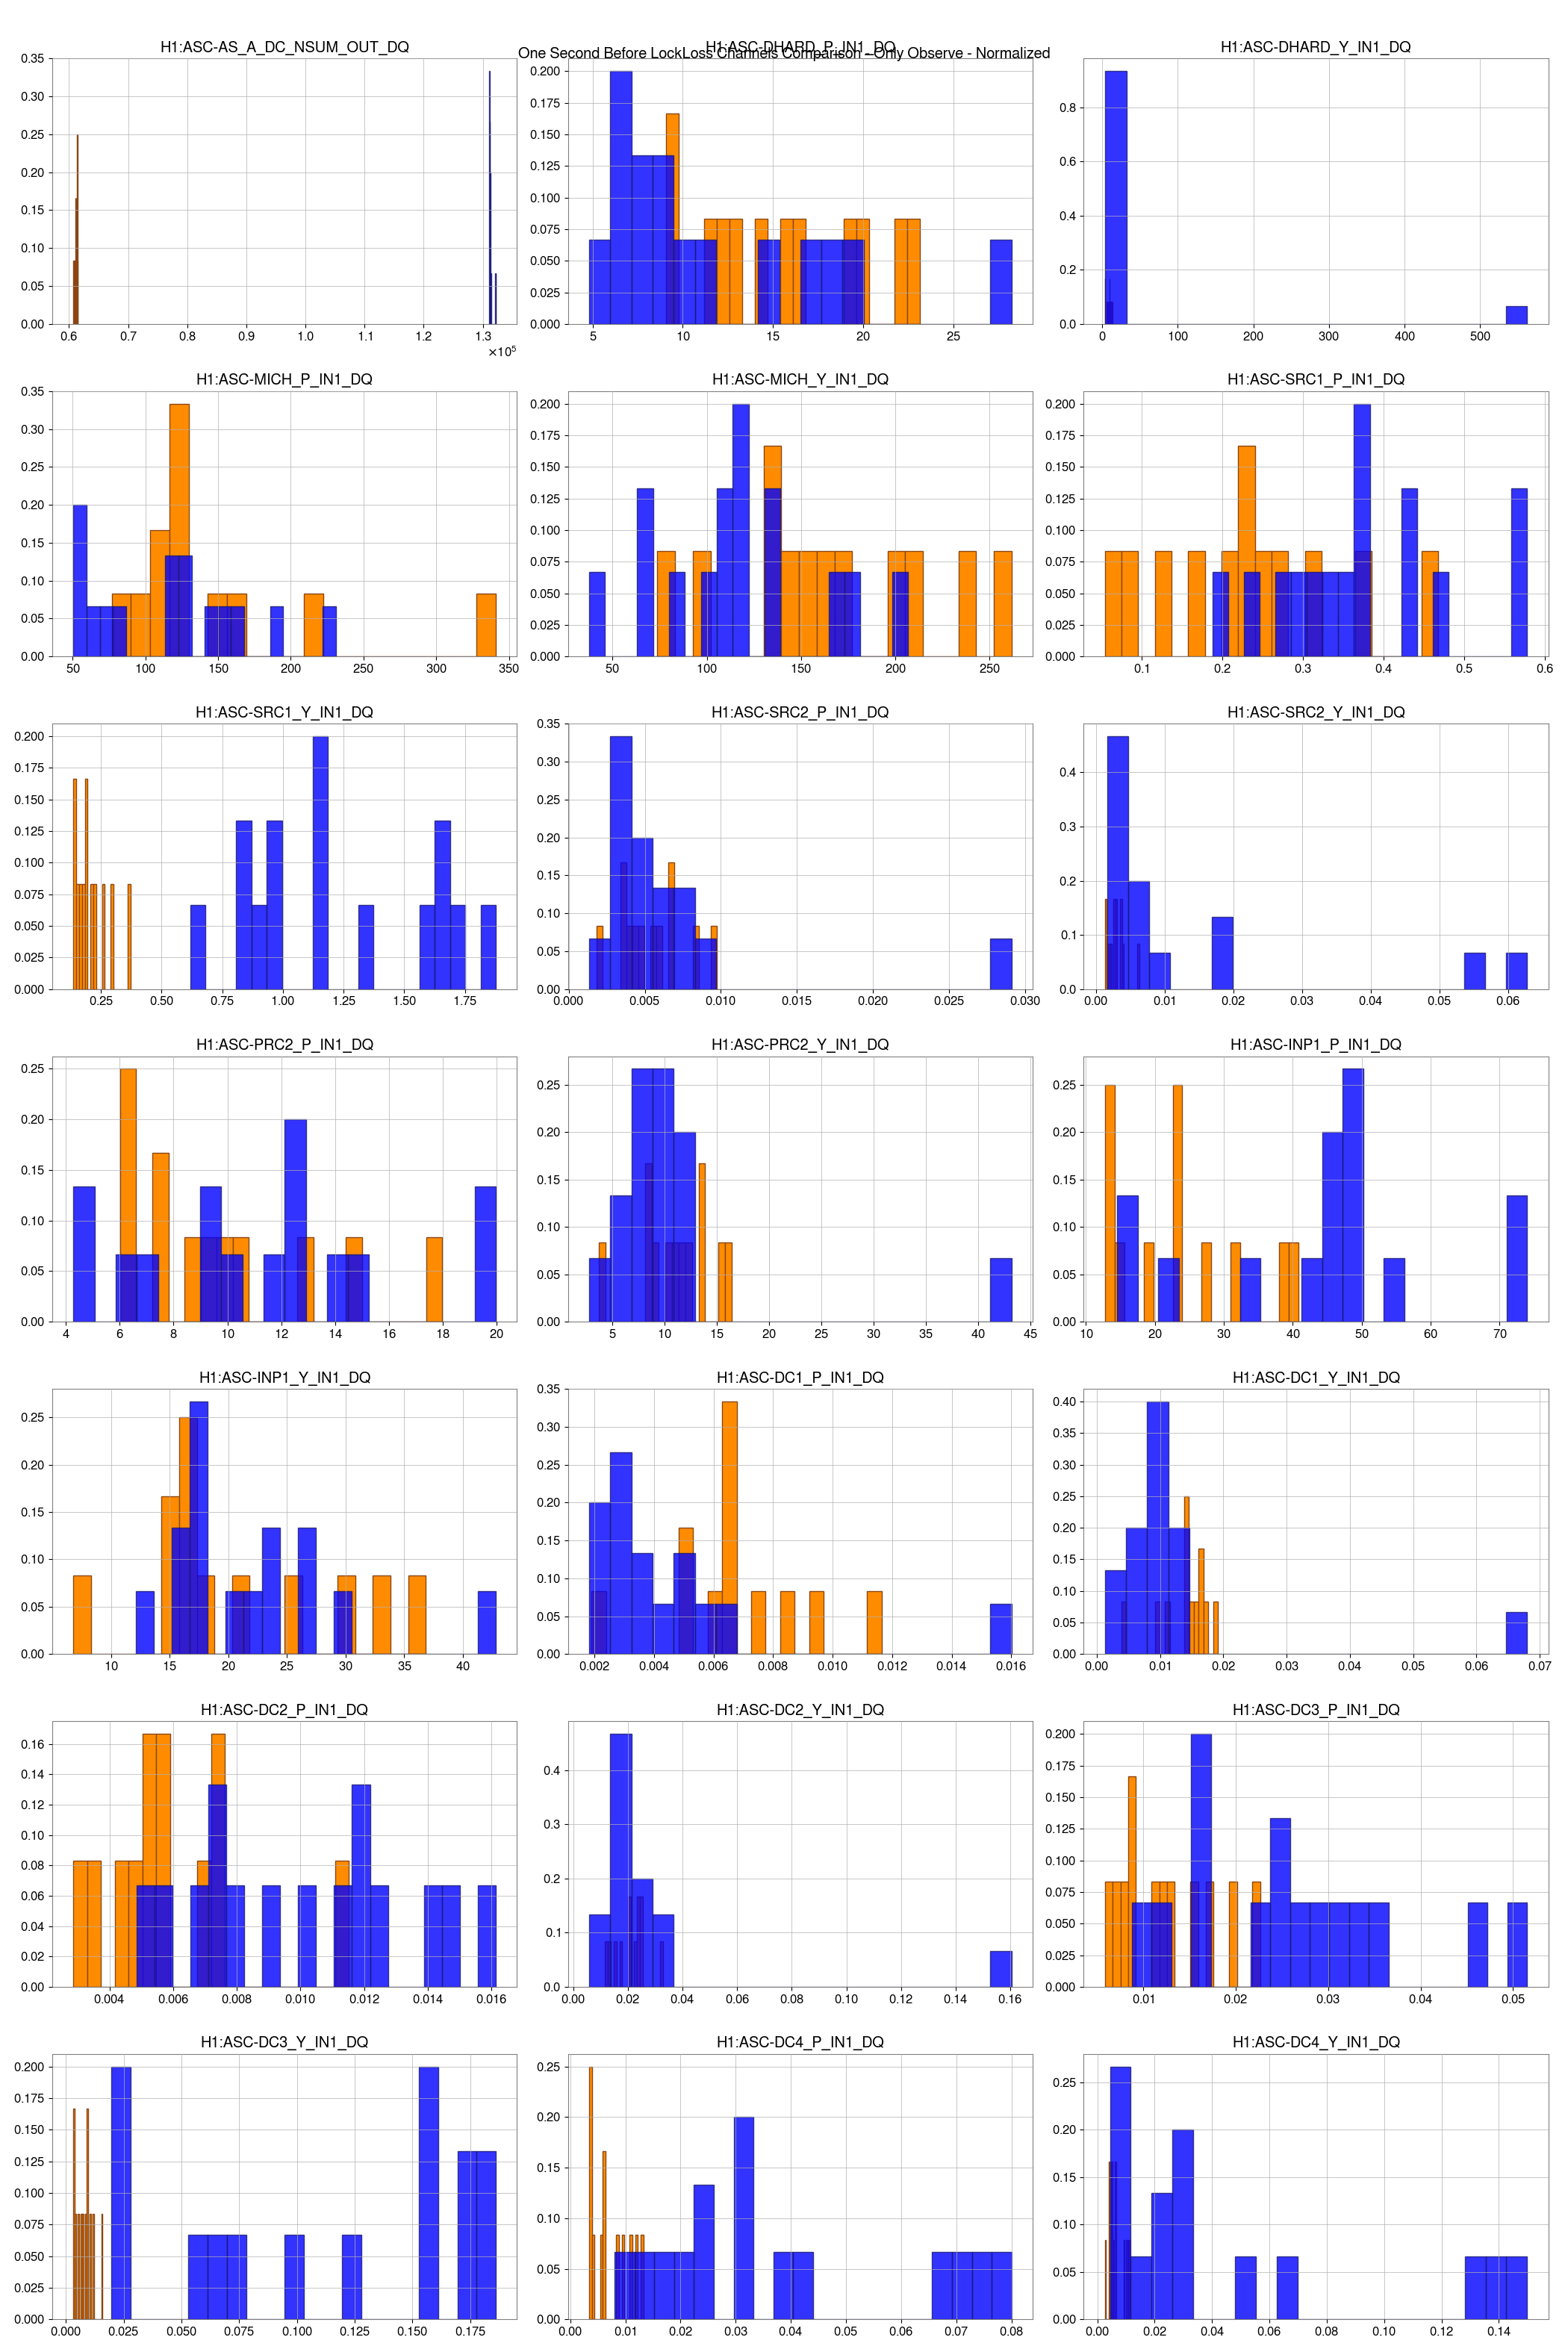
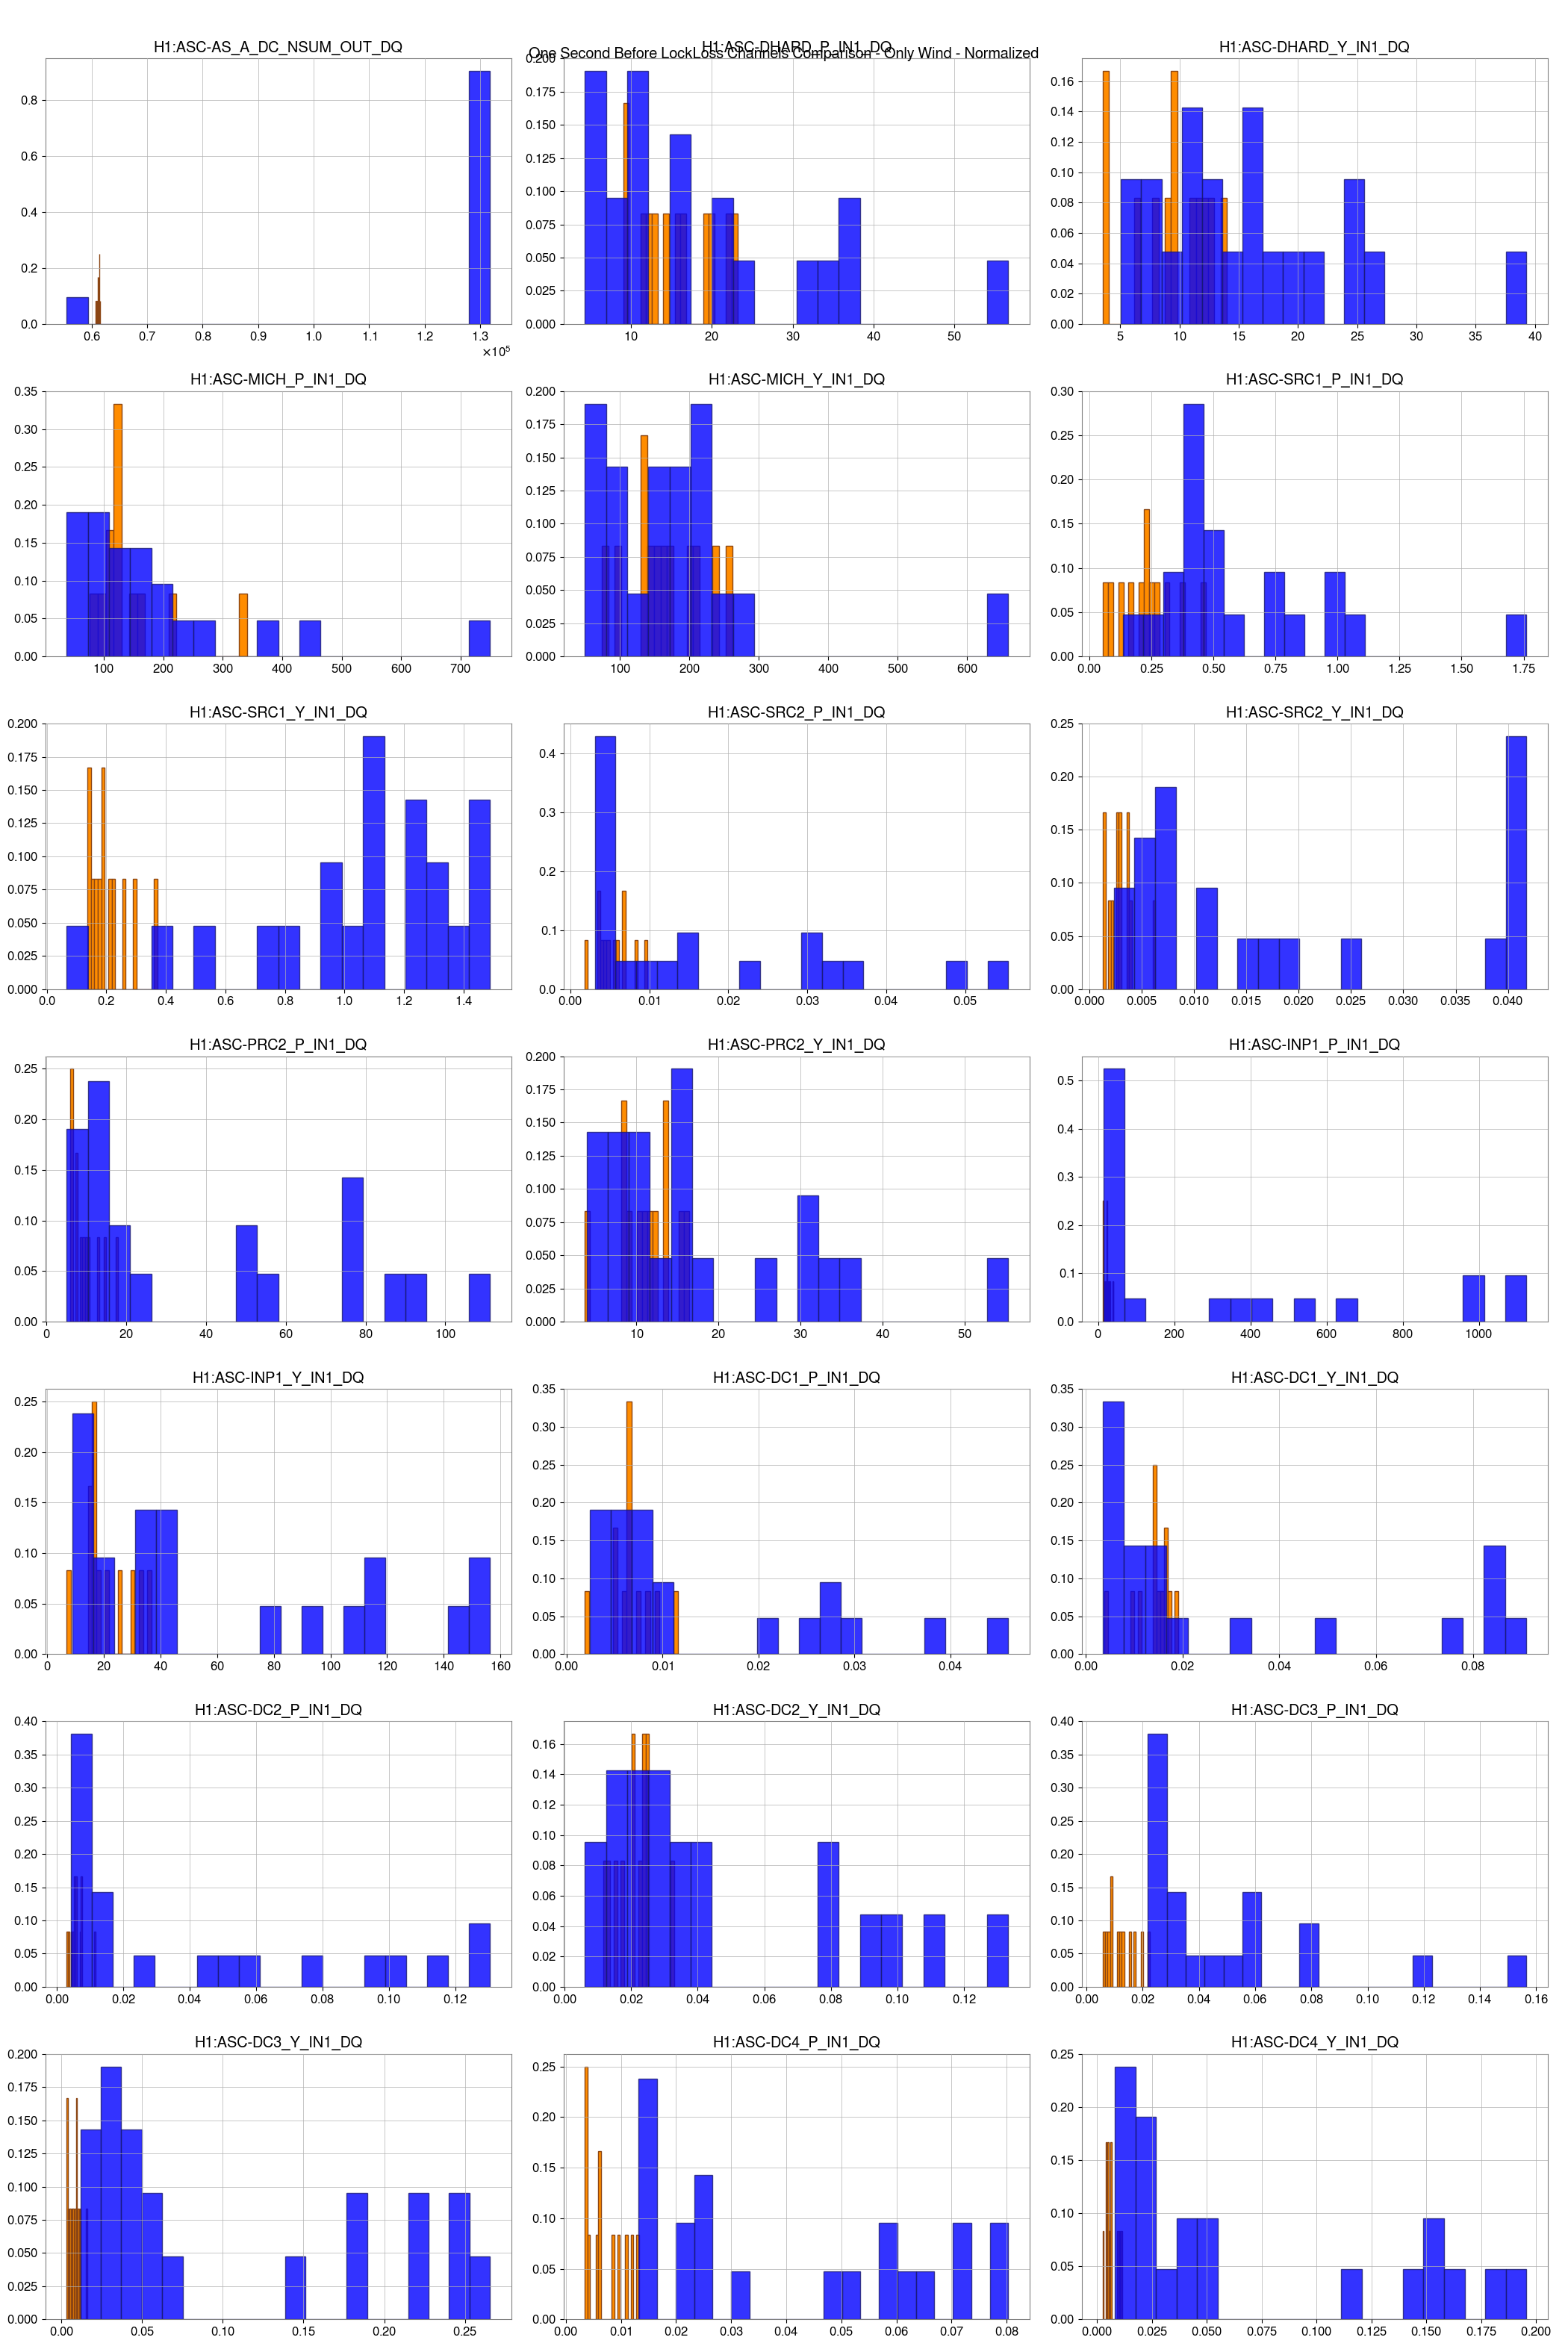
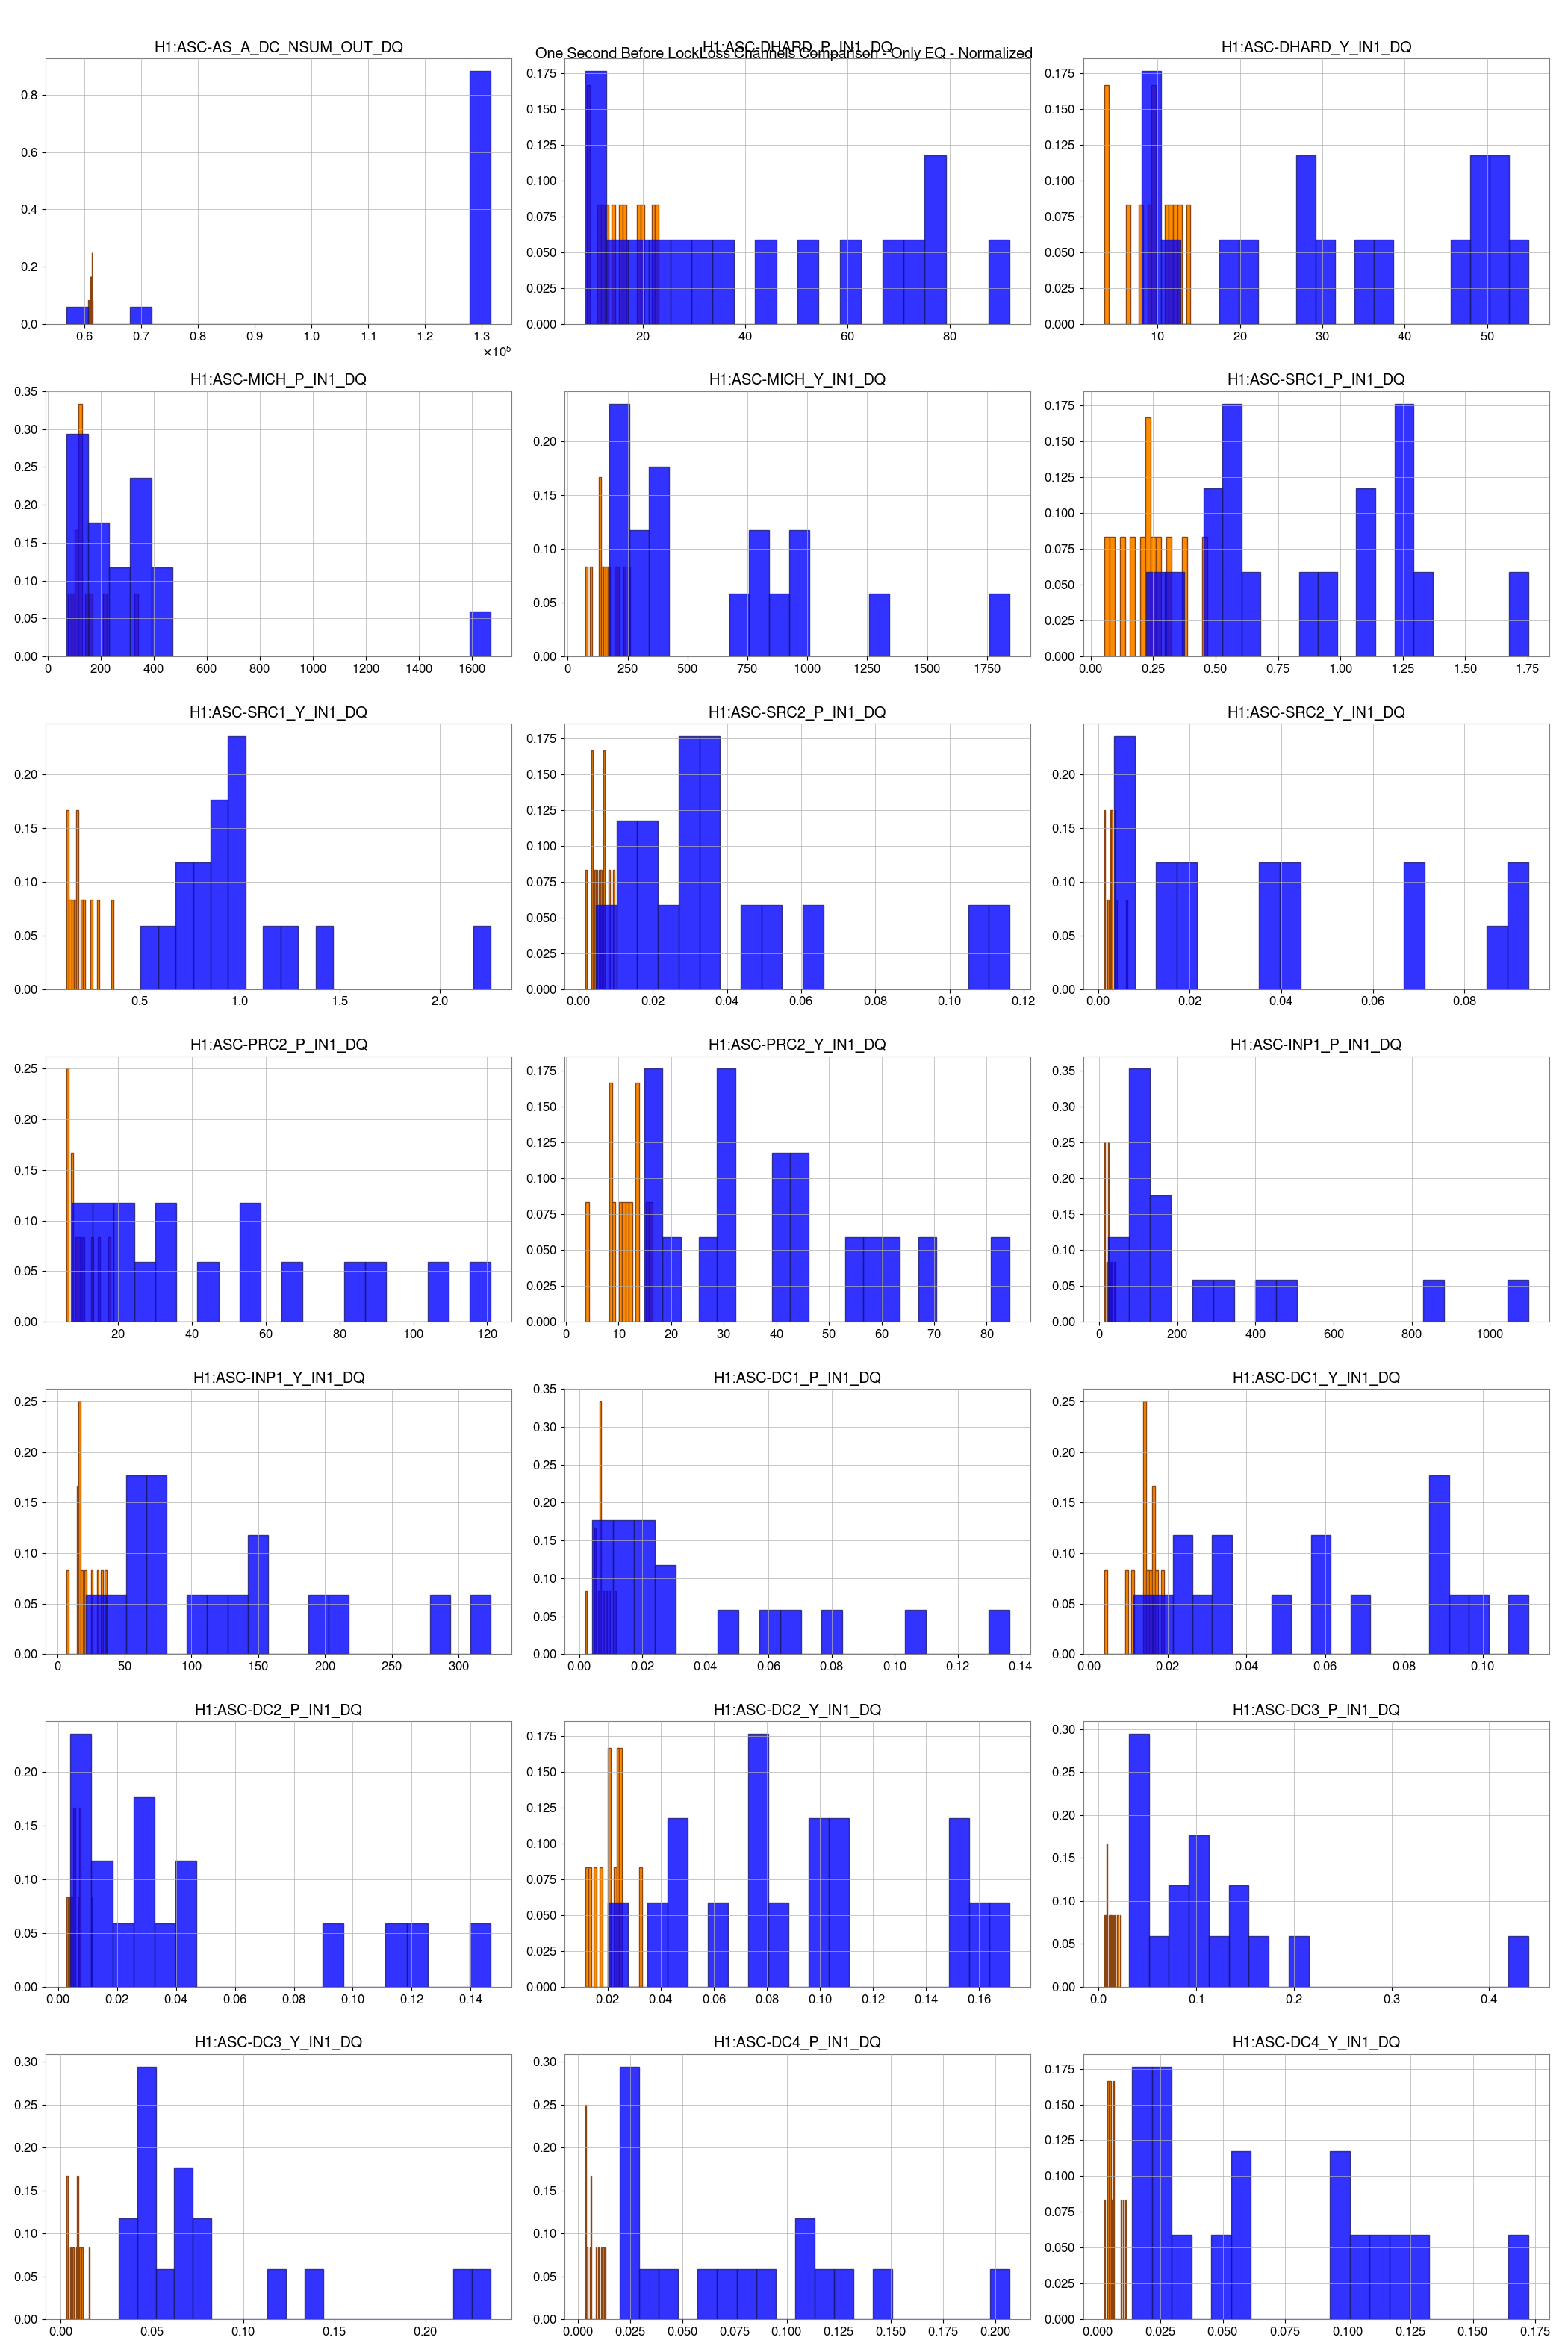
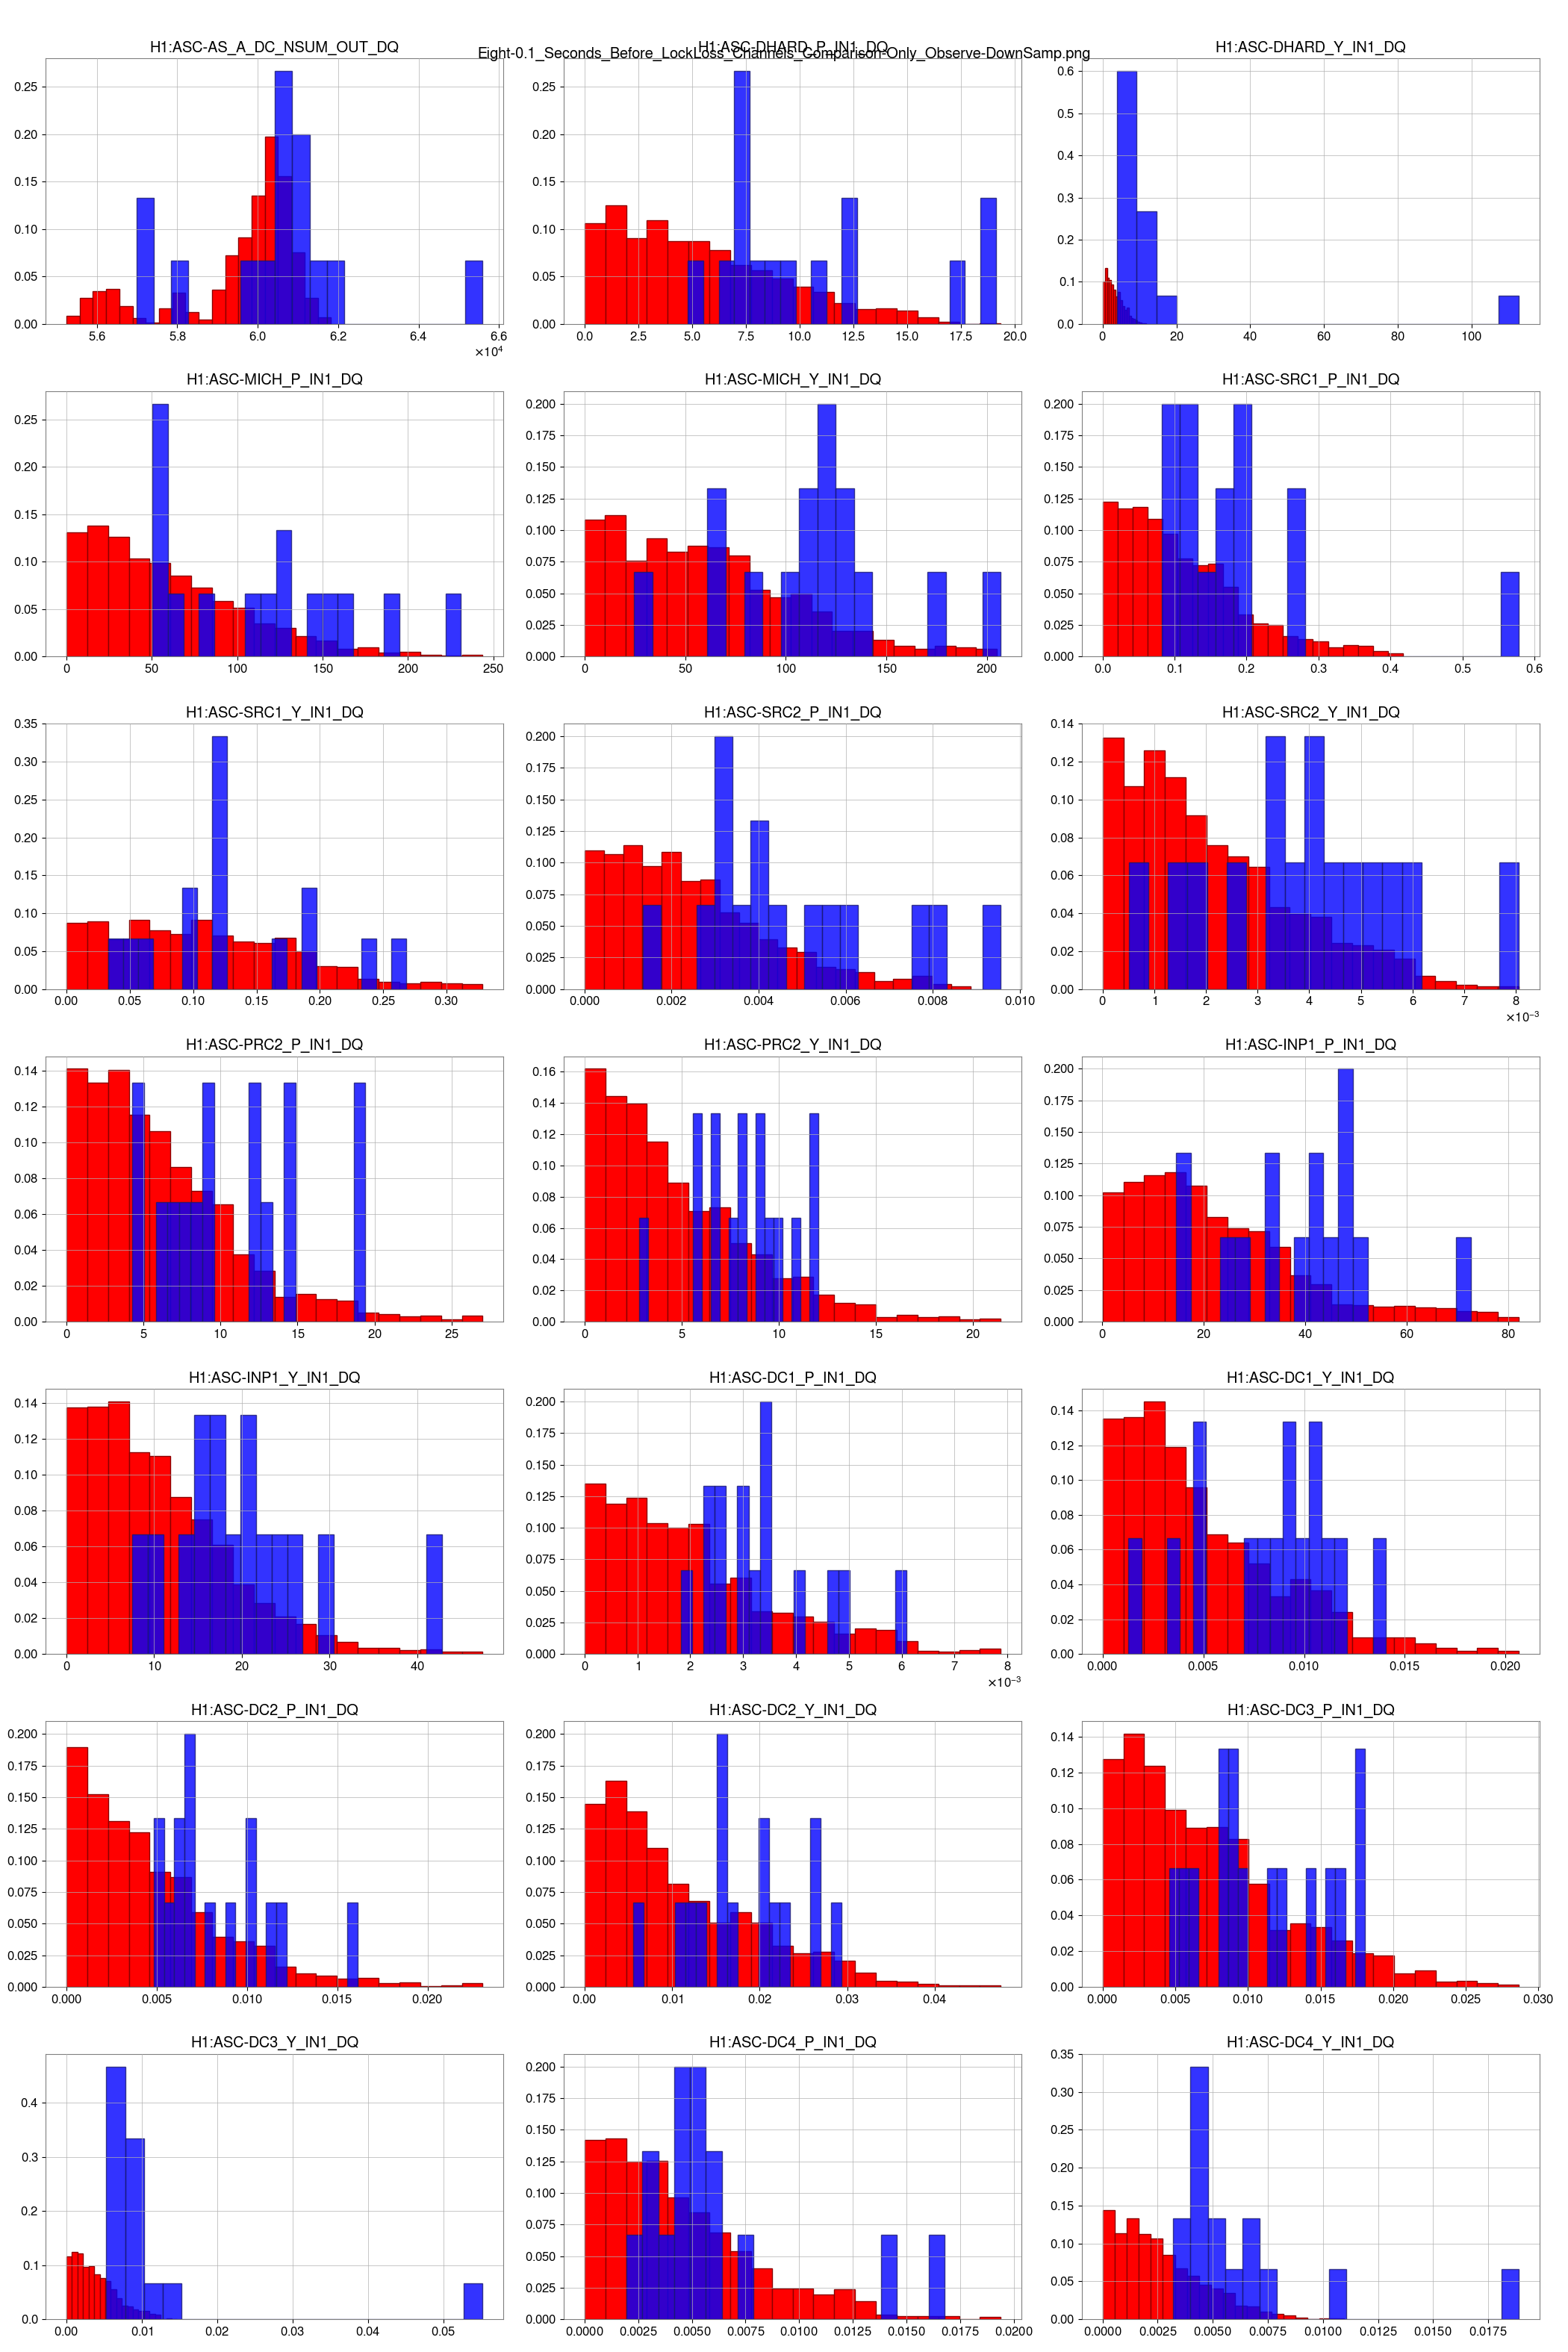
After talking with Camilla and Sheila, I adjusted the histogram plots. I excluded the last 0.1 sec before lockloss from the analysis. This is due to (in the original post plots) the H1:ASC-AS_A_NSUM_OUT_DQ channel have most of the last second (blue) histogram at a value of 1.3x10^5. Indicating that the last second of data is capturing the lockloss causing a runawawy in the channels. I also combined the ground motion locklosses (EQ, Windy, and microseism) into one set of plots (45 locklosses) and left the only observe (and Refined) tagged locklosses as another set of plots (15 locklosses). Both groups of plots have 2 stacked histograms for each channel:
- Blue:
- the max displacement from zero between one second before and 0.1 second before lockloss, for each lockloss.
- The data is one second before until 0.1 second before lockloss, for each lockloss
- the histogram is the max displacement from zero for each lockloss
- The counts are weighted as 1/(number of locklosses in this data set) (i.e: the total number of counts in the histogram)
- Red:
- I took all the data points from eight seconds before until 2 seconds before lockloss for each lockloss.
- I then down-sampled the data points from 256 Hz to 16Hz sampling rate by taking every 16th data point.
- The histogram is the displacement from zero of these down-sampled points
- The counts are weighted as 1/(number of down-samples data points for each lockloss) (i.e: the total number of counts in the histogram)
Take notice of the histogram for the H1:ASC-DC2_P_IN1_DQ channel for the ground motion locklosses. In the last second before lockloss (blue), we can see a bimodal distribution with the right groupling centered around 0.10. The numbers above the blue bars is the percentage of the counts in that bin: about 33.33% is in the grouping around 0.10. This is in contrast to the distribution for the observe, refined locklosses where the entire (blue) distribution is under 0.02. This could indicate a threshold could be placed on this channel for lockloss tagging. More analysis will be required before that (I am going to next look at times without locklosses for comparison).


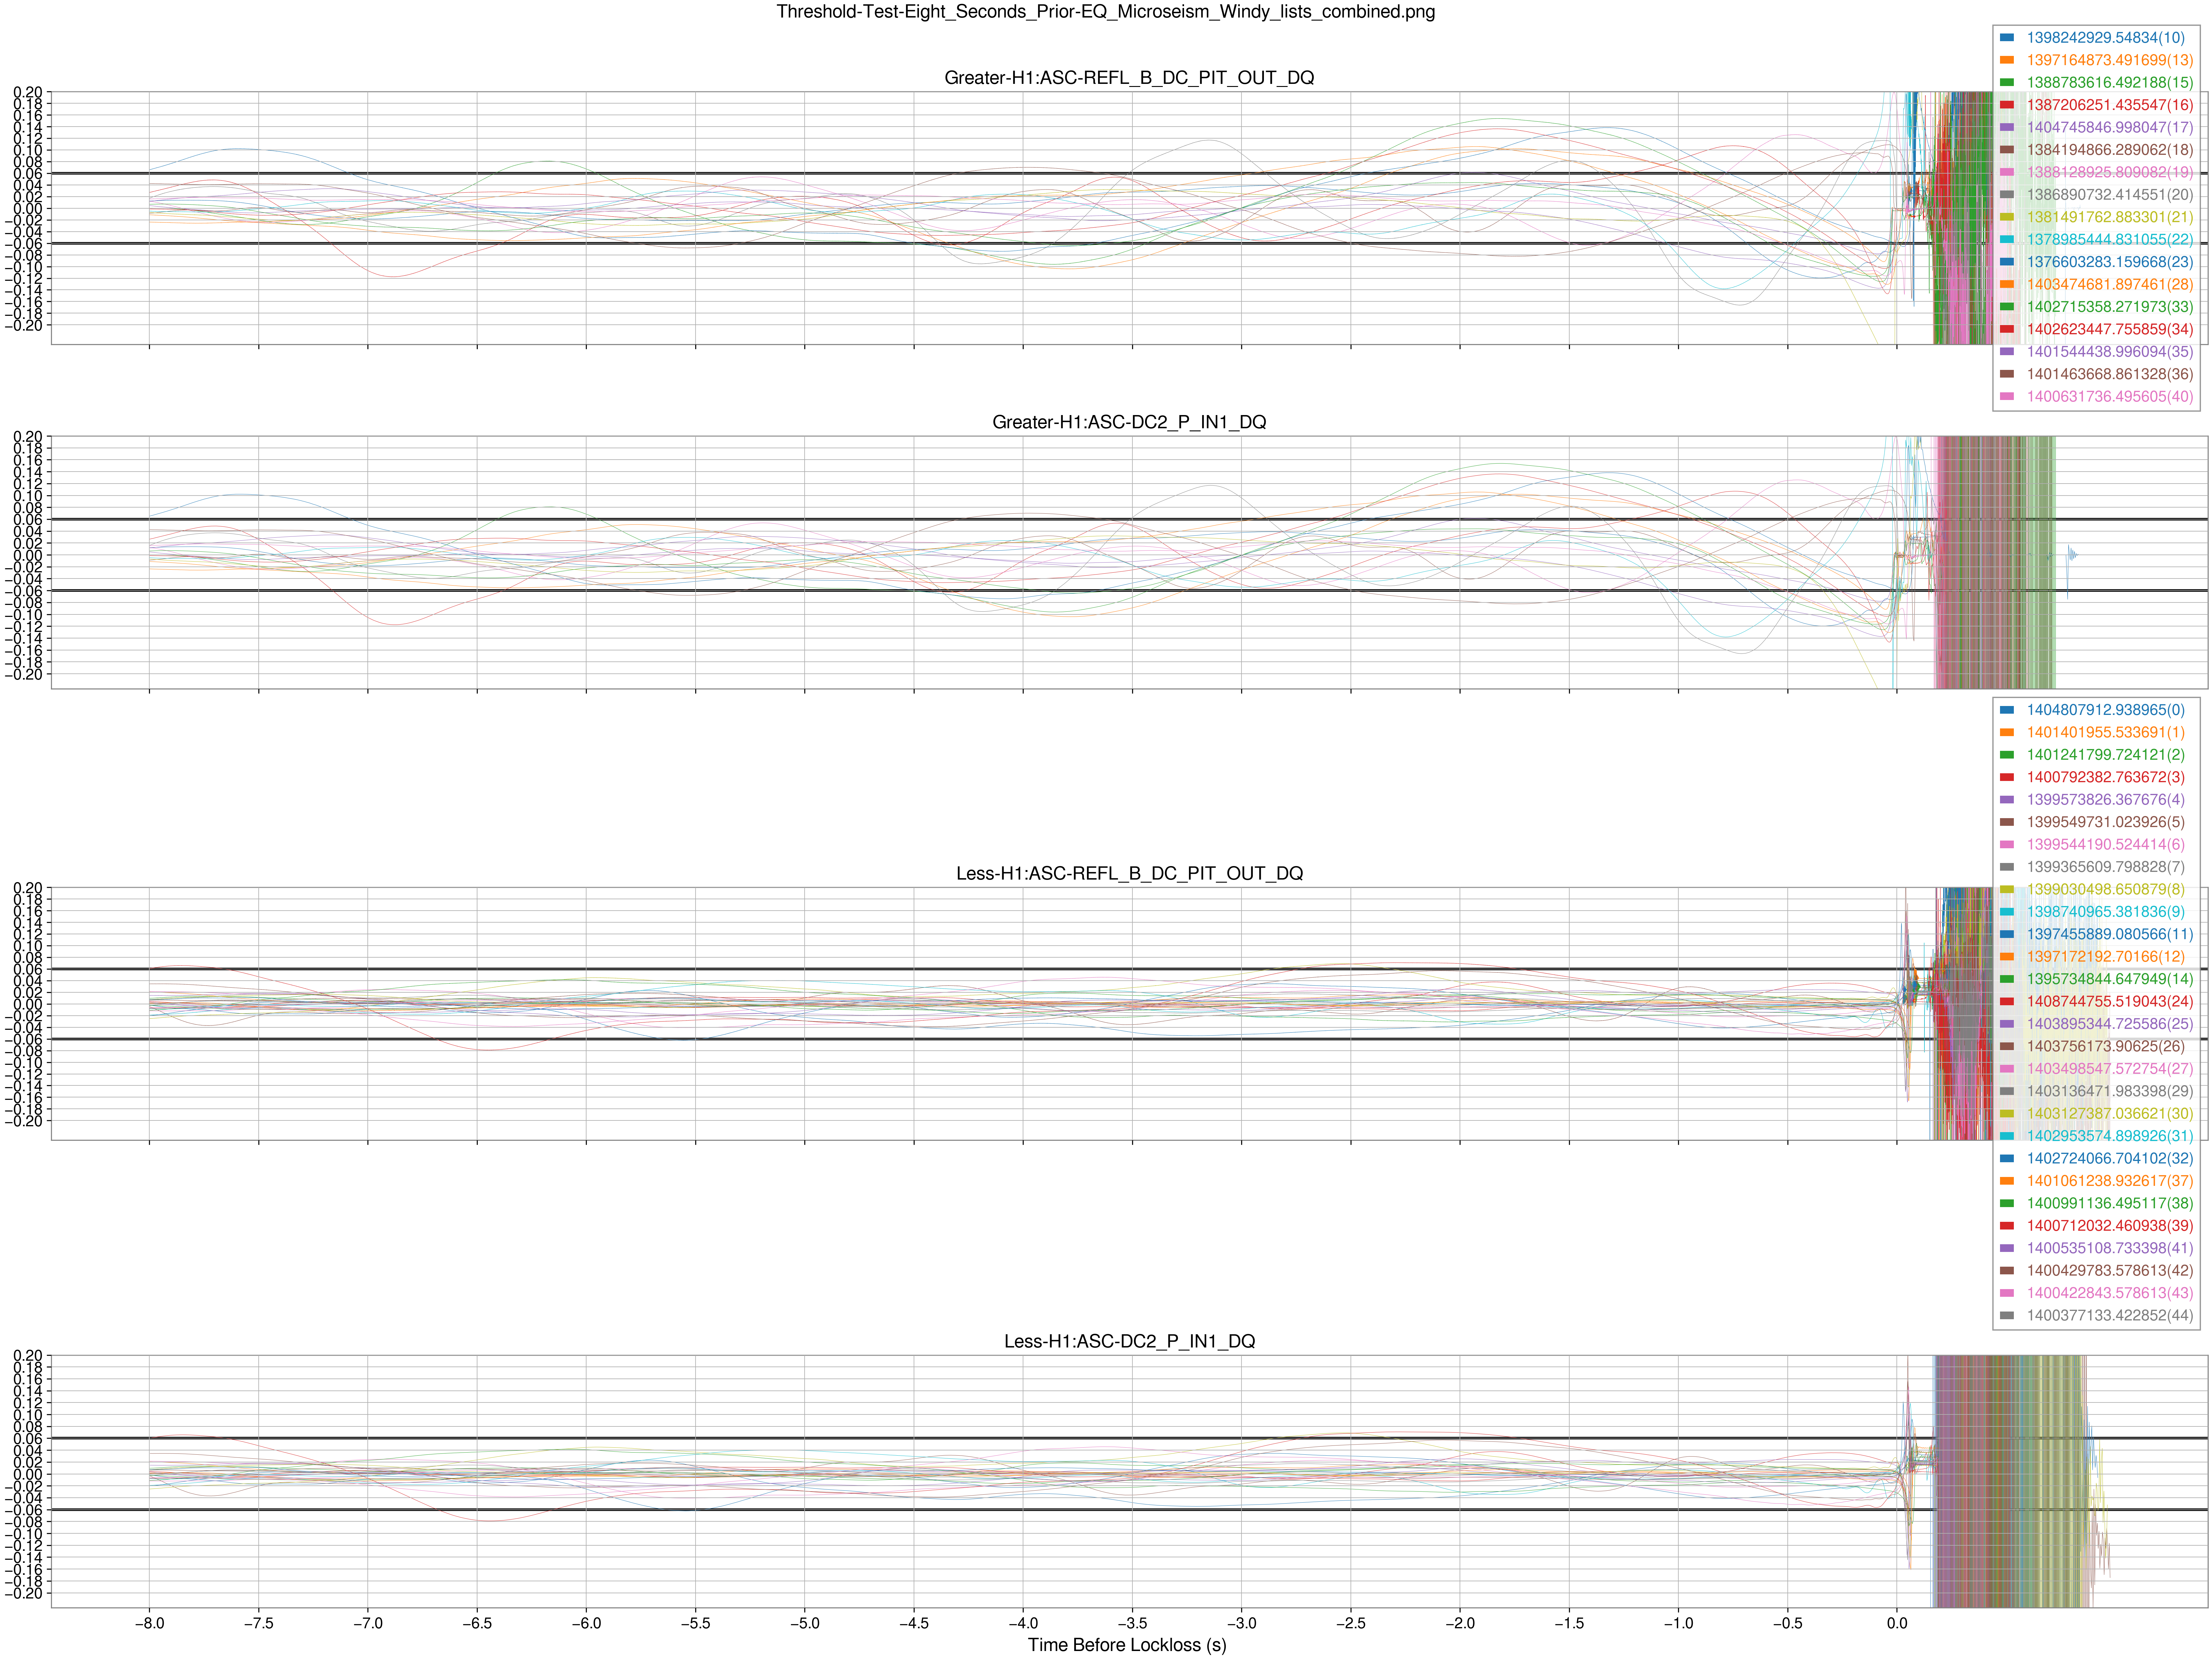
I started looking at the DC2 channel and the REFL_B channel, to see if there is a threshold in REFL_B that can be put for a new lockloss tag. I plotted the last eight seconds before lockloss for the various lockloss times. This time I split up the times into different graphs based on if the DC2 max displacement from zero in the last second before lockloss was above 0.06 (based on the histogram in previous comment): Greater = the max displacement is greater than 0.06, Less = the max displacement is less than 0.06. However, I discovered that some of the locklosses that are above 0.06 for the DC2 channel, are failing the logic test in the code: getting considered as having a max displacement less than 0.06 and getting plotted on the lower plots. I wonder if this is also happening in the histograms, but this would only mean that we are underestimating the number of locklosses above the threshold. This could be suppressing possible bimodal distributions for other histograms as well. (Looking into debugging this)
I split the locklosses into 5groups of 8 and 1 group of 5 to make it easier to distinghuish between the lines in the plots.
Based on the plots, I think a threshold for H1:ASC-REFL_B_DC_PIT_OUT_DQ would be 0.06 in the last 3 seconds prior to lockloss


Fixed the logic issue for splitting the plots into pass/fail the threshold of 0.06 as seen in the plot.
The histograms were unaffected by the issue.

Added code to the gitLab