Sheila, Louis, Francisco
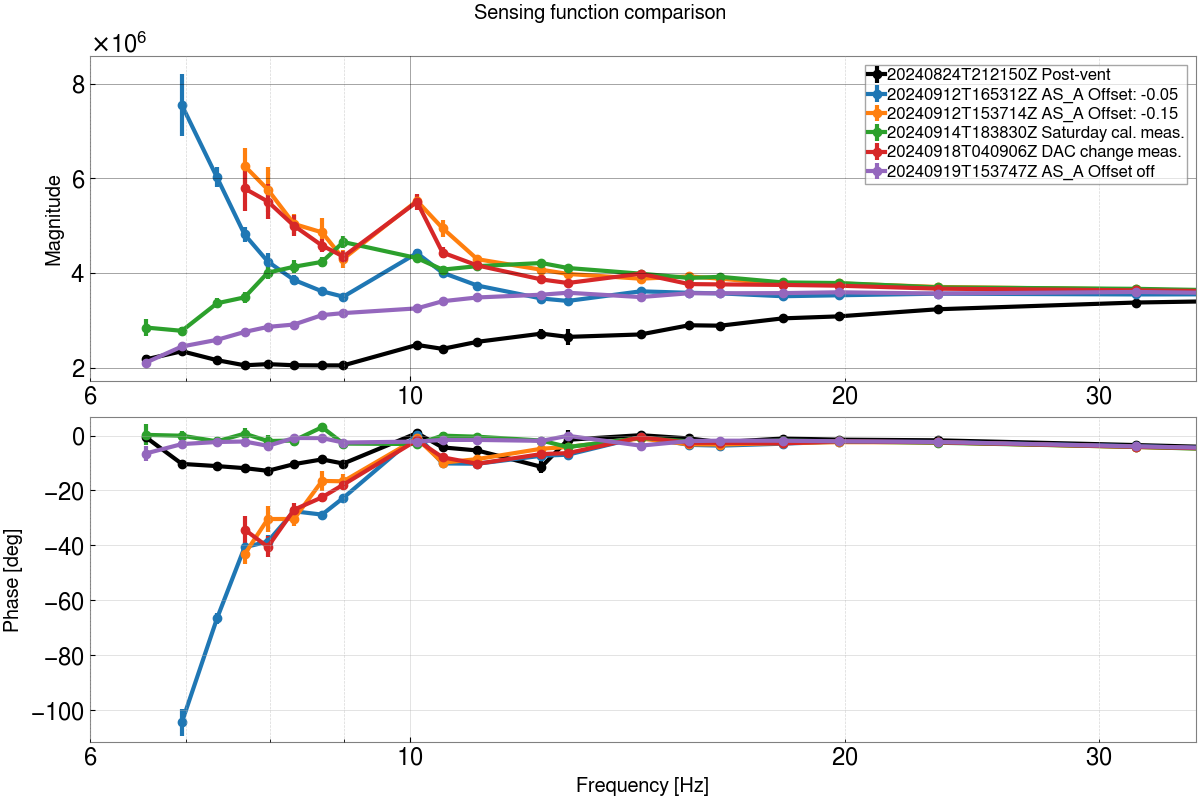
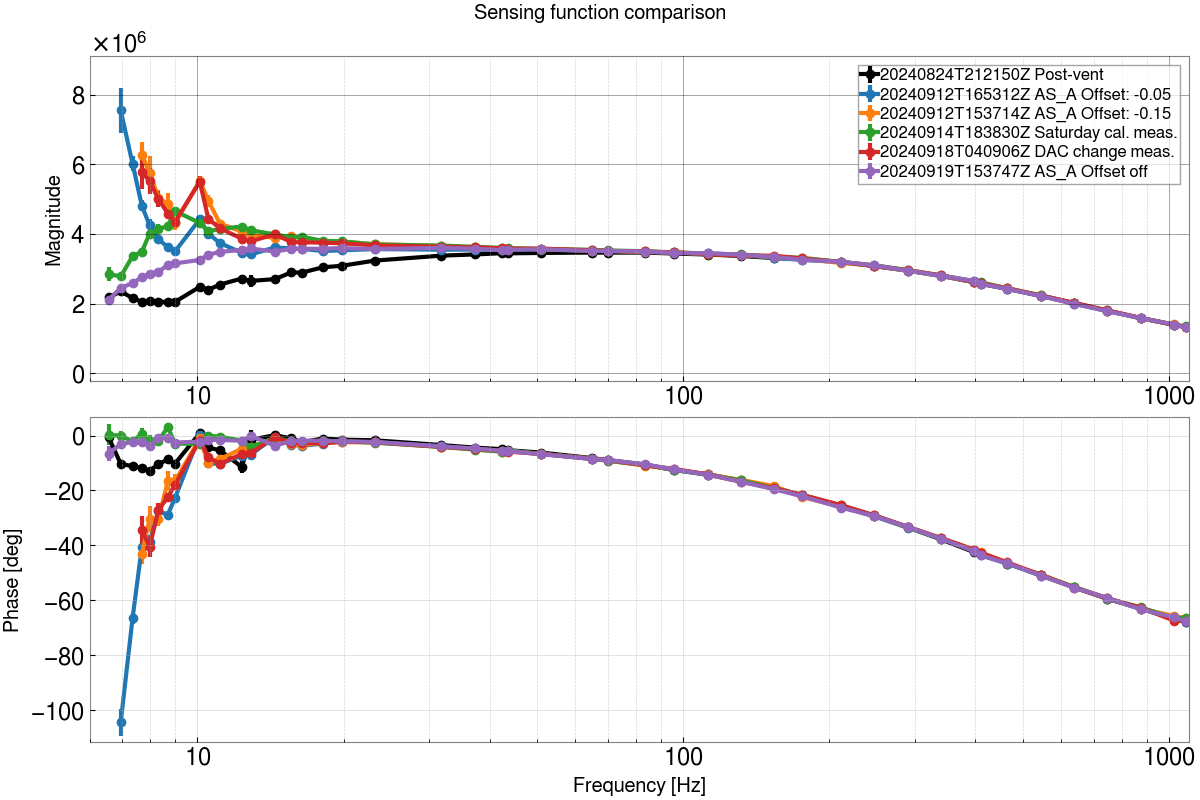
SUMMARY: On Thursday, September 19 2024, the low frequency error of the sensing function magnitude decreased (see figure 1) from turning off H1:ASC-AS_A_DC_YAW_OFFSET.
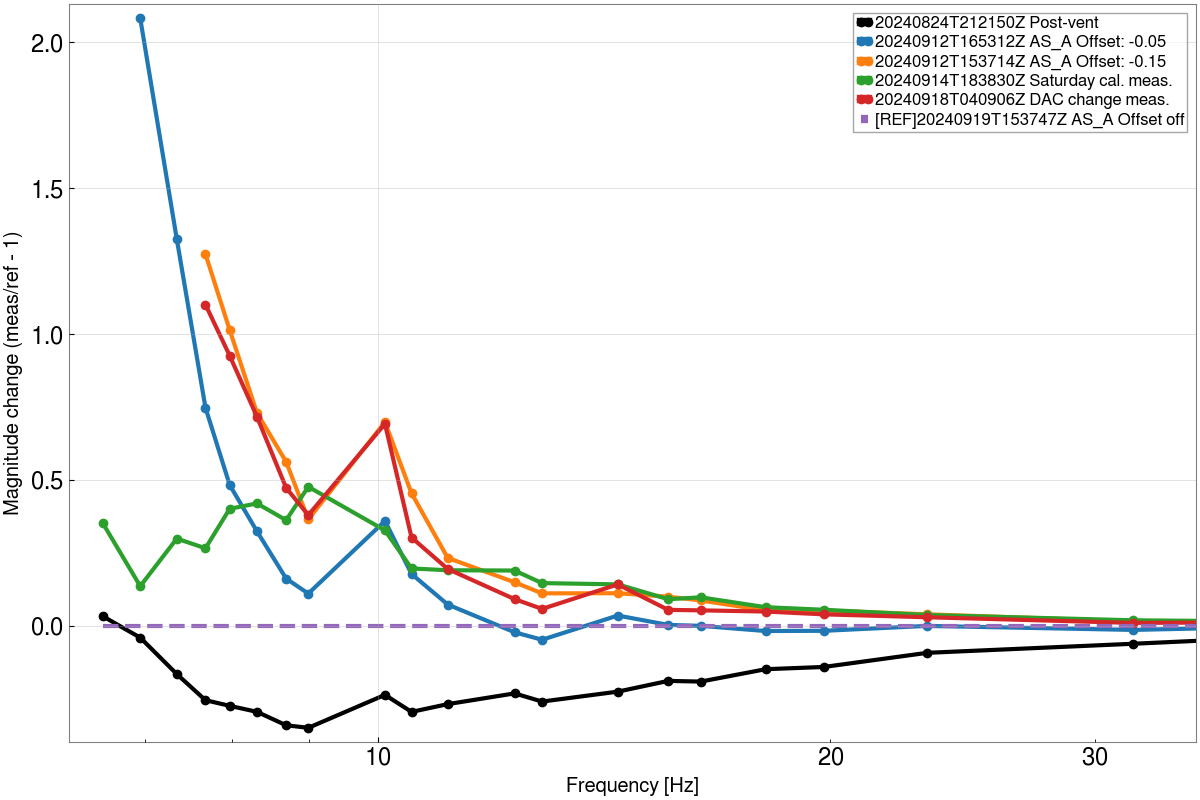
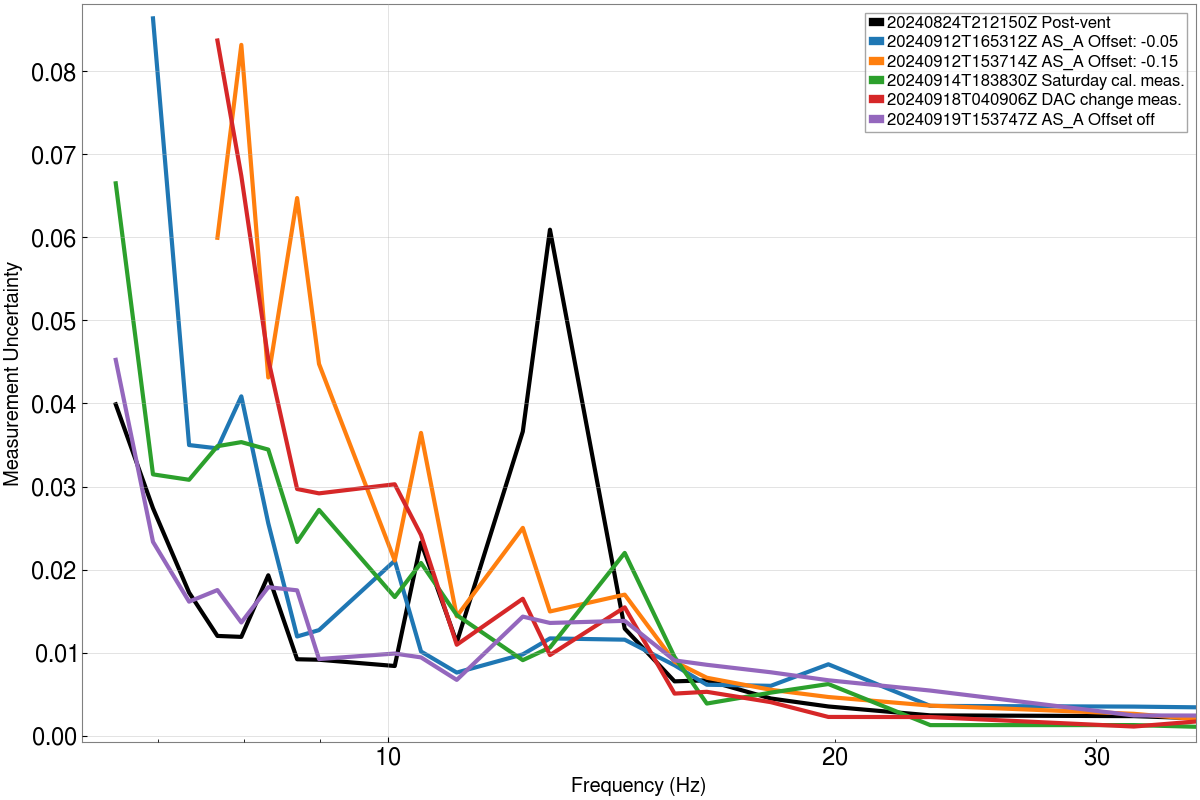
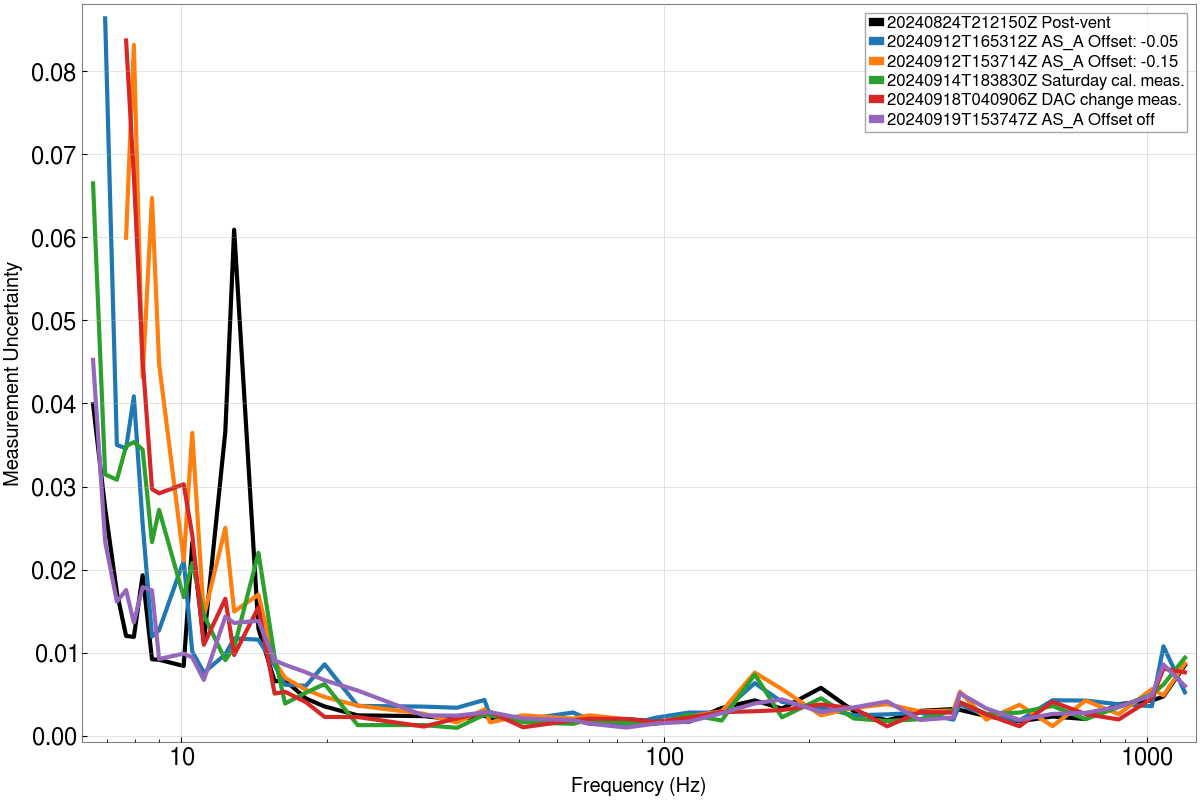
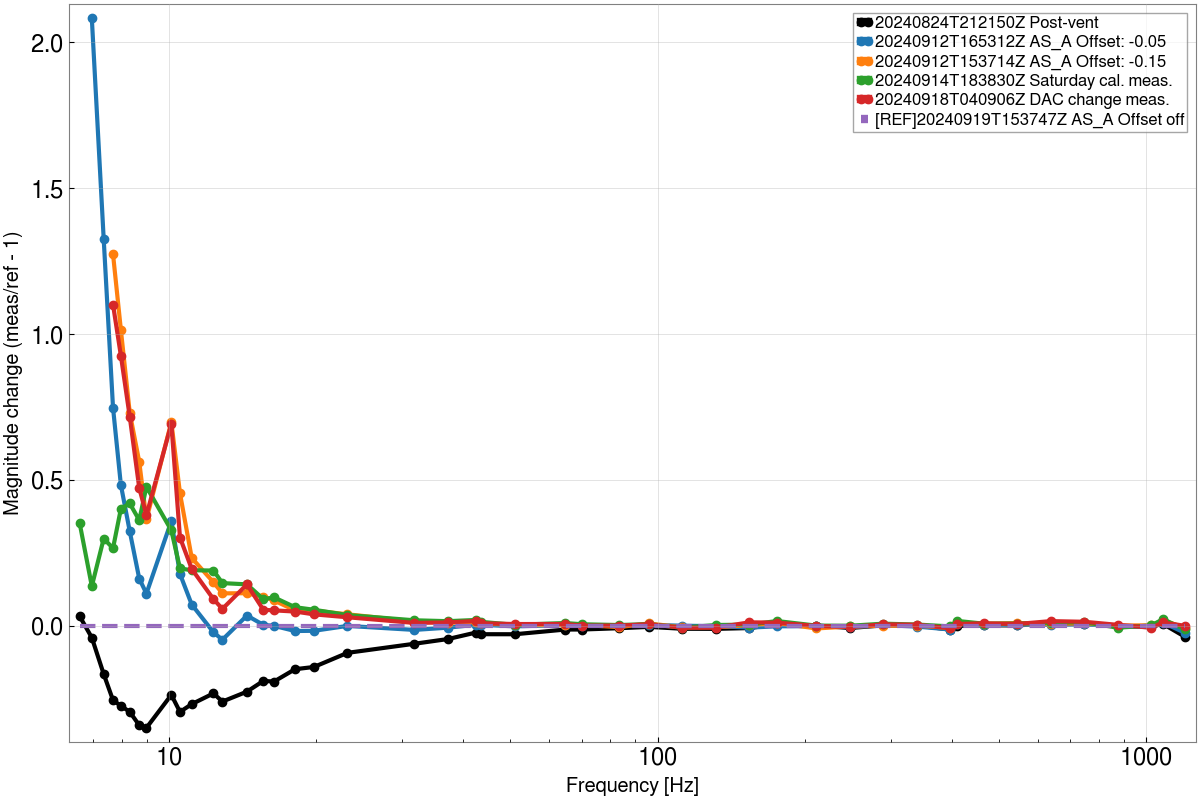
We turned off H1:ASC-AS_A_DC_YAW_OFFSET prior to making a calibration measurement (LHO:80180), given our observations from LHO:80063. Figure 3 shows a change in magnitude of ~5%, from turning off the AS_A_Y, in comparison to measurement 20240914T183802Z ("Saturday cal. meas.", the most recent measurement prior to our change), and figure 2 confirms an uncertainty of less than 3% for the frequencies (see table) of interest. The calibration measurements used in this log were done with a thermalized interferometer -- see LHO:79691, LHO:80057, LHO:80061, LHO:80093, LHO:80159, LHO:80180.
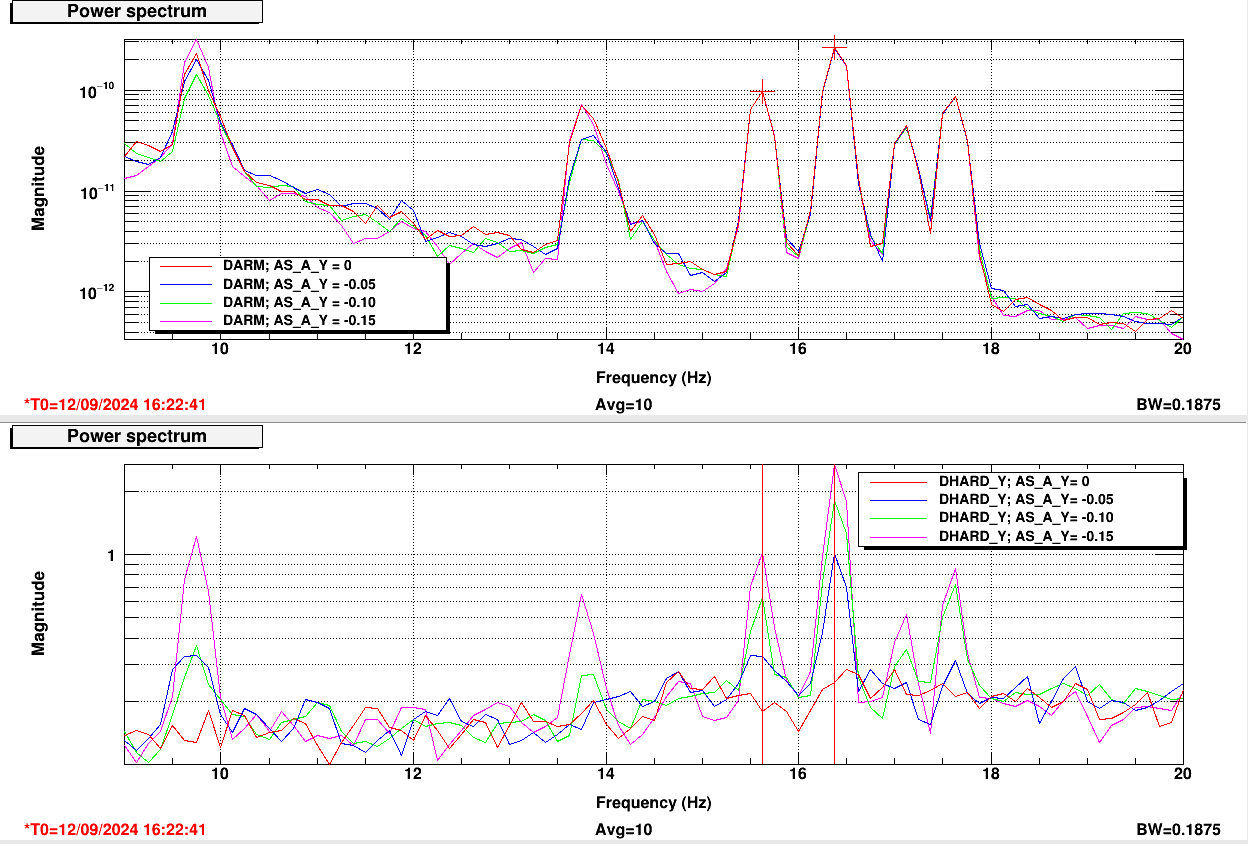
I'm adding figures 4, 5 , and 6 to summarize the coupling between DARM and DHARD_Y on LHO:80063. In figure 4, the trace where AS_A_DC_YAW_OFFSET = 0 (red trace, bottom plot) shows minimal coupling with DARM (top plot). The frequencies at which DHARD_Y PSD magnitude was minimized match the injections from the following table
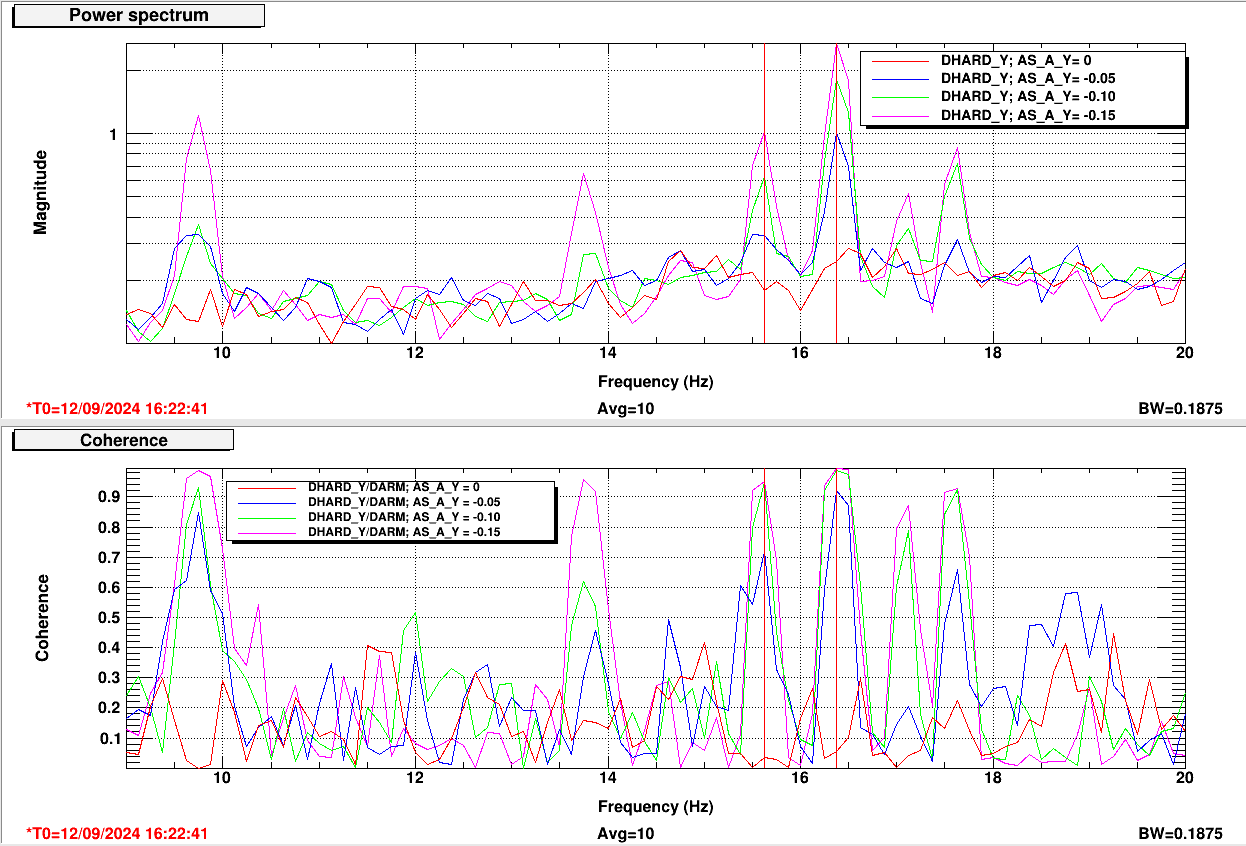
|
Frequency (Hz) |
Channel name |
|---|---|
| 15.6 | H1:SUS-ETMY_L1_CAL_LINE_FREQ |
| 16.4 | H1:SUS-ETMY_L2_CAL_LINE_FREQ |
| 17.1 | H1:CAL-PCALY_PCALOSC1_OSC_FREQ |
| 17.6 | H1:SUS-ETMY_L3_CAL_LINE_FREQ |
which indicates a coupling from DARM to DHARD_Y.
To contextualize, we are interested in understanding (and supressing) the parasitic cross-coupling between ASC and DARM loops (similar to LHO:50498, and, more recently, LHO:78606). The cross-coupling can be coming from DARM and affecting ASC or coming from ASC and affecting DARM. We are using the sensing function, instead of the actuation function, to rule out other coupling mechanisms. A technical note describing the parasitic cross-coupling is in development.
DESCRIPTION OF THE FIGURES
Fig 1 - out_10-30Hz: Sensing TF ranging from 10 to 30 Hz for different calibration measurement reports.
Fig 2 - unc_10-30Hz: Relative uncertainty of each TF from figure 1.
Fig 3 - ratio_10-30Hz: Change in magnitude of each TF from figure 1, using report from 20240919T153719Z as reference.
Fig 4 - darm_and_dhardy_psd: PSDs of (top) LSC-DARM_IN1_DQ and (bottom) DHARD_Y_OUT_DQ for each value of ASC-AS_A_DC_YAW_OFFSET (AS_A_Y for reference).
Fig 5 - dhardy_psd_and_coh: PSD of DHARD_Y and coherence of DHARD_Y_OUT_DQ/LSC-DARM_IN1_DQ for each value of AS_A_Y. Note the coherence when AS_A_Y = 0 (red trace).
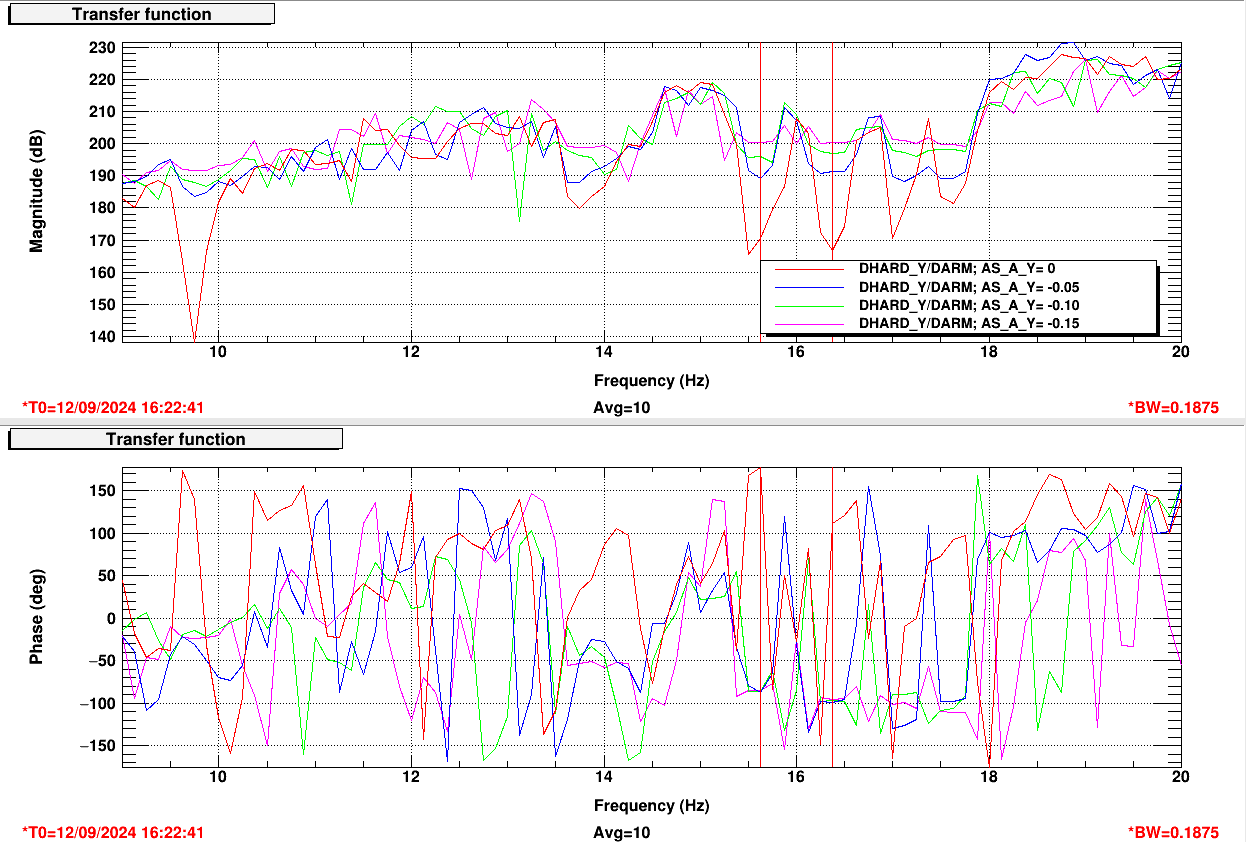
Fig 6 - dhardy_tf: TF of DHARD_Y_OUT_DQ/LSC-DARM_IN1_DQ. Even though the phase changes substantially at AS_A_Y = 0, the coherence on figure 5 indicates that the coupling between DAHRD_Y and DARM is low.
Fig 7, 8, and 9 are, respectively, full ranges references of figures 1, 2, and 3.


