jeffrey.kissel@LIGO.ORG - posted 15:43, Monday 25 August 2025 (86553)
H1 SUS SR3 M1 Pitch and Yaw Estimator: Local Performance Metrics After Changing Pitch Blend Filter to -v2
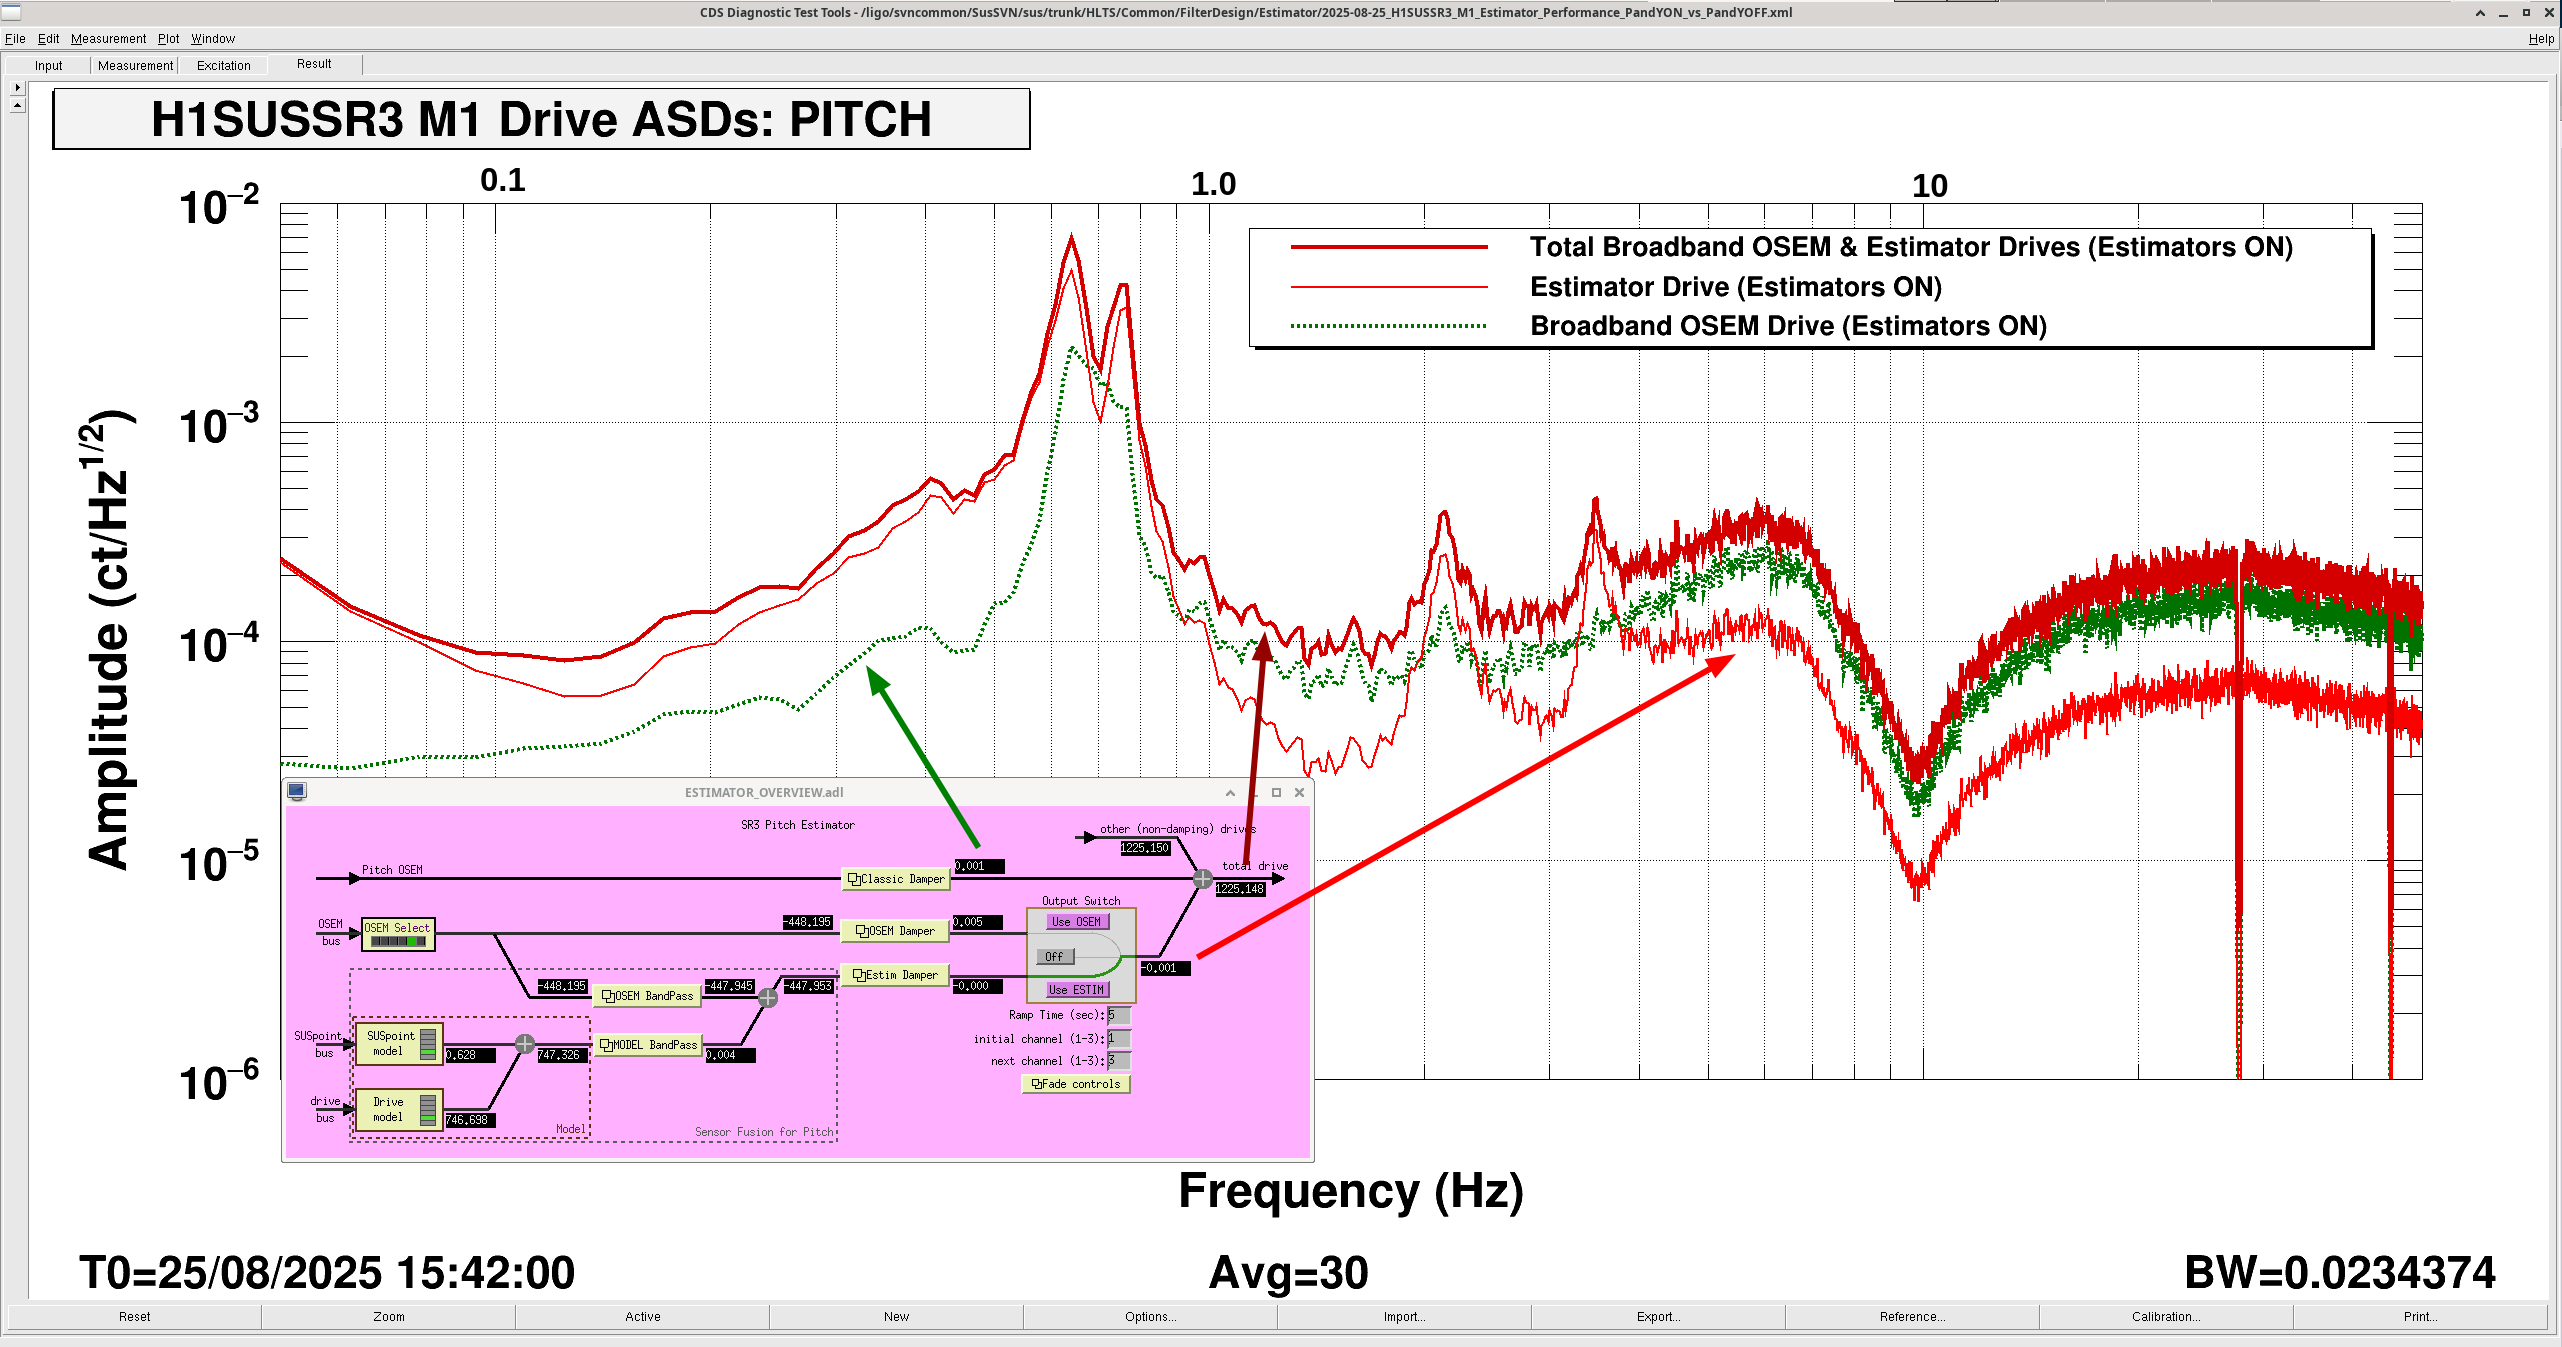
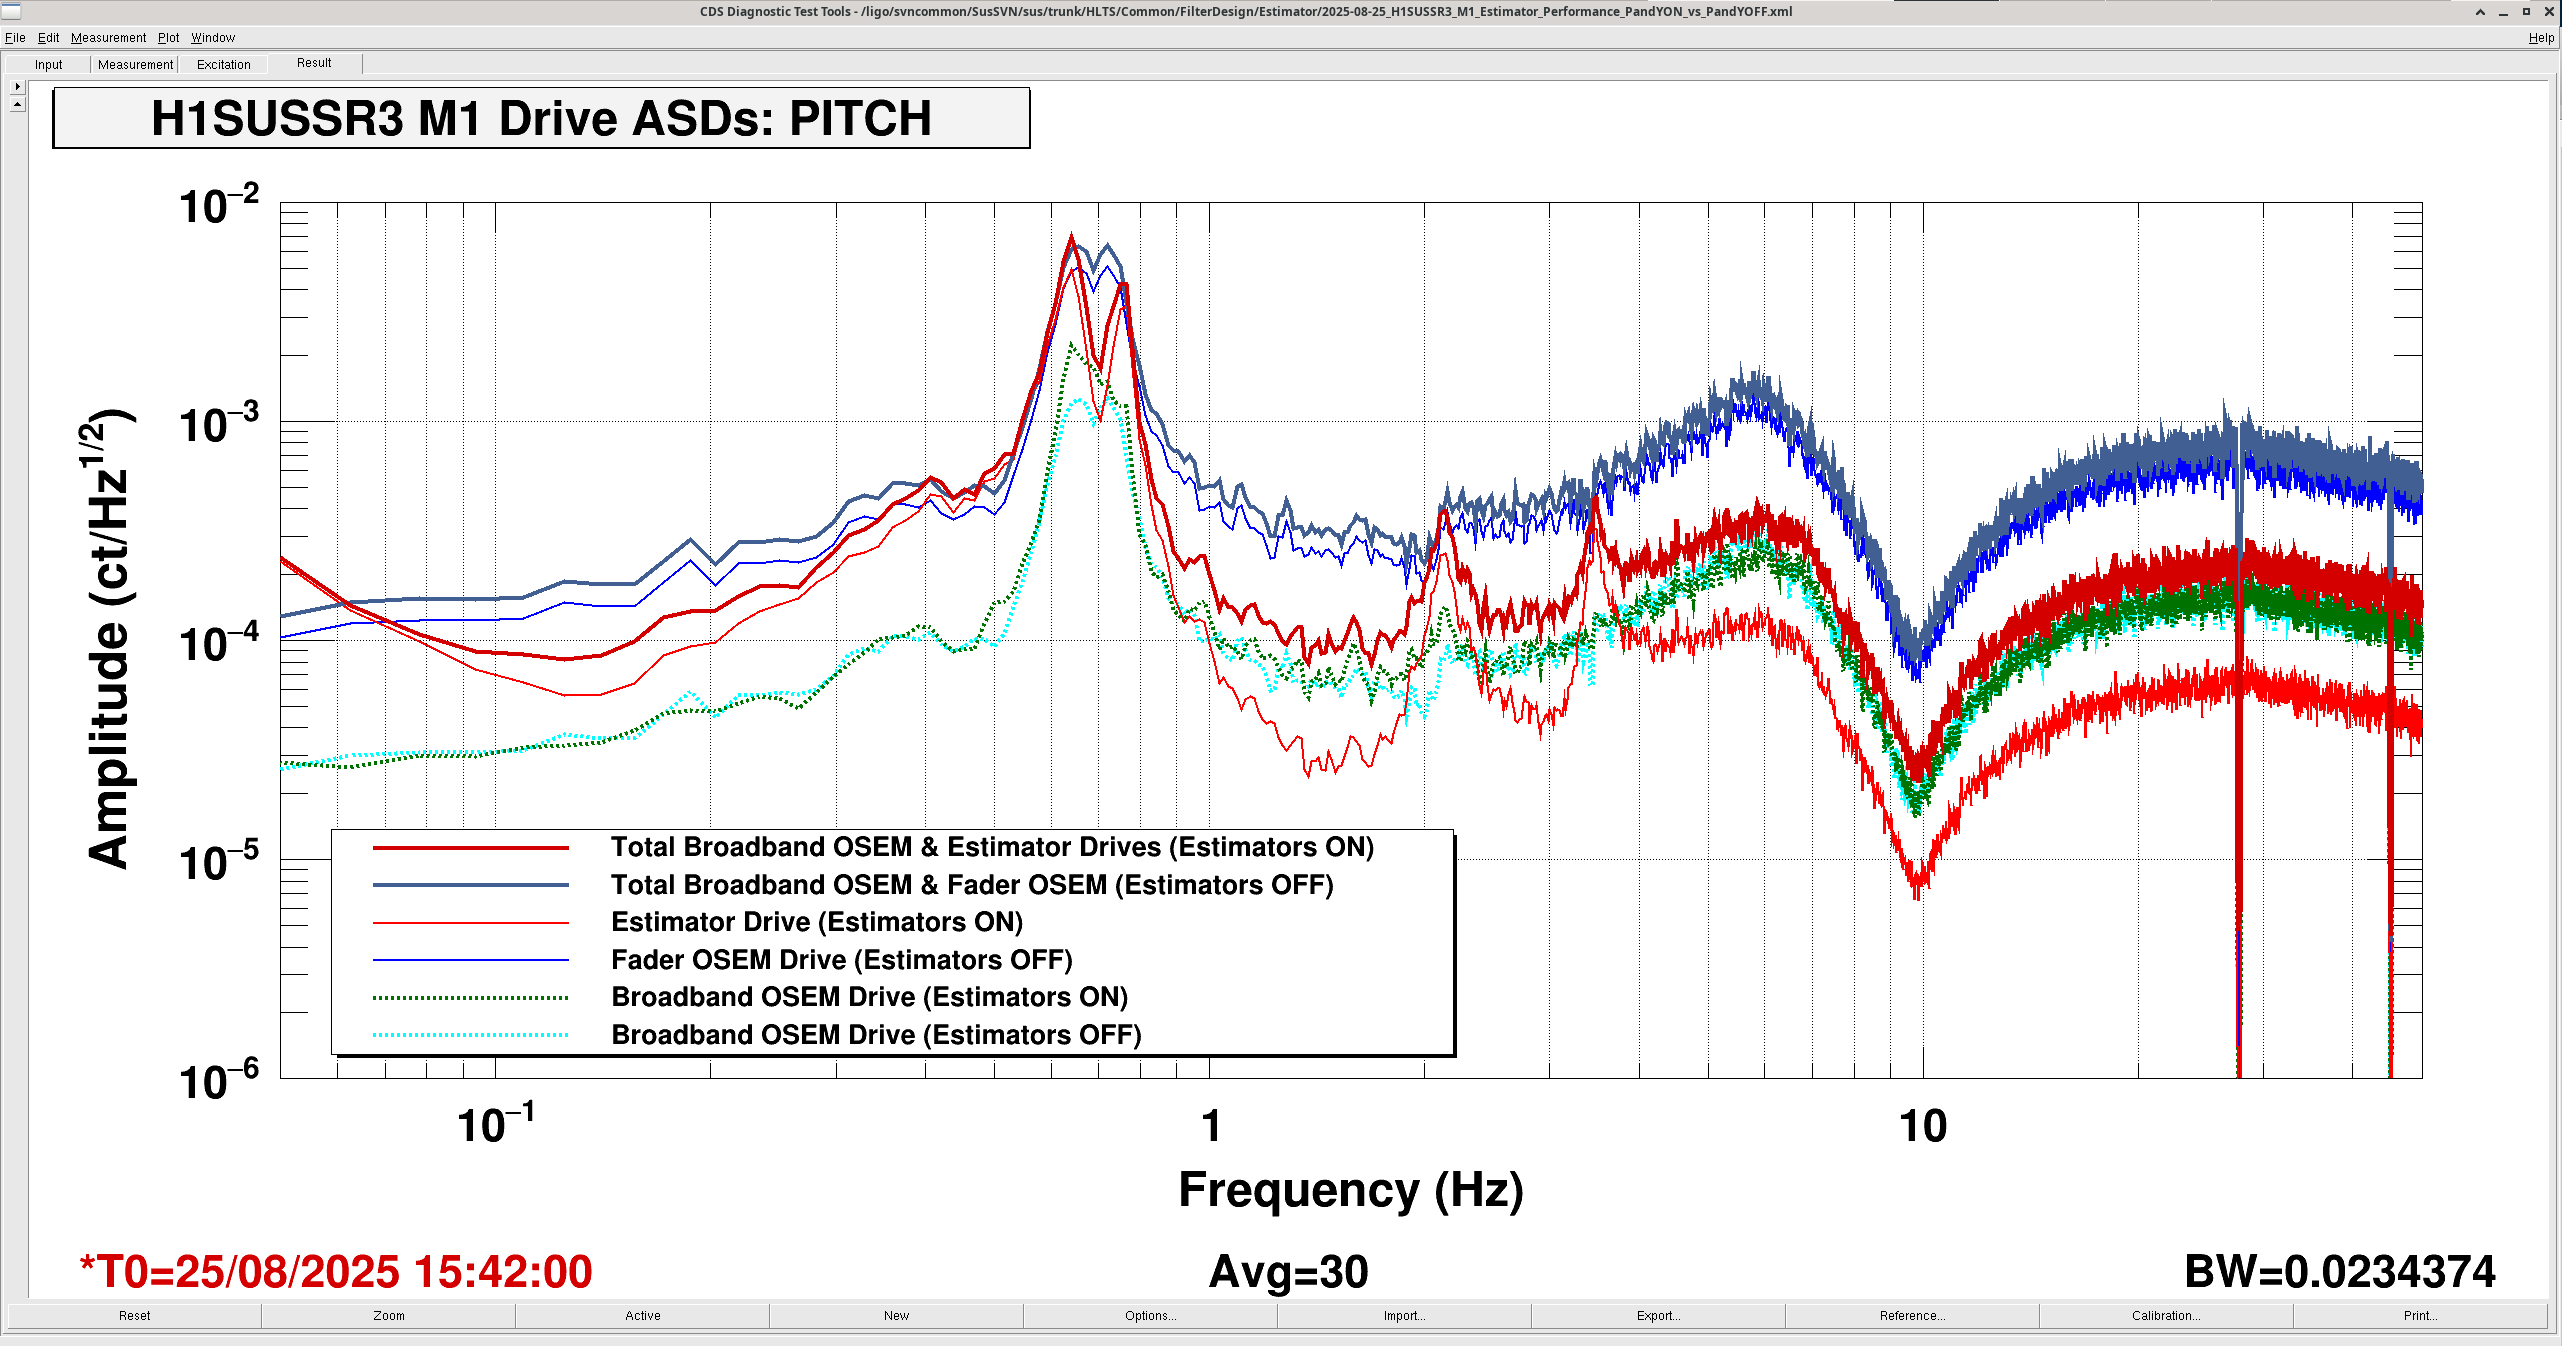
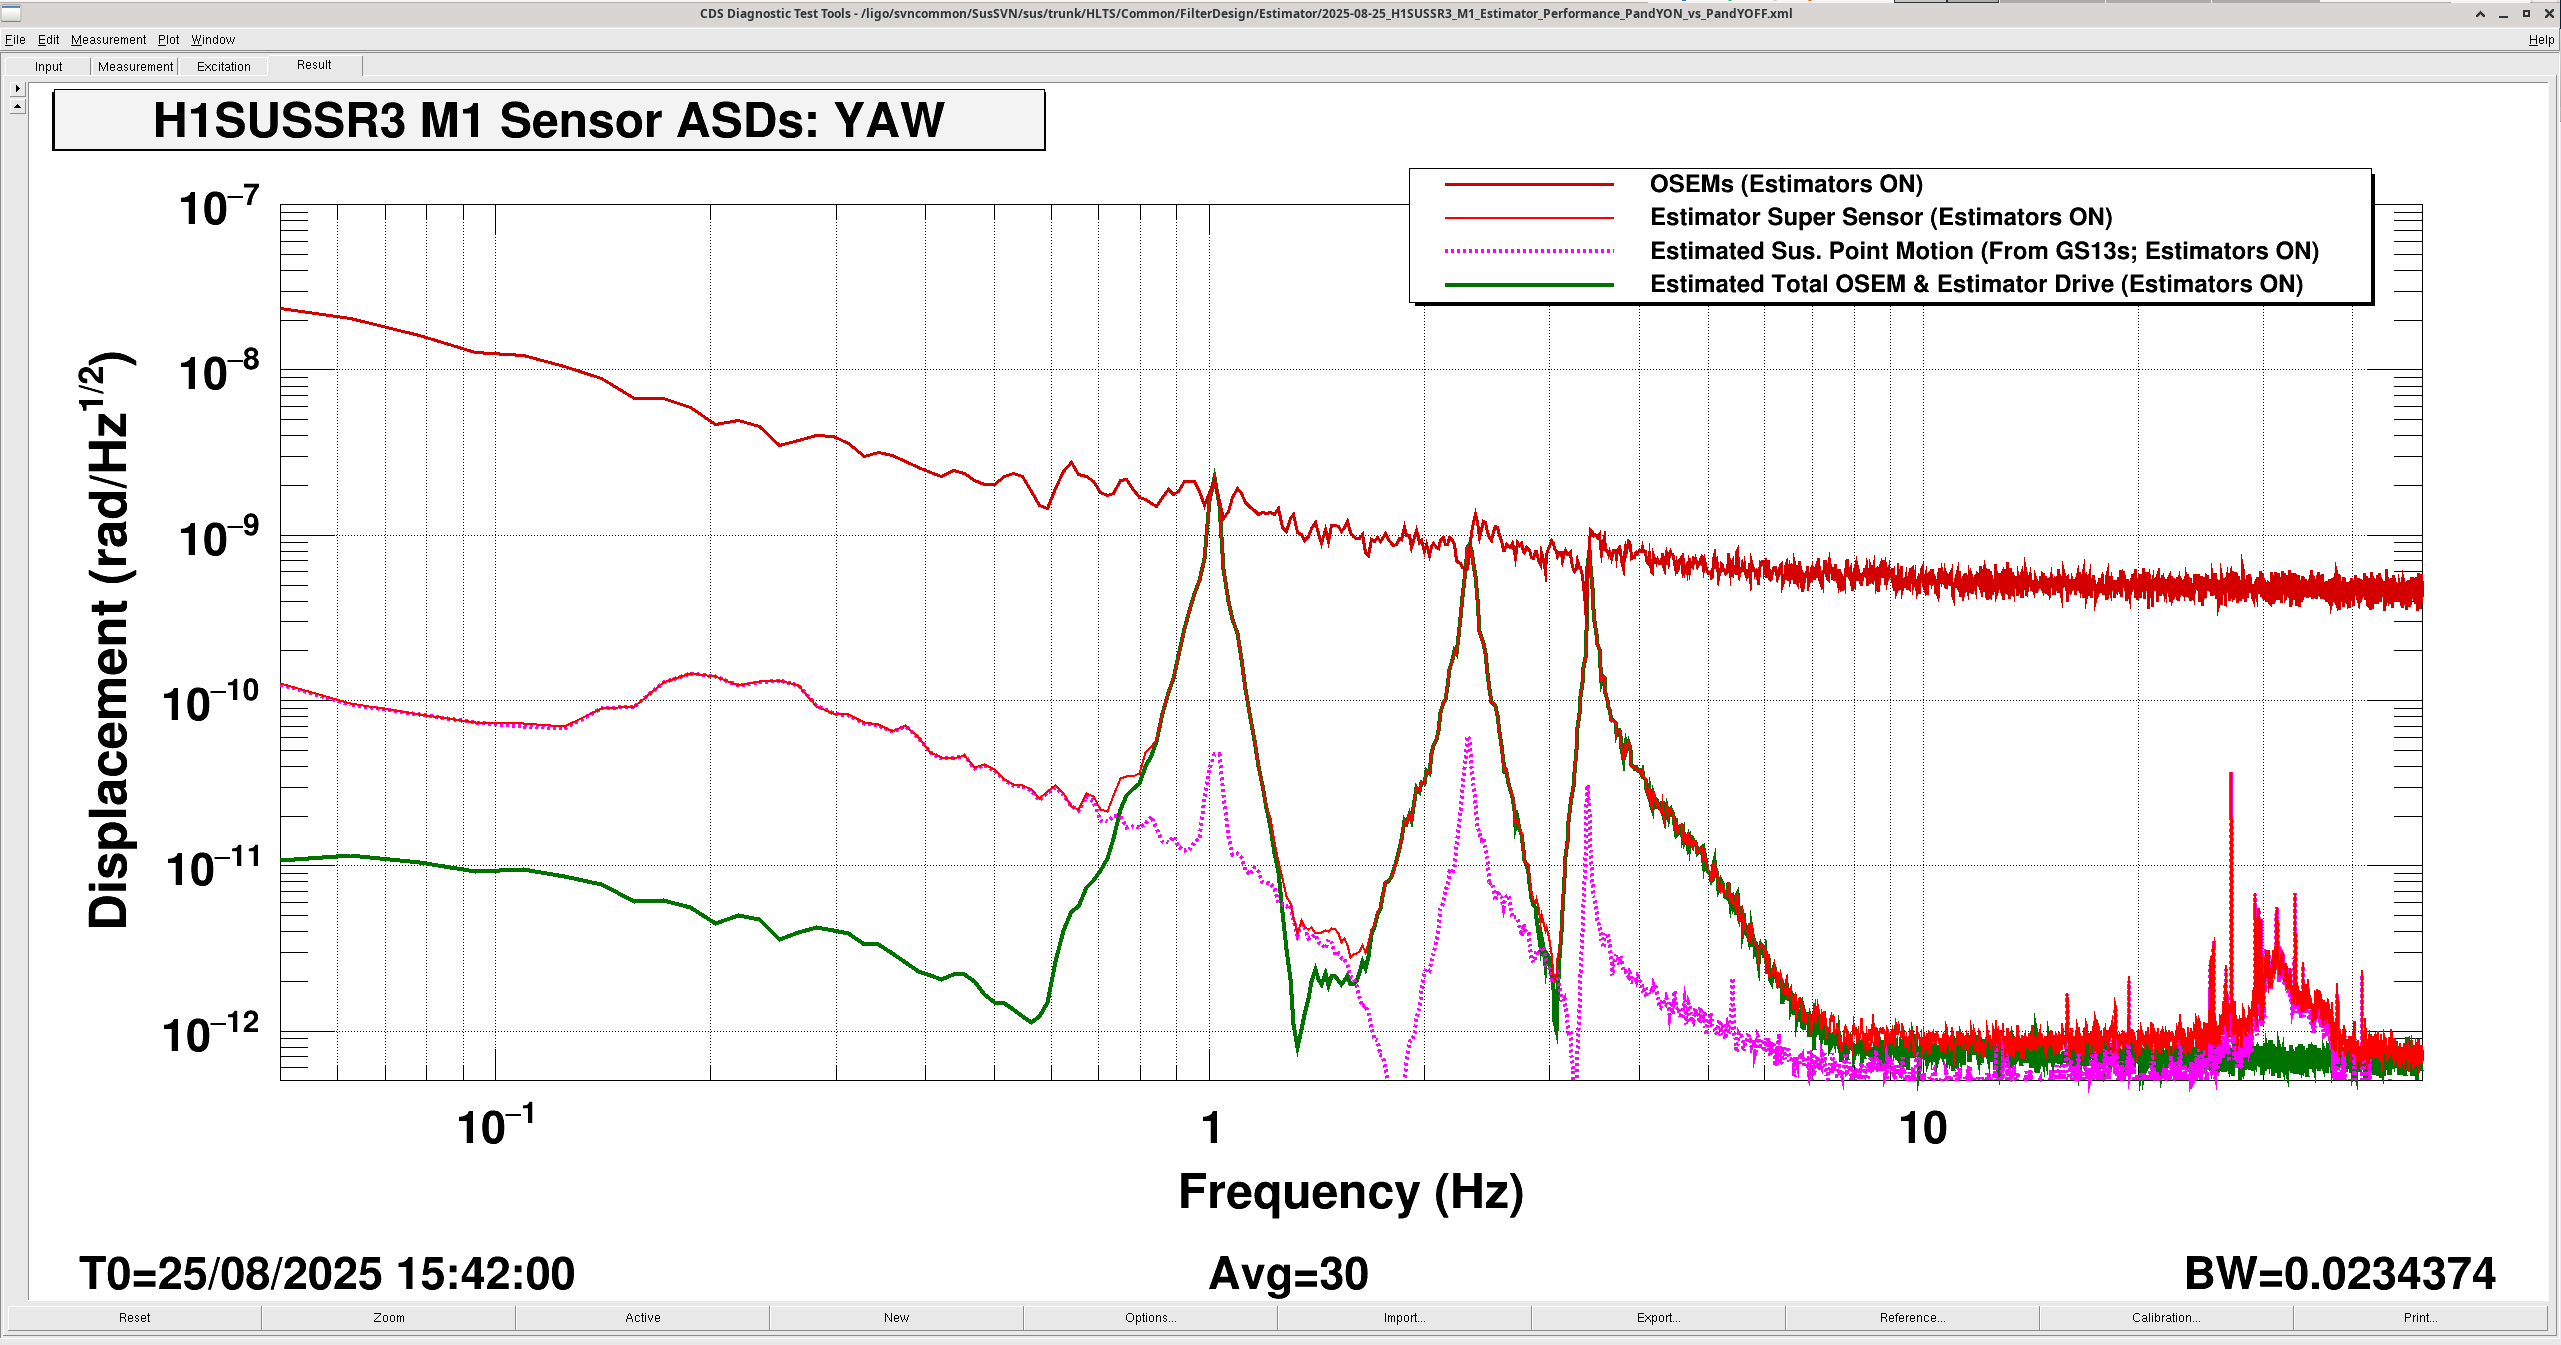
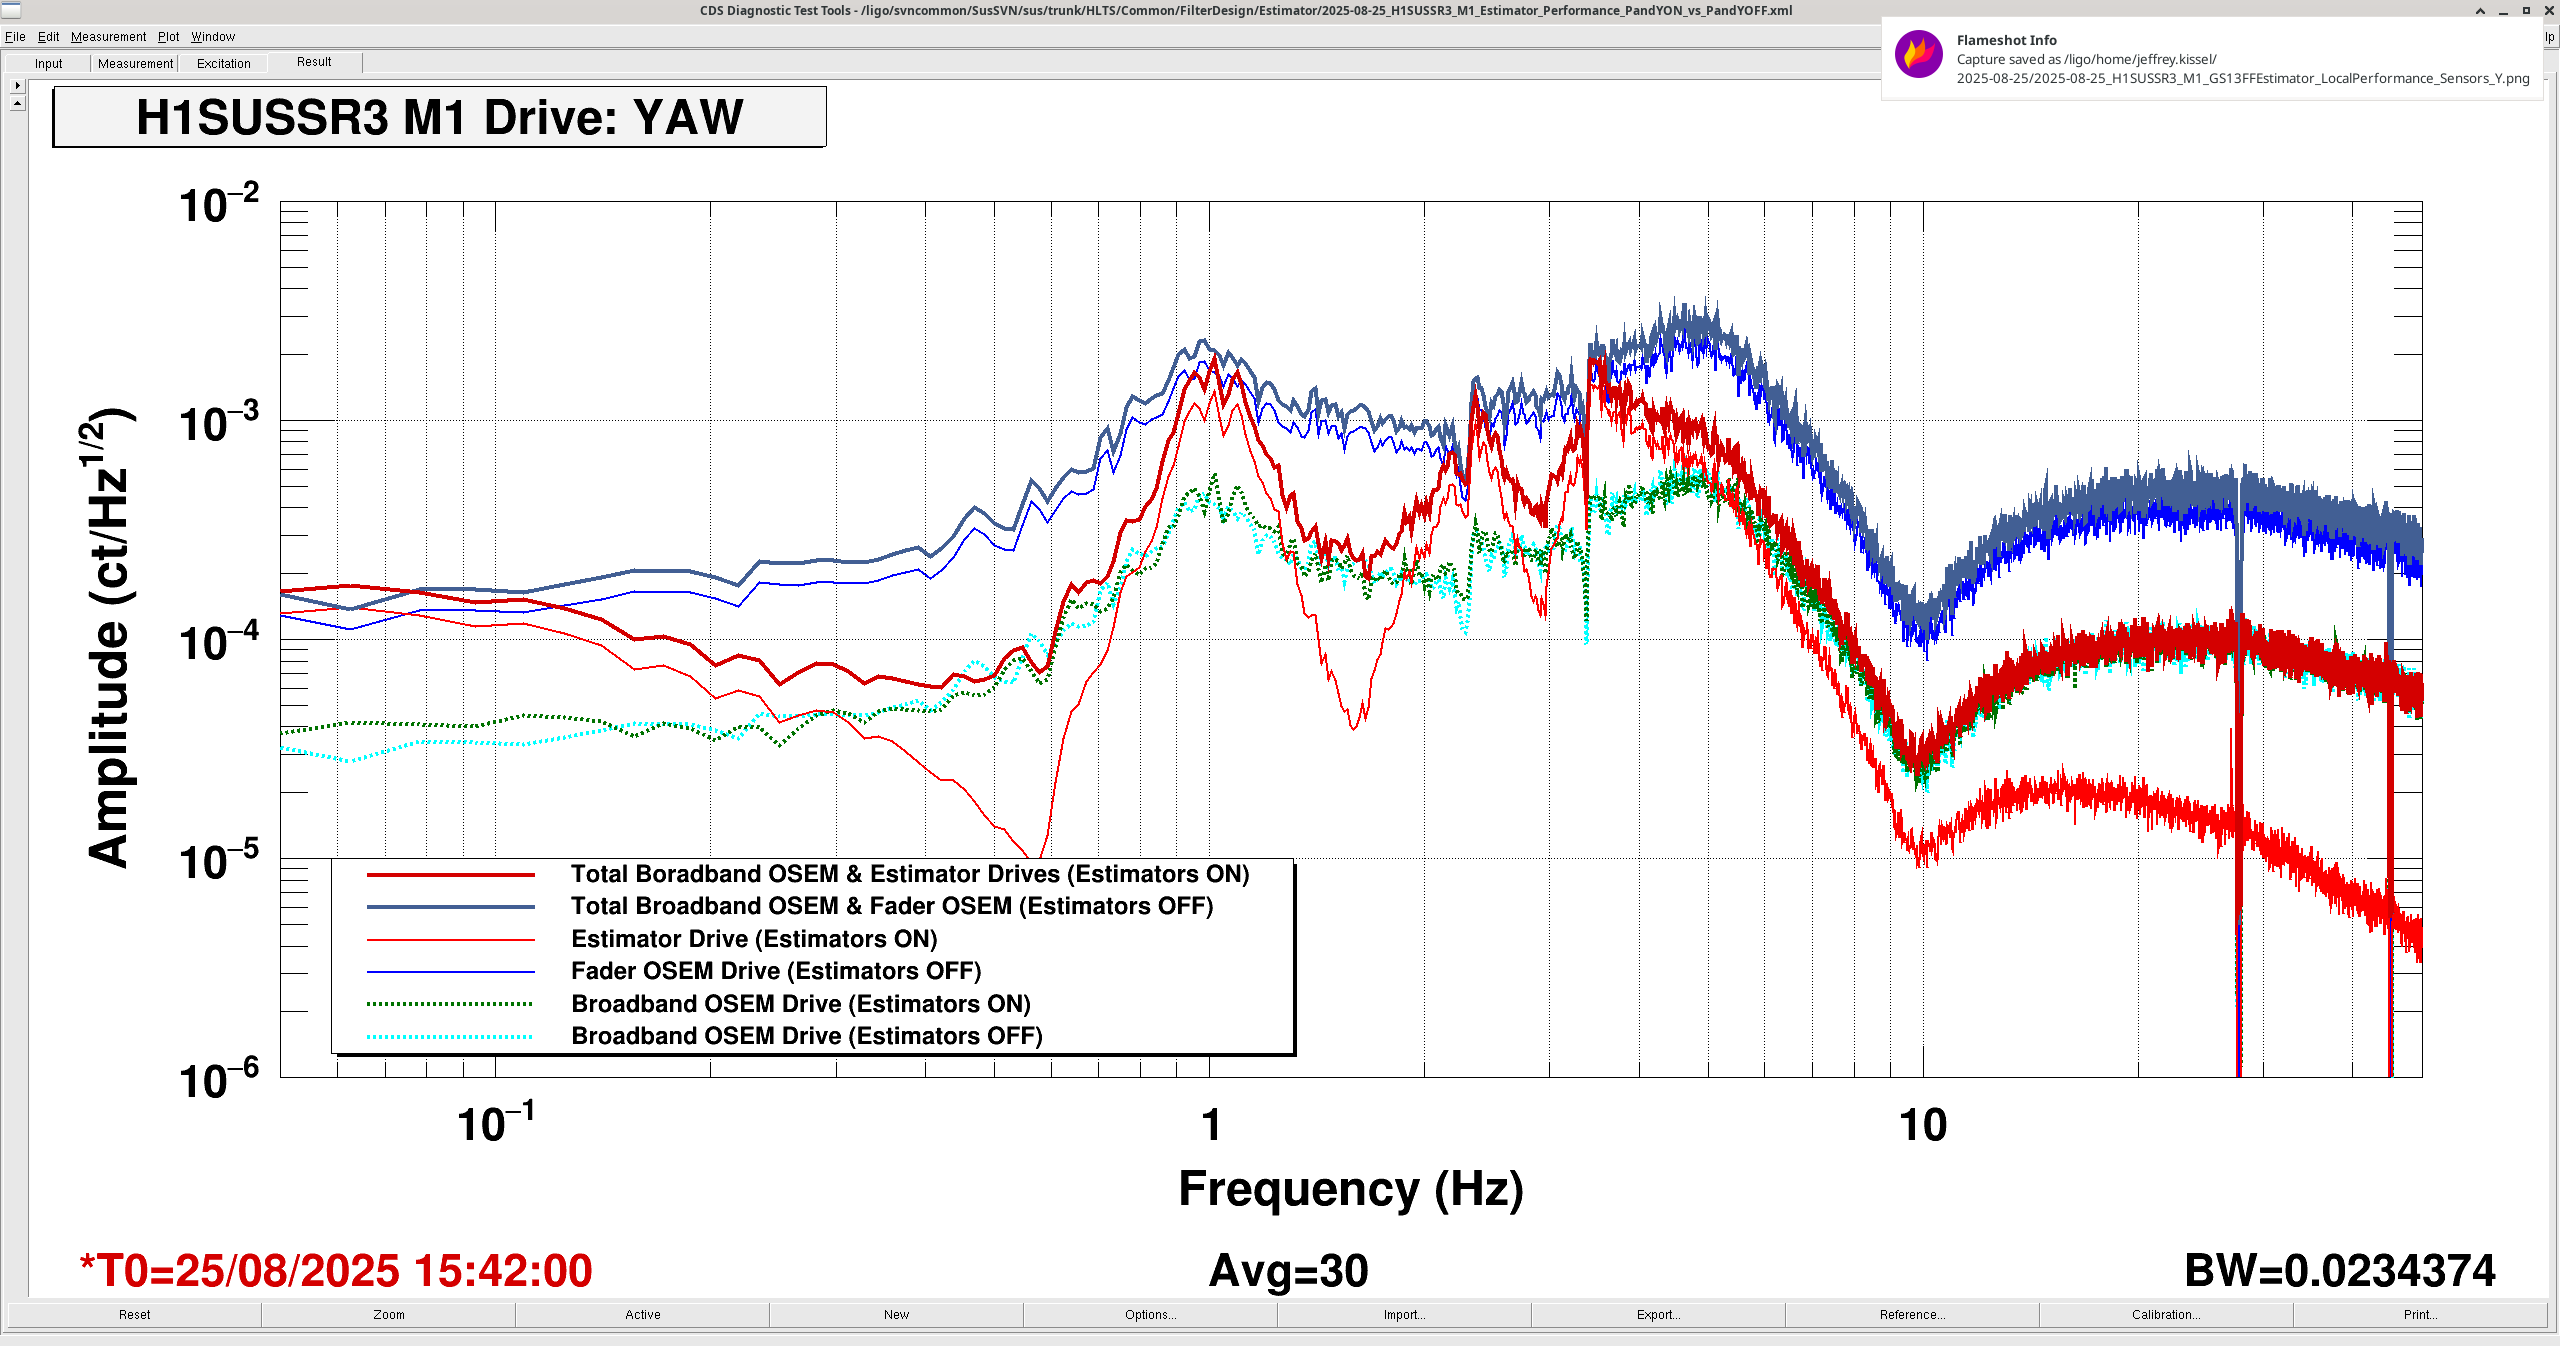
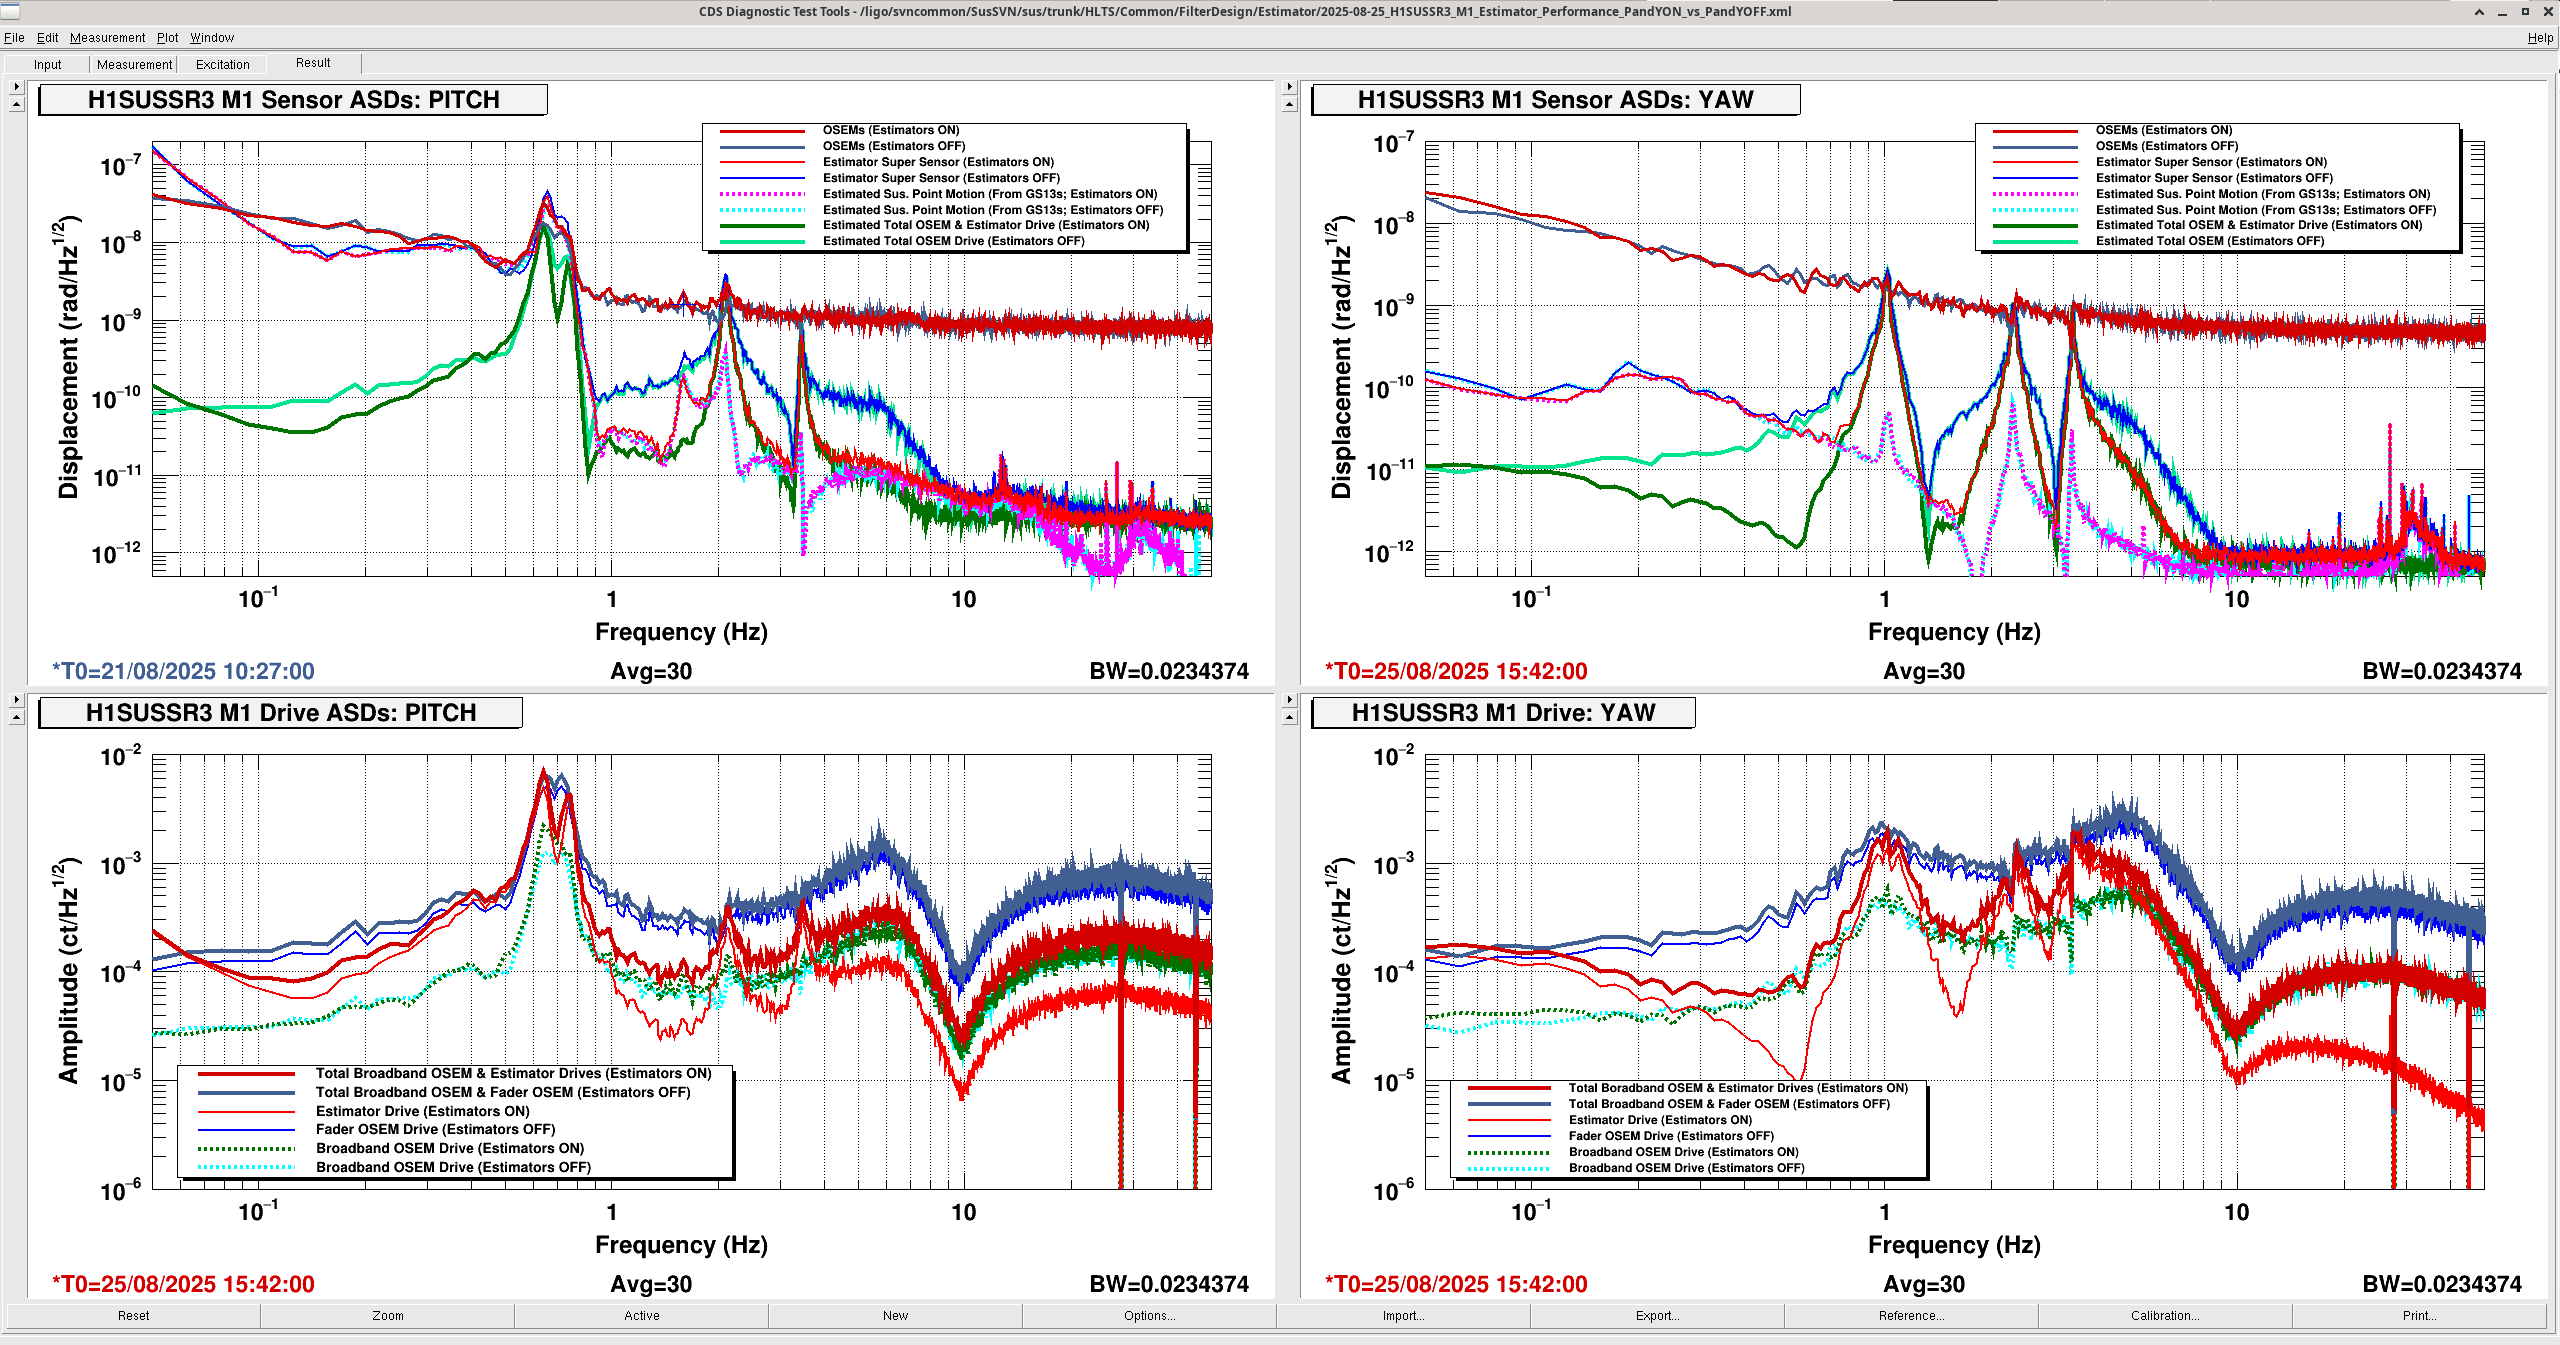
J. Kissel, O. Patane, B. Lantz

Continuing to refine my understanding of the metrics for the GS13 FF Estimator, I update the plots from LHO:86503. Also, I barely explained the plots there, so I'll try to do a better job here.

First Point: Concepts and Clarification
I've had a conceptual misunderstanding about what the estimator is at its core. Discussions with Brian have cleared this key point up for me: I had been calling the estimator a "GS13 Feed Forward Estimator," but that neglects a key innovation of the estimator. Not only does it use the HAM5 ISI GS13's to predict the susp-point motion input -- that's the feed-forward part -- but it also takes the total top mass *requested* drive from the suspension's M1 stage as well, and (with a 1 clock cycle delay) feeds that back as another input to the estimator. That's the composition of the estimator super sensor: the sum of the estimated input motion from the ISI as well as the total requested drive "including the estimator controls, what's left of the classic, broadband OSEM control, and any ISC drive". In the case of SR3, there is no AC ISC drive, just alignment offsets, so for the purposes of us looking at the ASDs as performance metrics it's irrelevant. So, saying that description of the total requested drive sentence again for SR3: "including the estimator controls [from GS13s and filtered estimated total drive] and what's left of the broadband OSEM control."

Remember, for SR3, the original total EPICs gain on the OSEM-only damping loops was -0.5. So, "what's left of the OSEM-only damping loops" is -0.1 of the OSEM-only damping loops and whatever percentage of OSEMs is allowed to pass through the OSEM / Estimator Super-sensor blend on resonance.

So -- what *are* the relevant local metrics?
On the sensor side -- it's interesting (and necessary) to compare
    (a) the OSEM signal
    (b) the total Estimator Super Sensor, which is comprised of
    (c) the Estimated M1 motion caused by Suspension Point Motion, predicted by the HAM5 GS13s
    (d) the Estimated M1 motion caused by M1 drive, predicted by the internally *requested* M1 drive

On the output drive side -- it's interesting (and necessary) to compare
    - the total internally requested drive; in the case of SR3 only from
       (1) the small, but broadband fraction of control from the OSEMs
       (2) when OFF, the larger broadband fraction of control from the OSEMs
       (3) when ON, the estimator control from
           . estimated M1 motion via GS13,
           . M1 drive, and
           . larger fraction of blend-filtered OSEM control

The first two "TRACEKEY" attachments show these 4-trace "sensor" and 3-trace "drive" plots for pitch, with the estimator overview screen handy so you can relate the traces with where they are in the control system topology.

Second Point: Pitch Sensors
Alright, so let's look at the pitch plots. Open the "Pitch Sensor Metrics when P and Y Estimators are both ON" alone plot first.
    (i) As we already knew, the raw OSEM signal can't see anything. It's dominated by its sensor noise for the vast majority of the 0.05 to 50 Hz frequency band, with *some* real on-resonance motion peaking up above the noise at 0.64 Hz,  0.75 Hz, and 2.1 Hz. The 3.4 Hz mode isn't resolved at all.
    (ii) The estimator super sensor, however, does an awesome job at predicting the M1 motion at these resonances above the first 0.64 and 0.75 Hz pair; it's dramatically less that the OSEM sensor noise. The fits to the GS13 Sus. Point to M1 motion and M1 Drive to M1 motion are quite fruitful. In this f > 0.75 Hz region, you get an interesting mix of GS13 and M1 stage drive, alternating which is better. I'm a little surprised to see a 1.59 Hz mode estimated by the GS13s that isn't otherwise controlled at all, because it doesn't show up in the total M1 drive trace.
    (iii) Below 0.75 Hz -- the estimator seems to show that the M1 motion is completely dominated by suspension point motion. Is that real, or is that GS13 noise? Not so clear with these local metrics. The fact that ASC sees worse noise from 0.1 top 0.3 Hz with the estimator on (see LHO:86507 e.g. SRC2 Pitch Control signals), implies to me that it *is* GS13 noise, and we should still high-pass at least the pitch damping loop controller.

OK. Now that you're used to the noise budget, turn on the comparison of these traces between P & Y estimators ON vs. OFF.
     (i) For the OSEMs, all the can see is the following: the estimators have made the on-resonance motion *worse* between 0.64 and 0.75, and at 2.1 Hz. But -- the OSEMs are still in-loop sensors, so some factors of 1 / (1+G) - like factors may be in play, confusing us as to whether this an artifact of their being less on-resonance loop suppression ... or something. We've gotta math that out still. (Again, the out-of-loop ASC error/control signals shown in LHO:86507 seem to indicate that there is more real on resonance motion, and the OSEMs are faithfully telling us the *change*. The on-resonance story, especially for pitch is going to continue to be "complicated" for a while.
     (ii) Comparison between the bright red vs. bright blue estimated super sensor really shows where we win pitch noise improvement with the P and Y estimators: between resonances in the frequency band between 0.75 and 8 Hz. Since we're using a factor of 5 less OSEMs (aside from on-resonance), the total M1 stage drive motion from the broadband OSEM damping loop drops by factors of 10x.
     (iii) Interestingly, the GS13s still predict suspension point motion to dominate below 0.75 Hz regardless of whether the estimators are on, but the M1 drive signal (unfortunately very subdominant) drops by a factor of 2x ish between 0.1 and 0.3 Hz at the microseism -- and it's by the same ratio of raw-OSEM noise to estimator super sensor / GS13 suspension point prediction. *That* says to me that we *are* doing better with the estimators ON at the useism, vs. what the ASC sensors are saying...

Third Point: Pitch Drive
Now let's switch to the M1 stage drive breakdown for pitch. Here, the comparison is a bit tough to grok immediately, because
    - With the estimators OFF, you're damping the SUS with -0.5 worth of OSEM broadband damping, but it's split through two paths -- the "classic" broadband path with 0.1 gain, and a "fader" broadband path with gain of -0.4, and summed (thanks linear algebra!).
    - With the estimators ON, the -0.1 gain "classic" path remains, for the other path the OSEMs are now blended to only have -0.4 gain on resonance.
That explains the drive comparison plot then:
    (i) The off-resonance, total requested, M1 drive -- with the estimators ON -- drops as shown in the sensor plot, but does not drop entirely to the noise floor of the GS13 sus. point estimate because -- above 0.75 Hz and off-resonance the stage 1 motion is still limited by the -0.1 gain broadband OSEM path (which doesn't change from ON vs. OFF).
    (ii) The on-resonance story especially at and in-between the 0.64 and 0.75 Hz resonances, remains "interesting" / confusing. There's *more* drive from -0.1 gain OSEM path on resonance with the estimators on vs. off, but difference between the -0.4 OSEM path and full-estimator path drive is better focused on the two resoances, dropping the total-total drive in-between. This is confirming that something in the OSEM sensor path incorrectly sensing the motion in between 0.64 and 0.75 Hz and the -v2 pitch blend filters -- which restore the use of the drive / GS13 FF super sensor for this tiny, in-between frequency band -- is doing the right thing.

Fourth Point: Yaw Sensors
Ok -- now on to yaw sensors. I attach both the P&Y Estimators ON alone as well as ON vs. OFF, but you're good enough at looking at these now and yaw is apparently a much more simple story, so let's just open the ON vs. OFF comparison.
     (i) The GS13 estimate of the suspension point motion is *much* less than in pitch. The OSEM's don't see anything at all.
     (ii) Above 0.5 Hz, you see off-resonance improvement in the super-sensor estimation of M1 motion by the factors of 4x-5x improvement you would expect from dropping from -0.5 gain (total) usage of the OSEMs to -0.1.
     (iii) This actually advocates for making the blend filter notches in yaw *even skinnier* than the improvement discussed in LHO:86265.
     (iv) I'm not sure this would help, but seeing the estimated suspension point motion peak back above the control noise at 30-40 Hz says to me that (if we can) we should improve the ST0/HEPI feed-forward to ST1 motion for HAM5.  The hump is present even in the Estimator OFF drive trace, so it tells me that the physical motion of the M1 stage is smaller than M1 cage motion. So, we also should consider -- if we can't improve the 30-40 Hz ISI motion (likely), then we roll-off the yaw damping loop controller (definitely easier, we should have plenty of phase margin).

Fifth Point: Yaw Drive
Finally -- the yaw drive. I'm not sure there's too much to discuss here, since the story is more simple and the same as what's seen in the sensors. With the estimator ON, you get the 4x-5x reduction in drive when you're not using the OSEM portion of the estimator.

Summary Plot
Once you're done thinking through it all, it's good to zoom back out and stare so I provide all the plots together -- see 2025-08-25_H1SUSSR3_M1_GS13FFEstimator_LocalPerformance_Summary_QuadPlot.png.
Images attached to this report