Back on July 28th, we doubled the bias on ETMX in an effort to try and survive more DARM Glitch locklosses (previously referred to as ETMX Glitch locklosses) (86027). Now that we've been at this new bias for a month, I have made some visuals to compare the number of locklosses from low noise before and after the change. We wanted to stay at this bias for at least a few weeks because sometimes throughout O4, we've had periods of a couple weeks or so where we barely have any locklosses caused by DARM Glitch, and we wanted to make sure we weren't just entering one of those periods.
TLDR;
In August, we spent more time locked with longer locks and less locklosses. The difference between August and the other months of O4 has been very drastic, and the plots make it look like to me that this is due to the bias change in ETMX.
Not TLDR:
A birds-eye view:
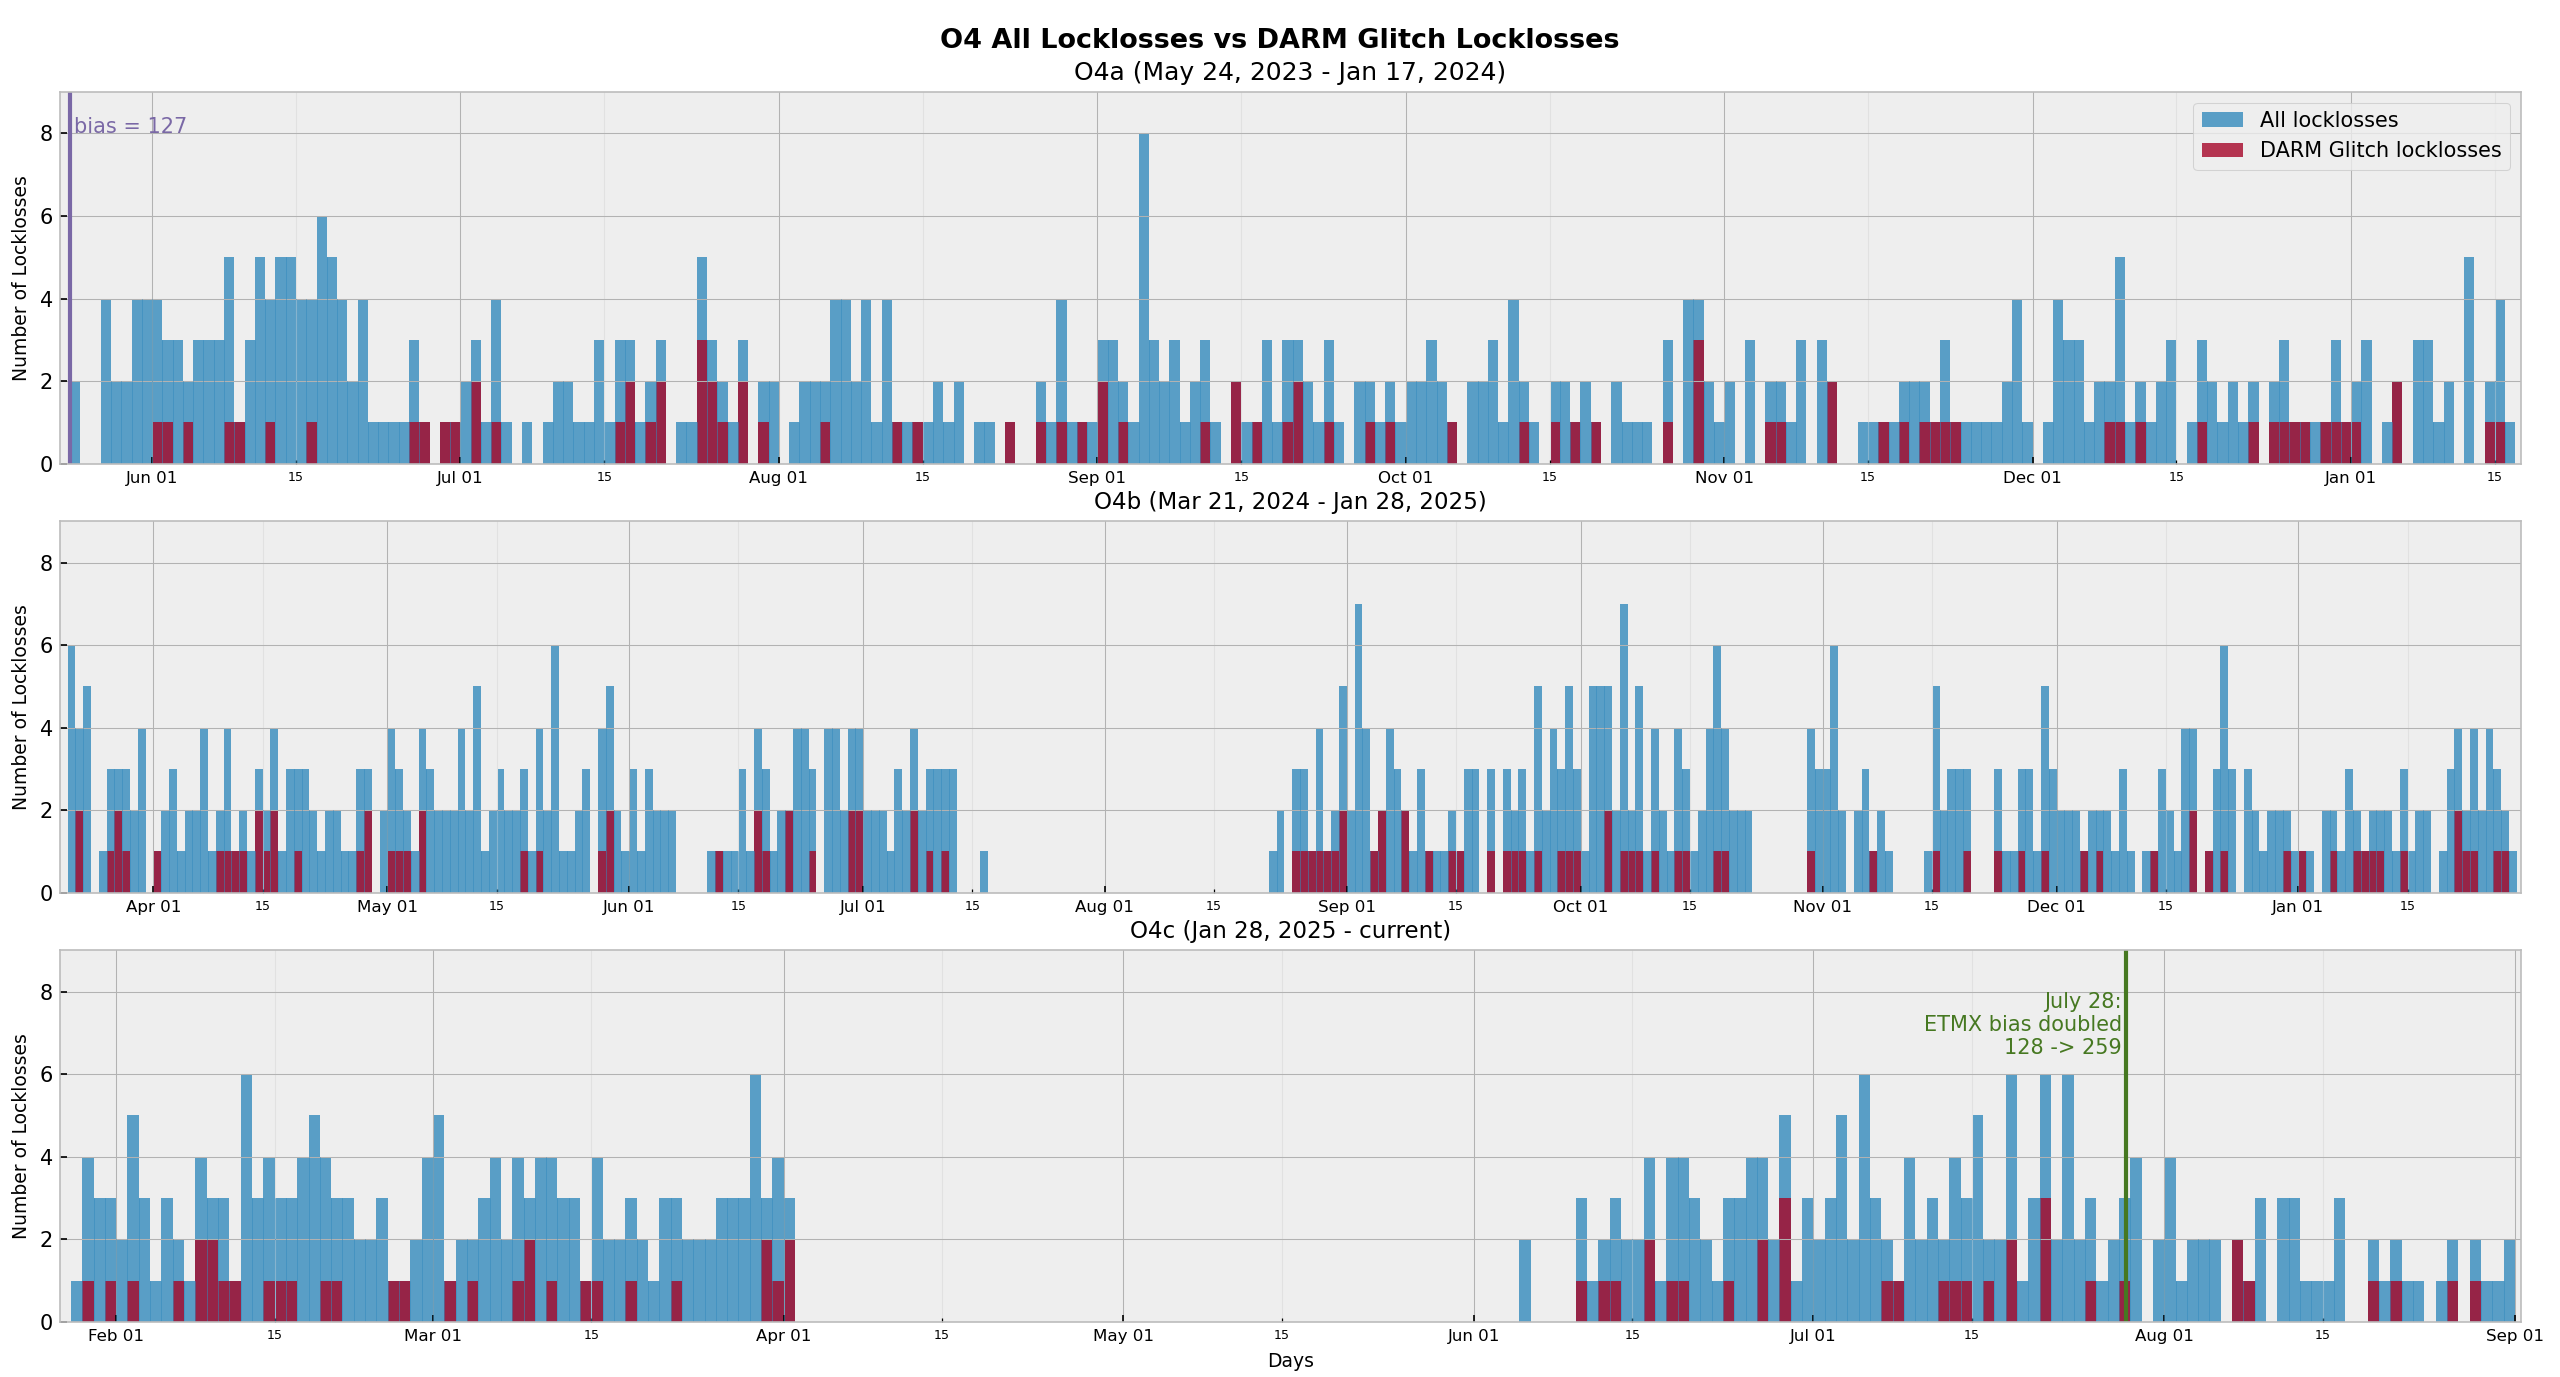
O4 All Locklosses vs DARM Glitch Locklosses
I've posted similar versions of this figure before, it just gives a visual representation of the amount of locklosses we've had during O4 that have been attributed to DARM Glitch versus every other lockloss. From this plot, you can see that since we doubled the ETMX bias, we have seen less ETMX glitch locklosses, and less locklosses in general!
A more in-depth examination:
I've decided to compare the month of August to the other full months of Observing we've had in O4c: February, March, June, and July. April was only a couple days of Observing, and May we were fully venting. The important thing to note here though is that for June, we started Observing 5 days into the month, and there was a lot of commissioning going on the rest of the month, so the June data points aren't the best comparison.
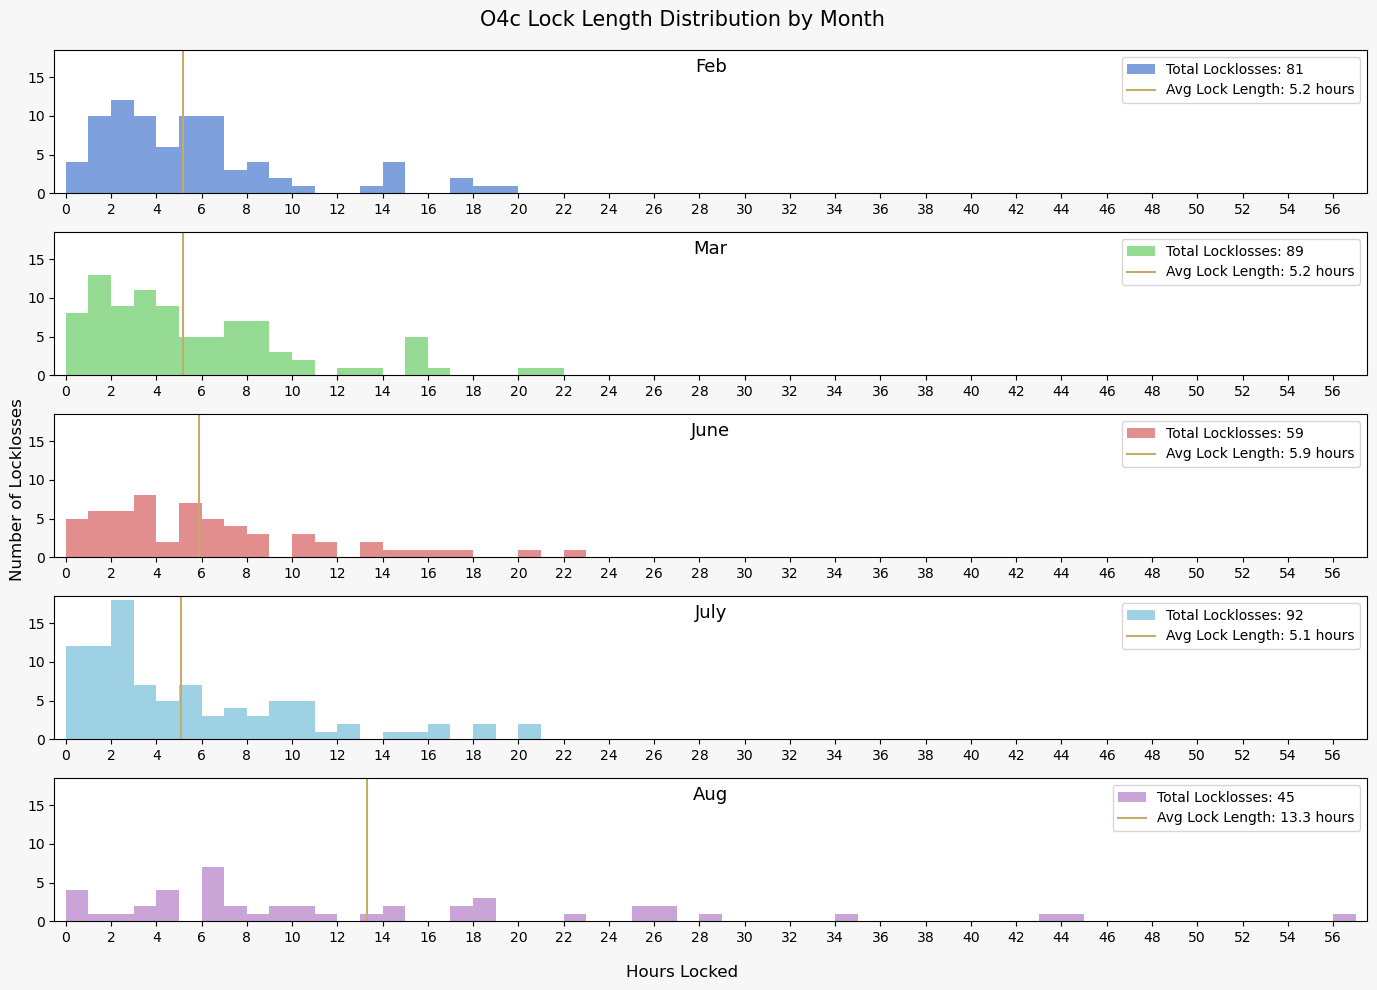
O4 Lock Length Distribution by Month
The xaxis shows the number of hours we had been locked for each NLN lockloss during the month, and the yaxis shows how many locklosses occurred after that lock lengh. Each months' plot has the same x and y axes limits, and on the right side of each plot is the total number of locklosses from low noise for the month as well as the average lock length.
You can see the distributions for February, March, June, and July all look pretty similar, with the majority of locklosses happening after 10 hours or less of being locked, and the average lock length for those four months is around 5.5 hours. February, March, and July also all have a similar number of locklosses, while June has a quarter less, partially due to commissioing at the beginning of the month and partially for unknown reasons.
August, however, is completely different. The distribution of lock lengths is a lot wider, and not just by one or two longer locks, in August there were 9 locks that were longer than during the other four months. There is also a lot flatter distribution for the shorter locks. This results in an average lock length of 13.3 hours, more than double the other months. There were also approximately half the number of locklosses during August, which is a very drastic drop. Even compared to June we had a lot less locklosses.
Lockloss Stats per Month for O4c
Here's a table I made with some more lock and lockloss stats. There's the number of days that that month consists of, the number of locklosses during that period of time, the number of locklosses attributed to DARM Glitches during that time, the average length of lock, and the total time spent locked during that period of time. The new info here is the total time locked - in August we spent about 25 days locked, which is 6 days more than the next highest month, July, and is a big jump up compared to the total locked time between February, March, and July.