This is an alog I started before the power outage, because we were worried that the filter cavity backscatter was the reason for our intermittent squeezer noise. (We now realize that the noise we are looking for is not from the filter cavity 87071.)
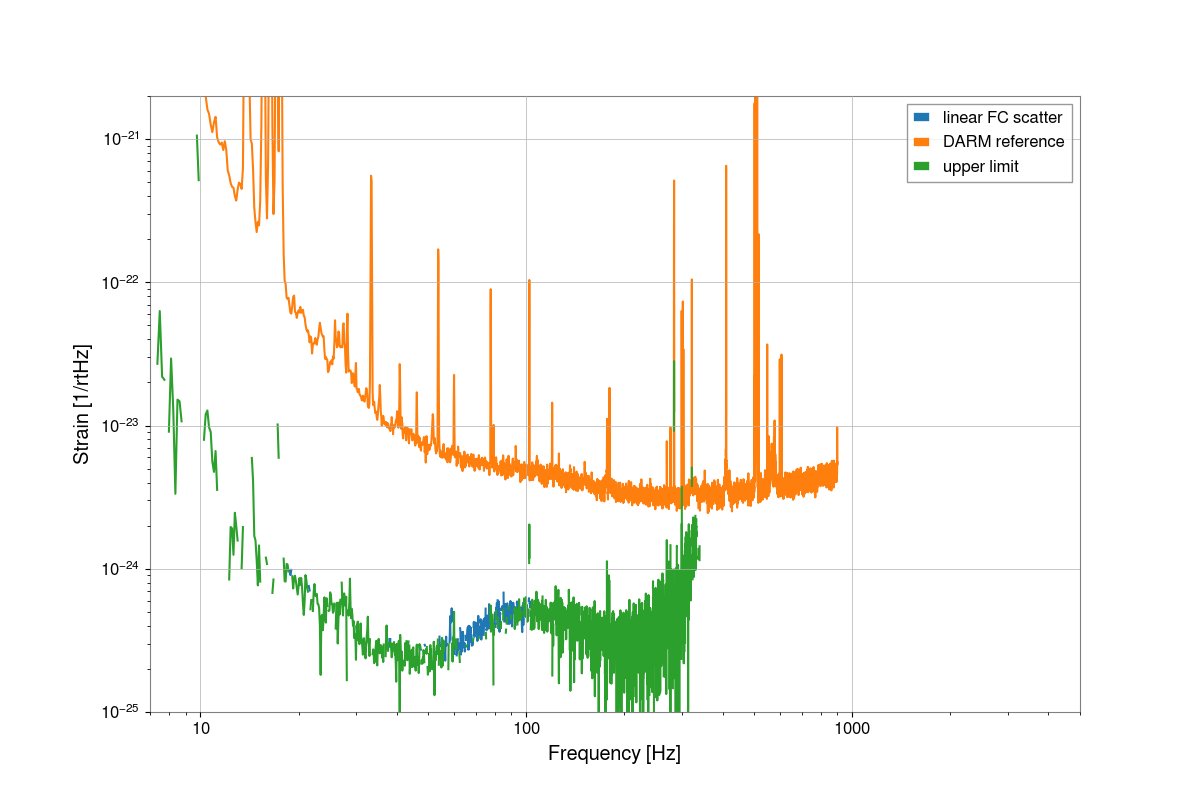
The overall message is that the filter cavity backscatter seems low compared to DARM, but there is a source of scattered light upstream of SFI2.
Filter cavity length
I've constructed a model of the filter cavity length loop using the foton filters for PRM in the CAL-CS model. As noted in 78728 we need to modify the analog gains for M3 for FC2. I've used a filter cavity pole of 34 Hz, and adjusted the sensor gain to get the model to match the measured open loop gain (plot). The measurement used in that plot has poor coherence below 5 Hz, which explains why the model doesn't seem to fit there. This model also matches the cross over measured by injected at M1 LOCK L well (plot).
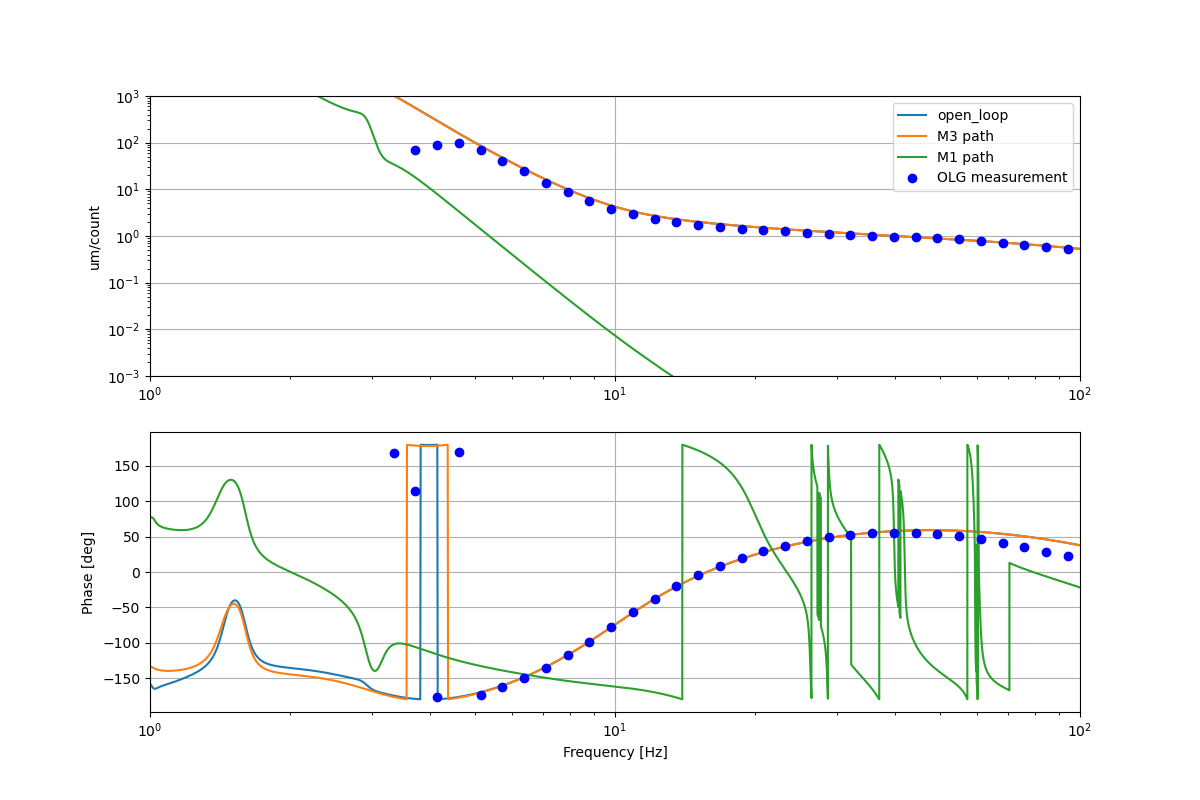
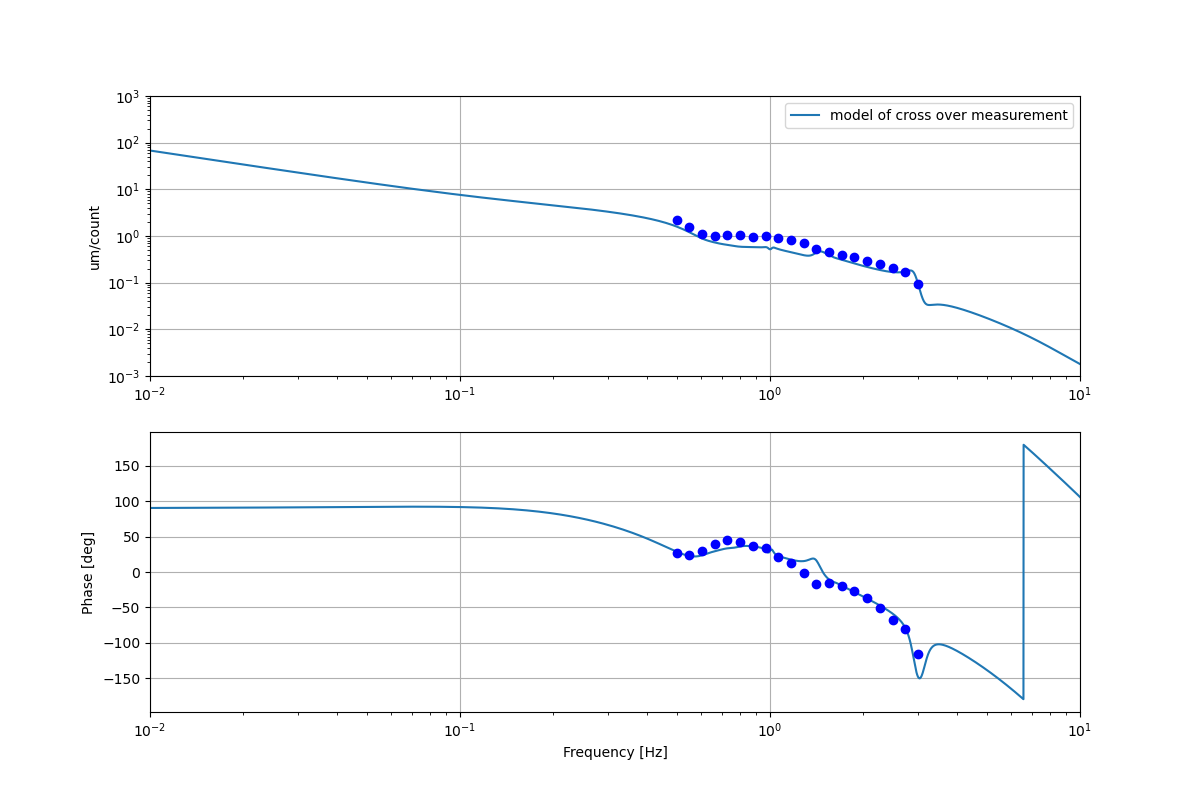
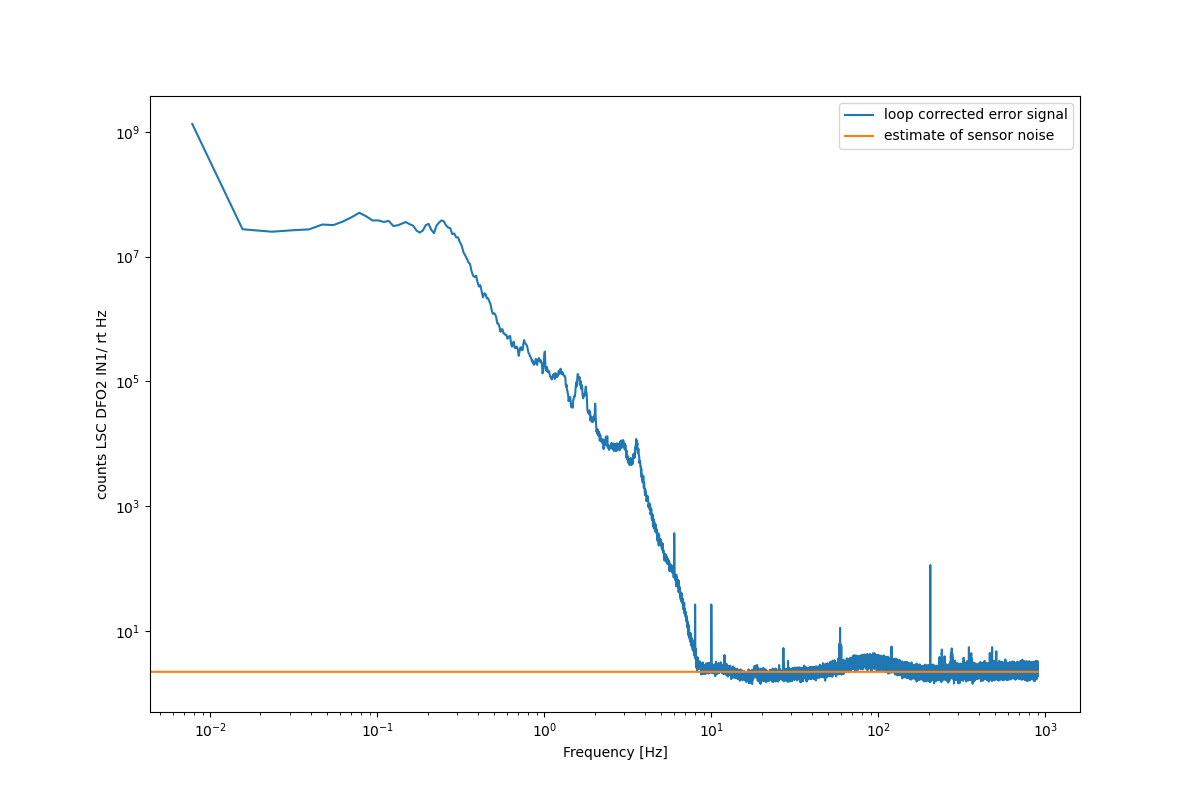
The next plot shows the uncalibrated error signal (measured at LSC DOF2 IN1), with the loop correction applied (error_spectrum * (1-G)), and a line which I've added as a crude estimate of sensor noise. You can see that there seems to be a bump in sensor noise around 100 Hz that isn't included in my rough estimate, I am not sure what that is.
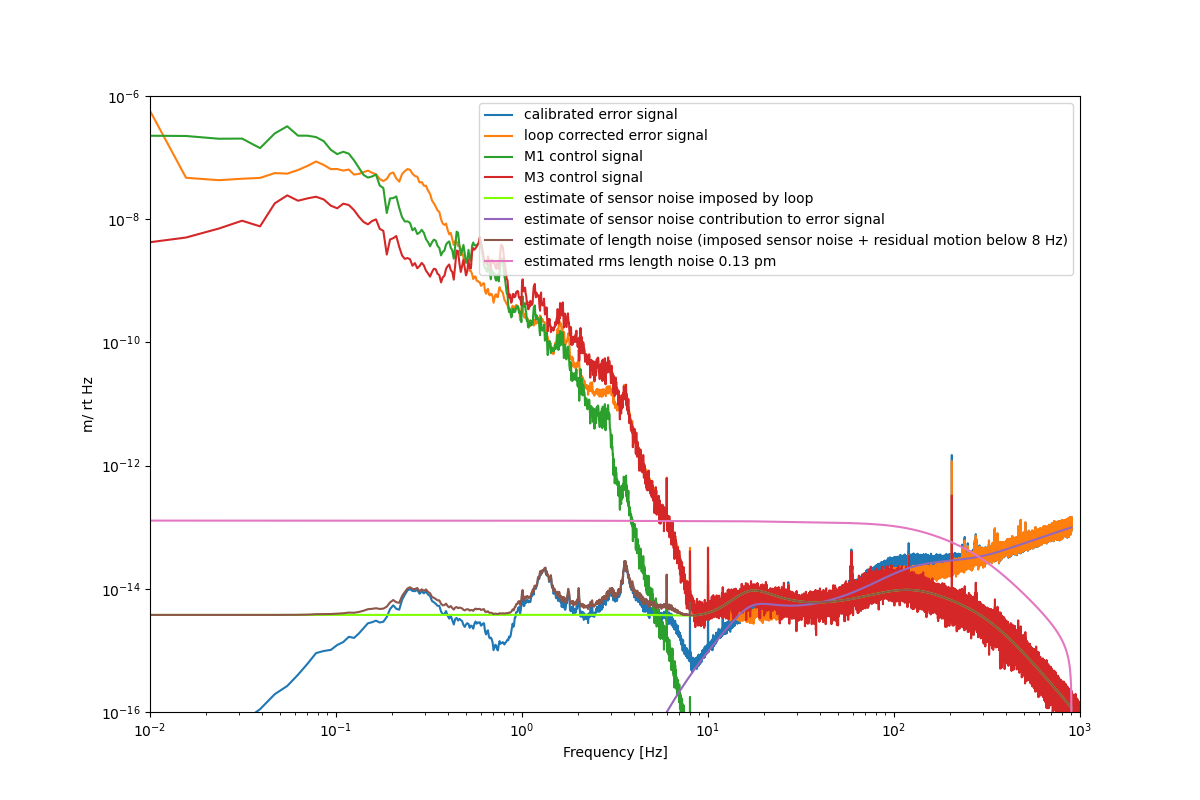
The next plot shows calibrated length noise.
- The blue trace is the measured error signal calibrated using the sensing function found by fitting the open loop gain error_spectrum/sensing function
- The purple trace shows how the estimated sensor noise would be expected to contribute to that: sensor_noise_estimate * 1/(sensing function *(1-G)). This is fairly close to the error signal above 8 Hz, so I've made an assumption that above 8 Hz the error spectrum is dominated by sensor noise, and that below 8 Hz the error spectum reflects the suppressed length noise that is not from this control loop (ie, ground motion, osems). We could check the osem noise by doing injections.
- The orange trace shows the loop corrected error signal, an estimate of what the noise would be if there were no loop: error_spectrum * (1-G)/ sensing function
- The green and red traces are the control signals for M1 and M3, calibrated by the plant models used in modeling the open loop gain and cross over measurements. Plotting these was usefull for debugging the loop model and gaining confidence in the modeled sensing function, because they now roughly agree with the loop corrected error signal. (but they won't be used again here).
- The chartruse trace is an estimate of the sensor noise imposed on the filter cavity by the control loop, sensor noise * G/(sensing function *(1-G)). This is roughly along the
- The brown trace is the awnser, an estimate of the filter cavity length noise with this loop running. This is the quadrature sum of the blue calibrated error signal below 8 Hz (asumming that is residual length noise where the loop is gain limited), and the chartruse estimated sensor noise imposed.
- The pink shows the estimated RMS length noise of the filter cavity, 0.13 pm, dominated by the imposed sensor noise. Page 21 of T1800447 states that 2.5 pm of RMS length noise would limit the squeezing at 50 Hz to 3dB, if we had 6 dB of squeezing and 12 dB of anti squeezing. This level of rms length noise is probably OK.
- section 8.2 of T1800447 estimates that the VCO noise is 1e-16 m/ rt Hz, small enough that we don't need to include it in this estimate. The sensing noise that I am estimating from looking at the error signal is nearly two orders of magnitude higher than the VCO noise which was used as the sensing noise in the loop modeling done in the design document.
Backscattered power
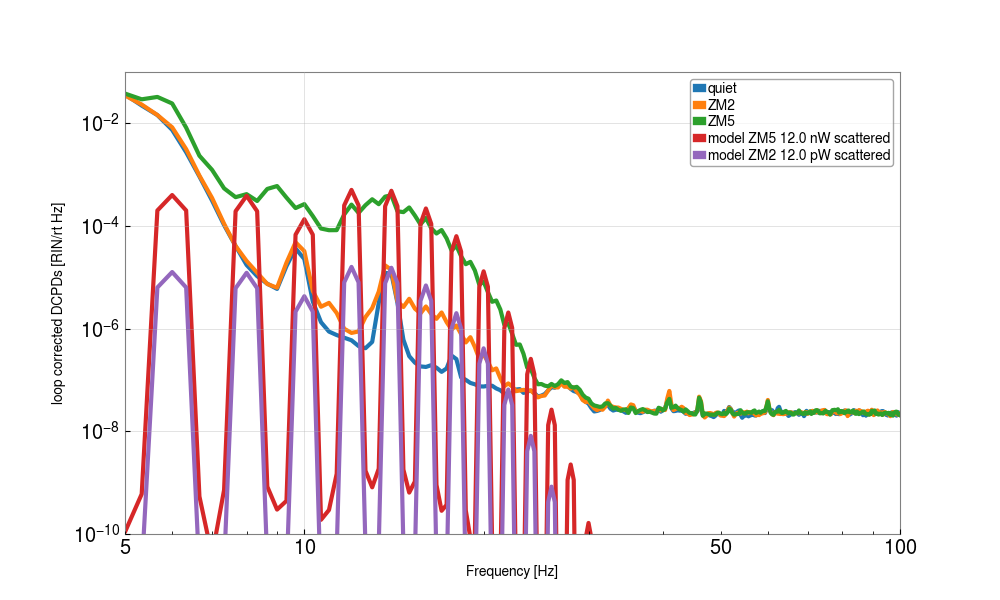
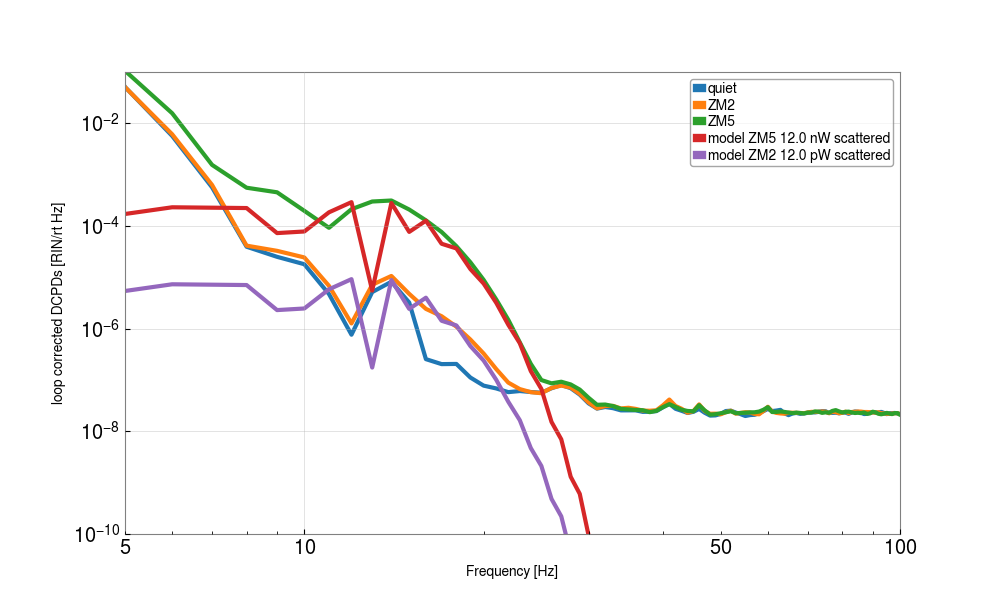
Using the measurement of excitations on ZM2 in 86778,we can estimate the amount of backscattered light that is reaching the filter cavity. The DCPD spectra, calibrated into RIN and with the DARM loop removed are plotted here and here with different FFT lengths. Next time if we do this measurement with a lower frequency and higher amplitude excitation we will be able to use a longer FFT length for the plot and still se
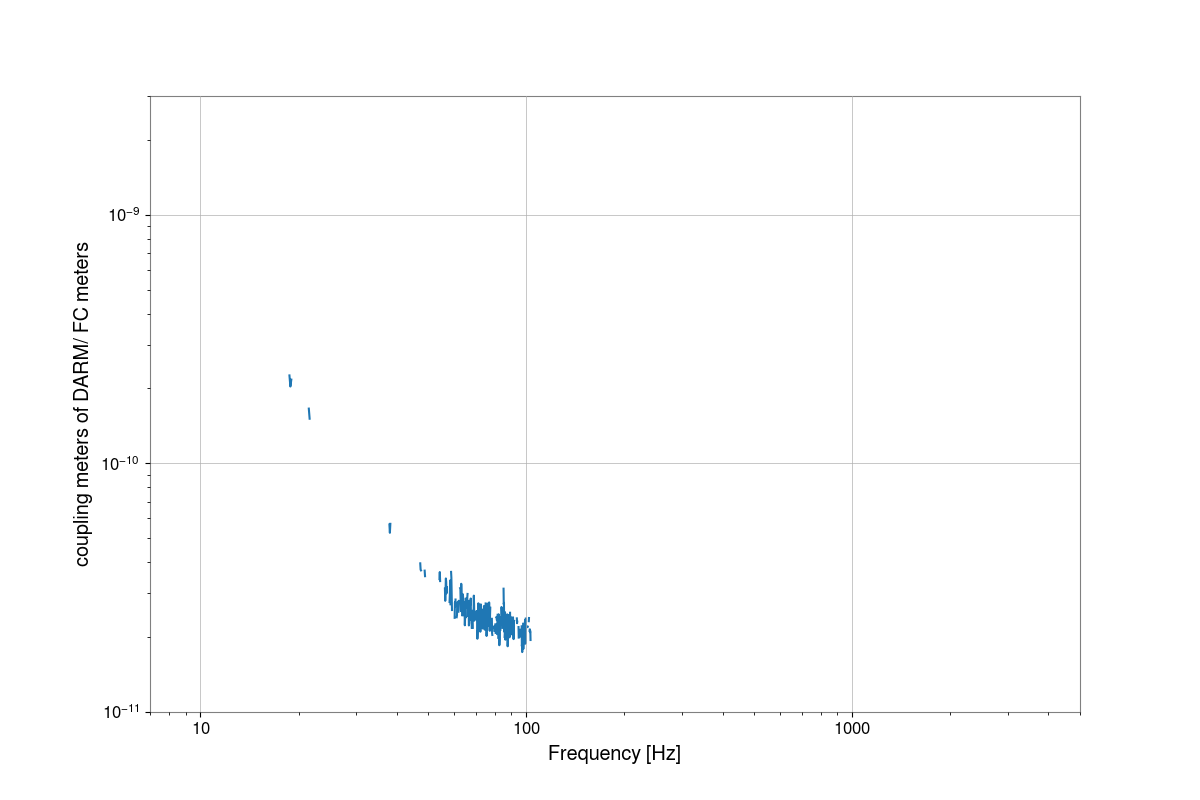
I've made a model of the noise caused by backscattered light using equation 4 (and 5) from P1200155. The excitation was a 1Hz 100 count excitation into test L, in the osems this showed a peak to peak amplitude of 0.37 um, and to go from optic motion to path length change we need roughly a factor of 4 since ZM2 is at a low angle of incidence and it is double passed. To match the shelf frequency in the measurement I had to increase the amplitude used in the model by a factor of 3.4. Using a QE of 100% gives a PD responsivity of 0.858 A/W, and 46.6mW of power on the OMC PDs. This model doesn't include any phase modulation from any other elements in the optical path, but the real measurement does, which is why the measurements shows a nice shelf but the model shows a series of peaks when I use a longer FFT. I think would be less apparent if we make the measurement with a lower frequency higher amplitude excitation next time.
The result of this shows that we have 12 pW of scattered light passing ZM2, since backscatter that reaches the filter cavity should all be reflected back towards the IFO along with the squeezing this means that we have 12 pW of scattered carrier from the OFI reaching the filter cavity. Comparing this to table 1 of T1800447 this is a lower scattered light power reaching the diodes than expected, for a similar level of carrier light reaching the DC PDs, which suggests that all three Faradays are providing the isolation level expected or slightly better. When driving ZM5, we get 12 nW of power scattered back to the interfometer, suggesting that there is a scattering source where we would not expect one to be. This seems most likely to be upstream of SFI2, since we only expect nW of total scattered light downstream of SFI2. If you are interested in looking at a diagram of possible scatters there is a VIP layout here, the beam which leaves B:M5 goes to a PD mounted on the ISI which is called B:PD1 and is intended to monitor light scattered from the OFI towards the squeezer.
Coupling and noise projection
The last two plots here show the results of a filter cavity noise injection, similar to what Naoki did in 78579. This suggests that this noise is large enough to include in our noise budget, but not nearly large enough to explain the excess noise we see in DARM when the filter cavity error signal is seeing extra noise.
The code and data to produce this are in sheila.dwyer/SQZ/FilterCavity/fc_lsc_model.py


I posted this as a comment on the wrong alog on Friday, adding it here now. Also see follow up measurements with changes to SFI2 temperature, and the comparison measurement from LLO 87309
Power level heading towards HAM7 from OFI:
The power on the DCPDs is 47mW, and there is 12pW retro-reflected off the filter cavity, so the total isolation provided by OFI + SFI2 + SFI1 is 2.5e-10 in power ratio, or 96dB. The OFI isolation ratio was measured to be 43dB in 79379. If this is true it would imply that one of the SFIs is providing less than the 30dB isolation assumed in T1800447, and we should have 2uW of carrier light headed towards SFI2.
Our readback of the 1% pick off of light from the interferometer heading towards SFI2, B:PD1 (OFI PD A) says that we have 0.03mW on it, meaning 3mW from the IFO going towards SFI2, about 1mW of this would be carrier based on (87114),which seems too high.
The responsivity of this PD was checked in 60284, and later double checked because it seemed low (the settings are still the same). The similar PD OFI PDB has a measured responsivity of 0.25A/W and the excelitas website lists a peak responsivity of 0.6A/W at 850nm for these PDs. (ffd-200h-si-pin) If we think that this calibration was mistaken and the real responsivity is more like OFI PD B, 0.25A/W, there is 0.72 mW of light from the OFI heading towards SFI2, ~240 uW of carrier, the OFI isolation would only be 23dB, and the SFIs must be providing something like 36 dB each.
Reflectivity:
If my interpretation of the fringe wrapping measurements into power are correct (12 nW of power is retroreflected from the path that includes ZM5), we are reflecting 50ppm of the carrier scattered toward HAM7 using the (recalibrated) 240uW value from OFI PDB, or 0.6% if we believe the isolation ratio measurement for the OFI and use the 2uW value. B:BS1 is a 1%, so the maximum reflectivitiy we could get from scatter in the B:PD1 path would be 0.01%. This means that the B:PD1 path can't explain the reflectivity needed if there is 2uW headed towards HAM7, and even if there is 240uW heading towards HAM7 this PD seems unlikely to explain the scatter, since it would need to reflect half the light that's incident on the PD. Camilla did alog the check of the alignment (and the beam dump catching the retro-reflection off this diode: 65006)
Daniel looked at some of the excelitas website catalog and he thinks that our measurement of 0.06A/W could be a reasonable responsivity for the OFI PD A. LLO's responsivity for this PD is set to 0.065A/W.
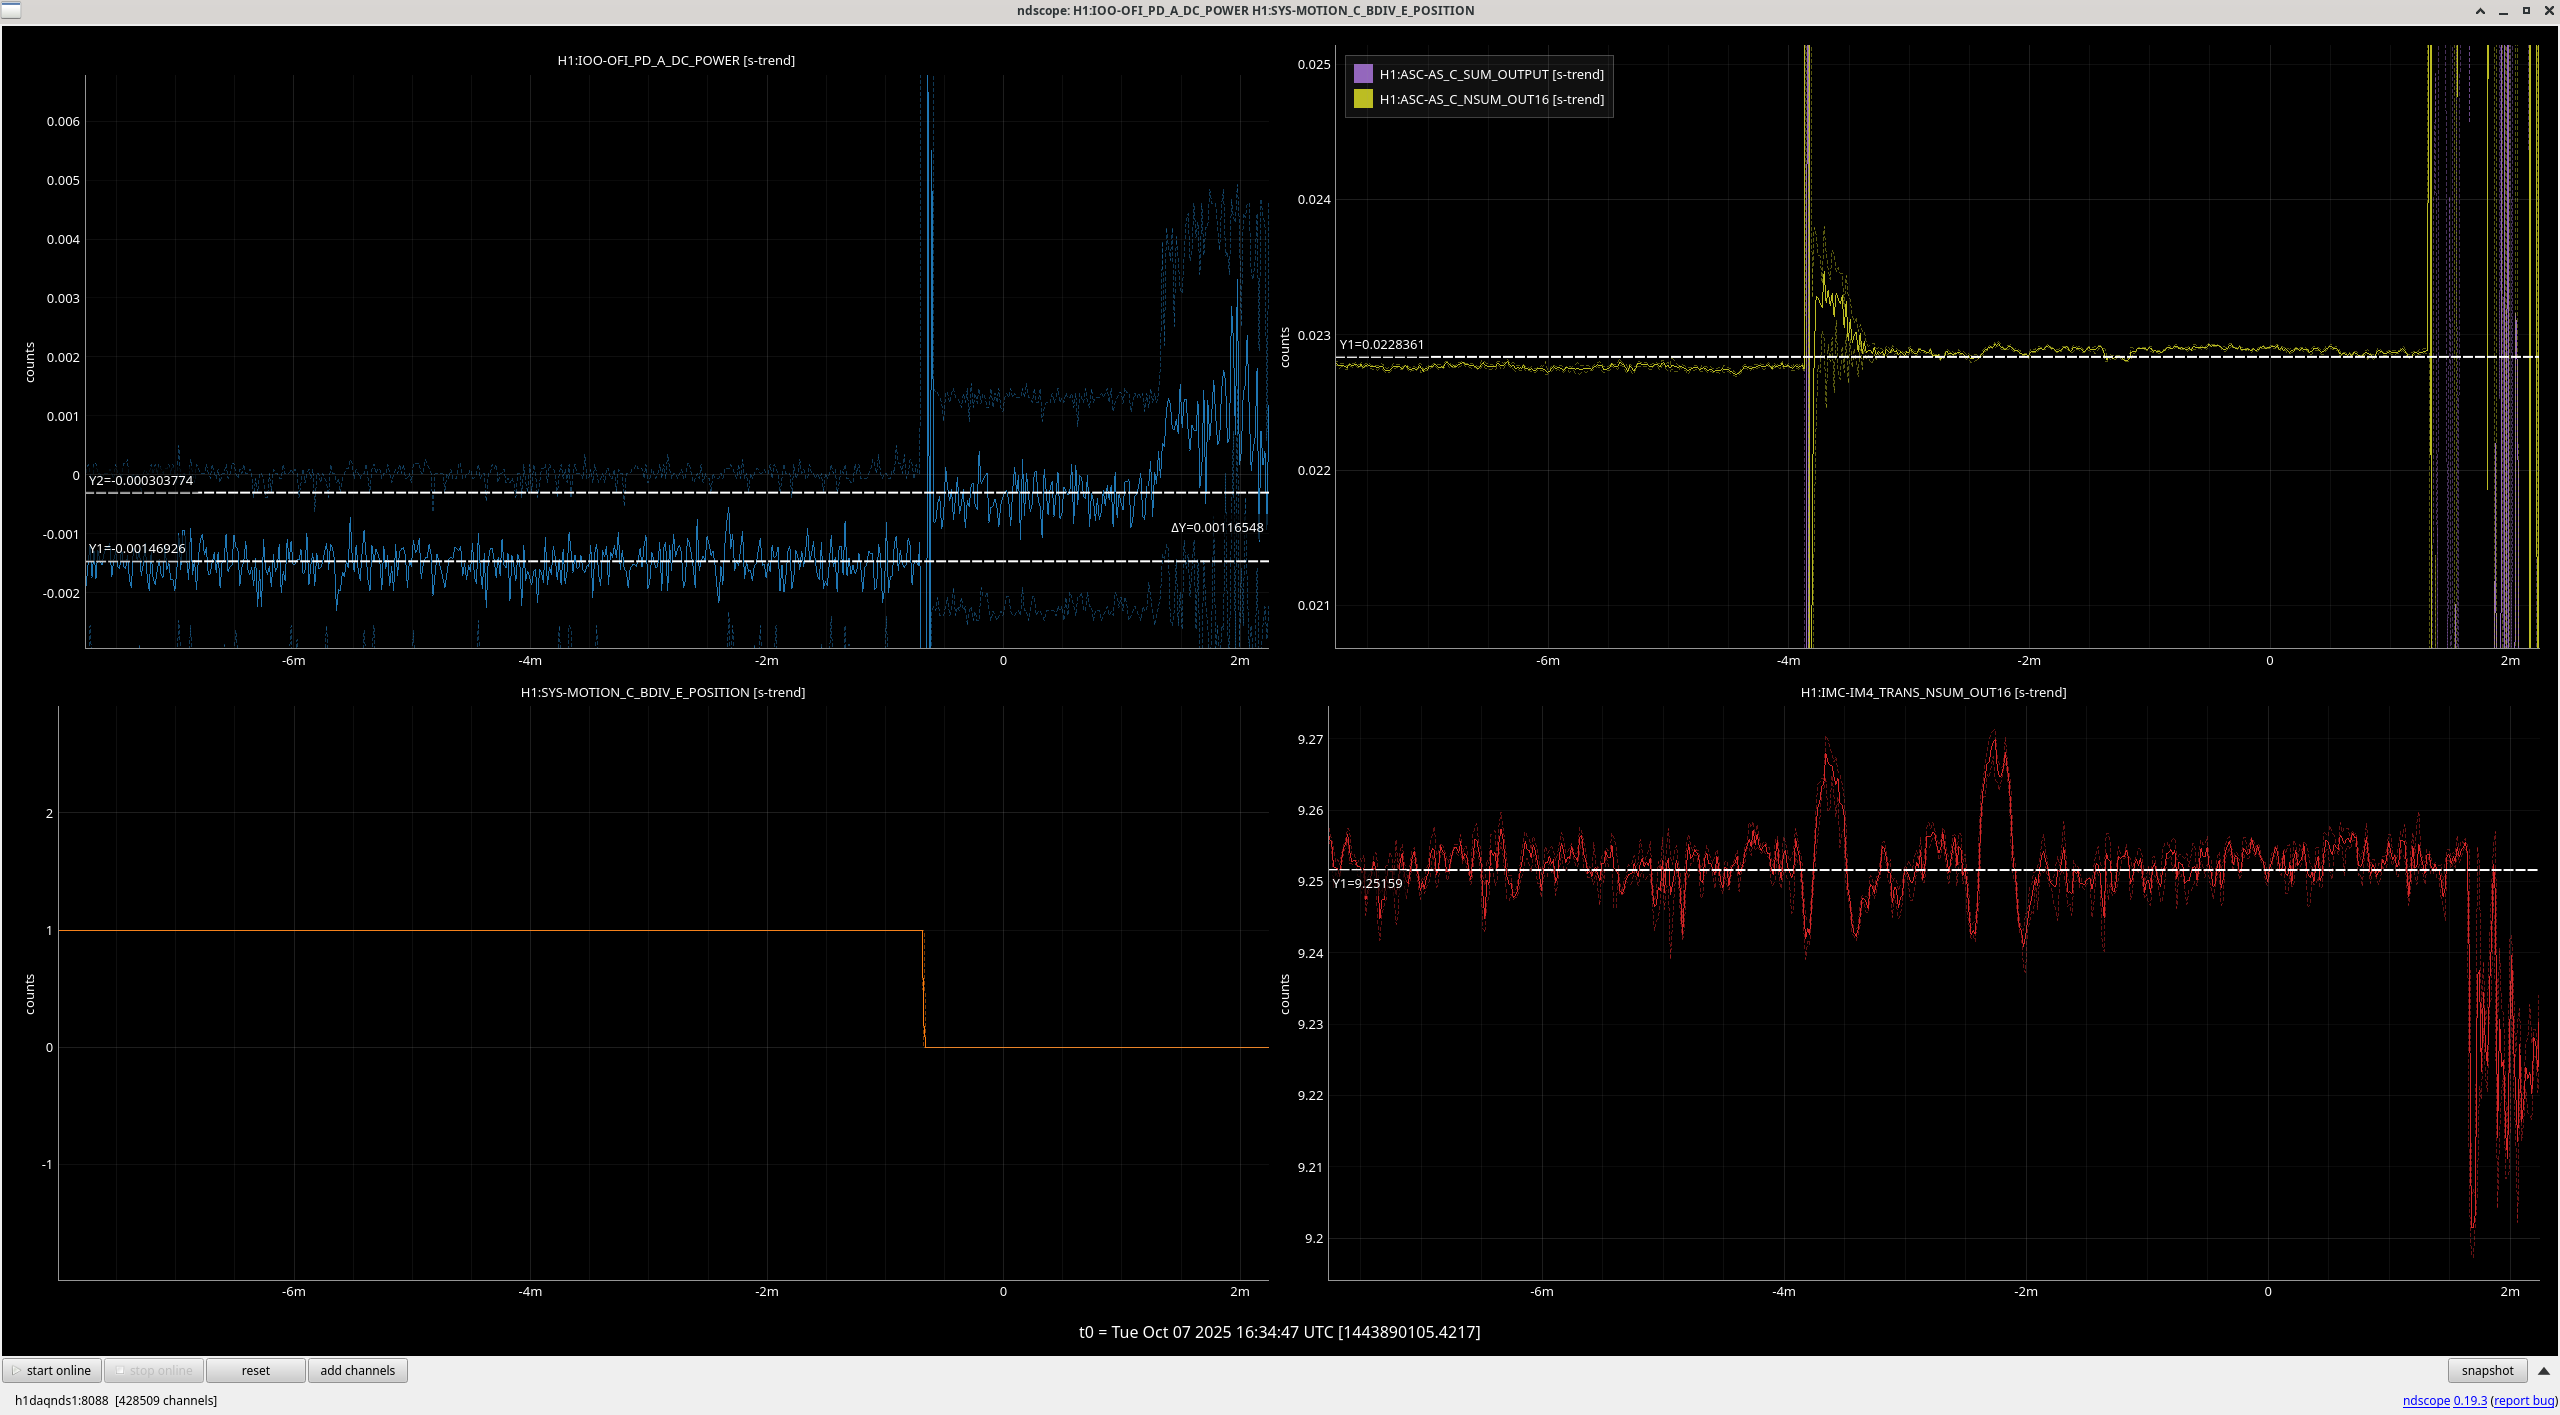
This morning we opened the squeezer beam divererter while Matt was doing single bounce OMC scans, (87342) when there was 9.25W incident on PRM.
9.25W on PRM * 0.0299 PRM transmission * 0.25 (2 BS passes) * 0.03234 = 22.4mW expected arriving at OFI. AS_C_NSUM is calibrated into Watts arriving at HAM6, which says 22.9mW for this time.
OFI PD A reports a 1.1uW increase in measured power when the beam diverter opens (first attachment), meaning that there is about 100uW from the OFI sent to HAM7 in single bounce, or 0.4% of the light arriving at the OFI is sent to HAM7 according to this PD, or 23dB of isolation for this port. The 43dB measurement I referenced above is isolation for HAM6 scatter, and it doesn't apply to the light sent to HAM7.
So, this suggests that perhaps we can trust this OFI PD readback, and perhaps there is about 1mW of carrier sent to HAM7 when we are in full lock. This means that we need a reflectivity of 10ppm to explain our fringe wrapping measurement; if the scattering happens behind the 1% beam splitter it should have a reflectivity of 10% to explain what we see.
LLO has 50mA on the OMC PDs, compared to 40mA here, their OFI PD A reports 0.01mW power in full lock, 3 times less than what we see here.