Jennie W, Keita, Rahul
On Friday, Keita and Rahul and I tried moving PDs 2 and 6 to align them better with the others. As can be seen from the scans we did of the DC voltage of the diodes as we moved the input alignemnt in horizontal translation and yaw from alog #87290, 2 and 6 have a range of alignment that is shifted relative to the other 6.
We also checked this with a IR sensitive camera with a zoom lens.
One person used the camera with a zoom lens to check the spot on the PDs as another person loosened the screws from behind the array and the third person held the barrel of the PD assembly to stop it moving or rotating in an undesired direction.
There is not a lot of space as 2 and 6 are in a column and are very close to diodes 1 and 5 on the right.
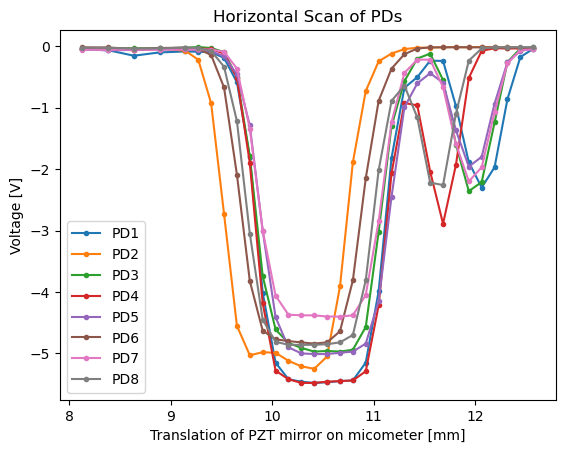
The horizontal scan we took after these moves showed we had made things worse, see this image.
Later that afternoon, Keita moved the PD 2 back and checked the alignment and it looks better.
The alignment as of yesterday (Monday) was 143mm in pitch (as read out by the allen key in the PZT mirror pitch actuator wheel) and 0.4145 inches in horizontal translation as read out by the translation stage the PZT mirror sits on.
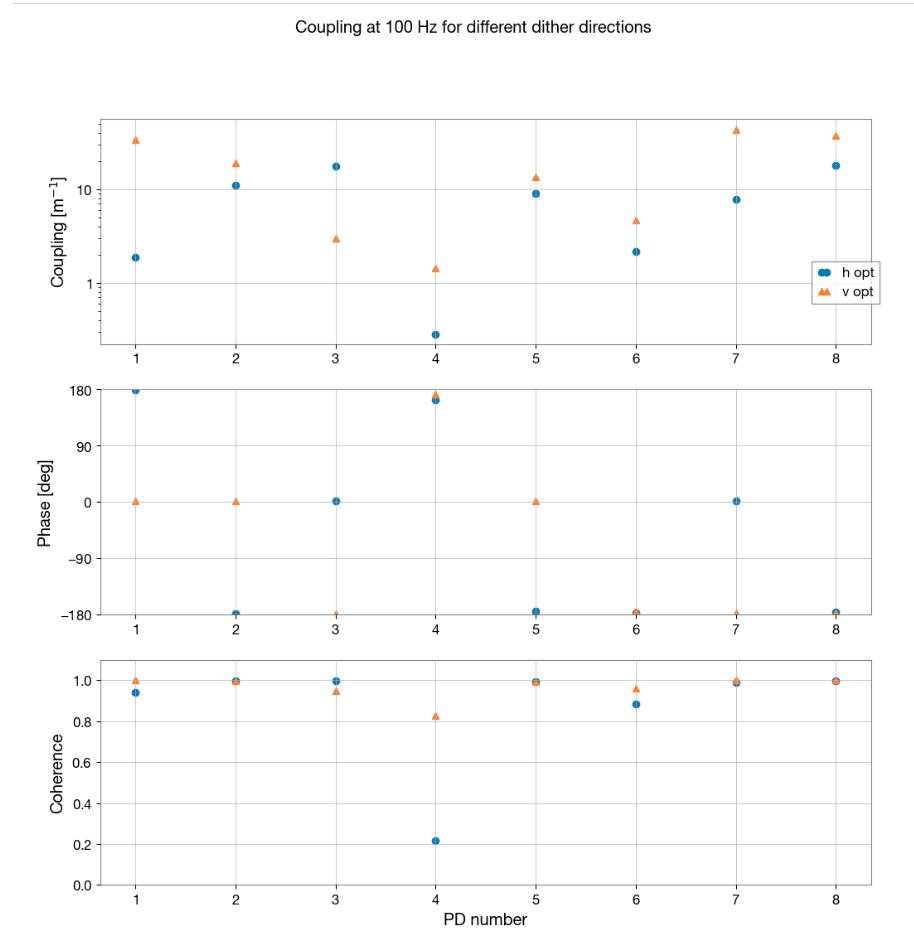
Keita measured the coupling (after finding an error in my code from the previous coupling measurement I plotted last Thursday (alog #87400)).
The coupling in both vertical and horizontal is below 10, so this should be good enough for install if all else checks out.
Yesterday afternoon, Rahul and I did the vertical scan (slightly off from the horizontal reference position of 0.4145 inches that Keita had aligned to). The data in this graph was collected at a horizontal translation stage reading of 0.4162 inches.
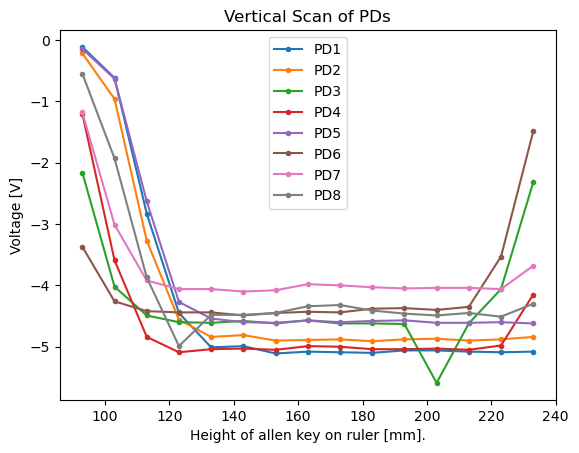
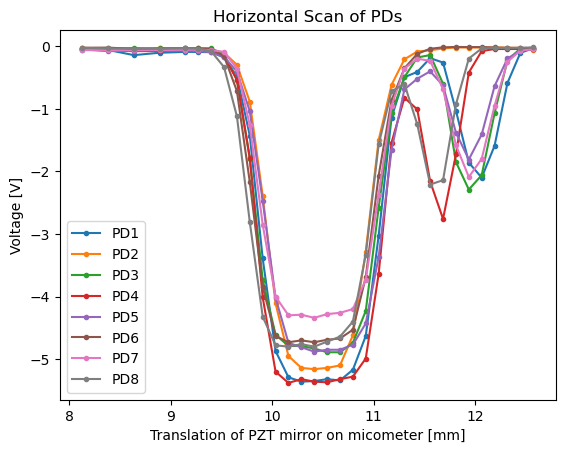
We had to redo the horizontal scan today as I missed out some scan values yesterday. The data was collected with the pitch indicator at 143mm (the allen key on the pitch wheel actuator).

This morning Rahul recentred the QPD on the input beam (translation stage = 0.4145 inches, allen key - 143mm) and we scanned the translation stage horizontally to measure the calibration of the QPD.
This first scan had too large steps to give a good estimate of the slope for the X coordinate on the QPD near the centre, so I repeated the measurement with smaller steps. Although I thought I set the laser to ~120 mA for both measurements the power on the QPD sum was slightly different between the two, see this plot where the original measurement set is in orange and the second set in blue.
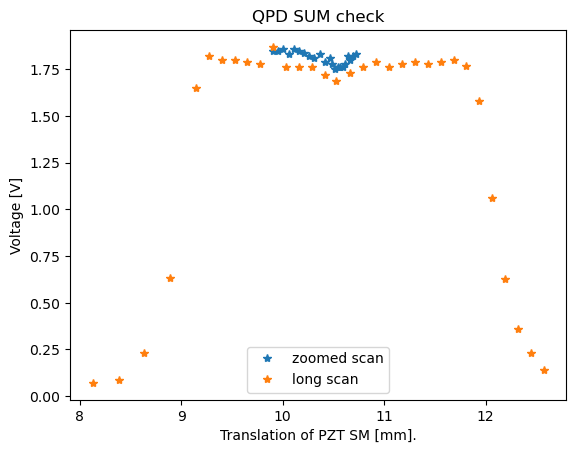
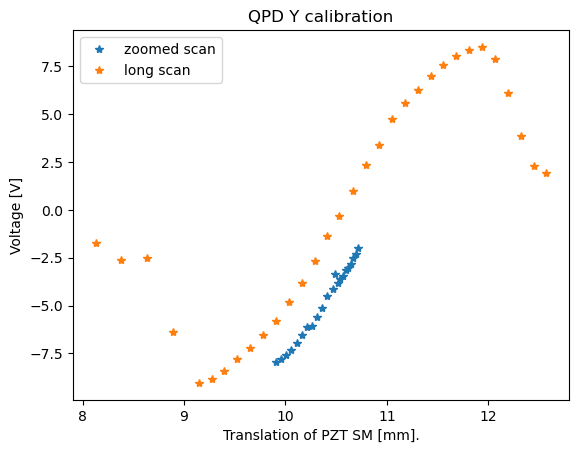
Looking at the plot the QPD has the same slope in Y for both measurements but the second set of Y measurements has lower voltages.
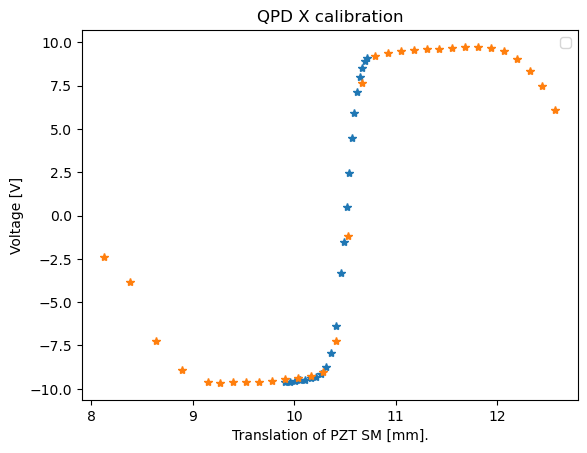
The X data overlaps between the two measurements which makes more sense to me, as we assume the QPD electronics normalise the readout of X and Y by the sum channel to account for power fluctuations.
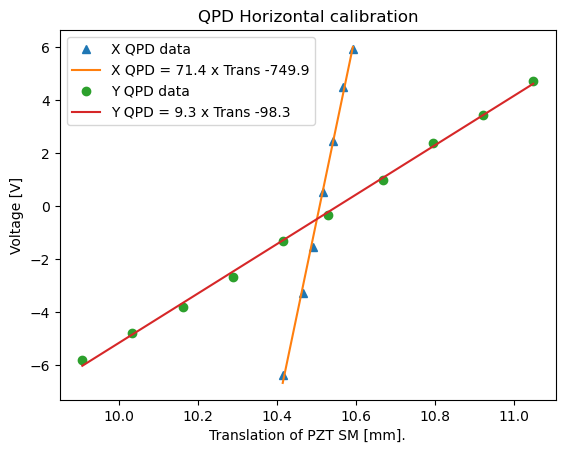
I used the newer measurement to estimate the calibration in the x direction, and the older measurement to estimate the slope in the y-direction, I tried to only use the linear part of the data in my fit and also not use any points with a voltage abive 6 Volts as this is when we expect the QPD to not be linear.
The calibration plot is here with the X calibration line in orange and the Y calibration line in red.
The resultant calibration is 72.0 V/mm in the horizontal direction, at an angle of 7.4 deg with the QPD axis. This is similar to the last calibration we did before several moves of the QPD to recentre it, see alog #87375.
This is worked out by adding the two slopes in quadrature and using atan2(Y_calib/X_calib) to work out the angle of the QPD axis with the horizontal direction of the PZT mirror translation.

Attaching a picture of the recentered QPD on the input beam.
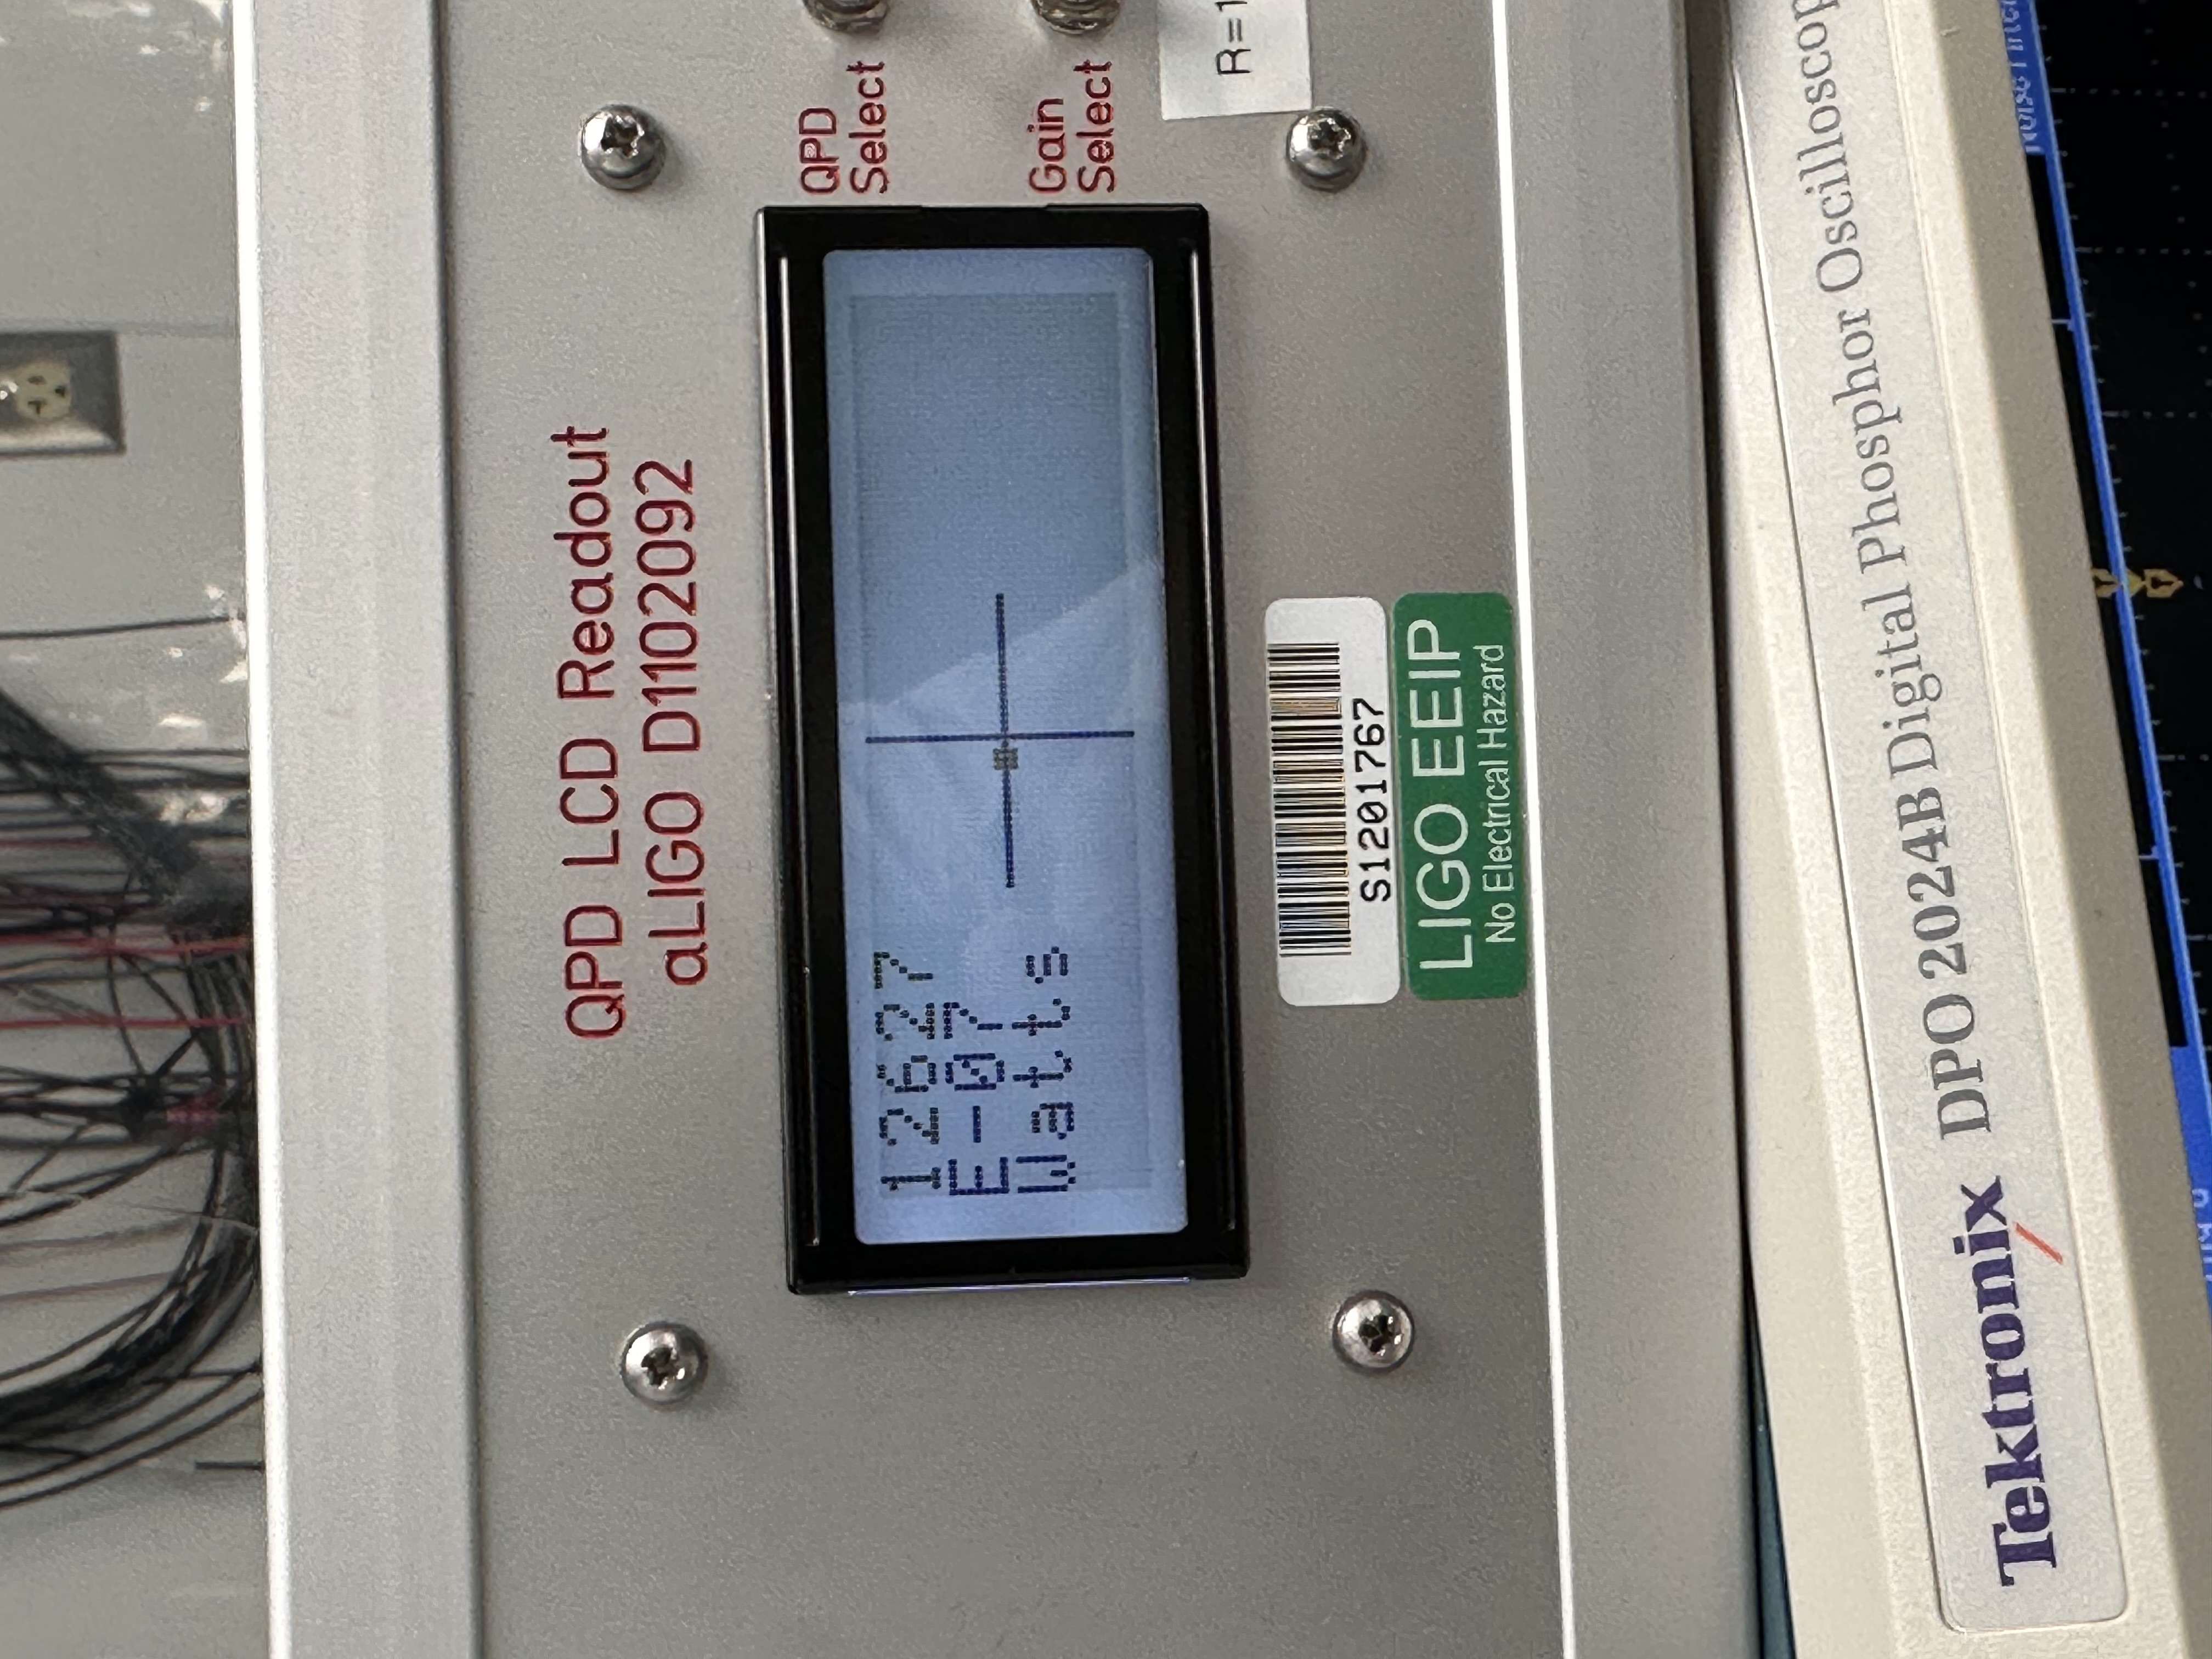
