joan-rene.merou@LIGO.ORG - posted 15:03, Friday 31 October 2025 (87889)
Correlation between ITMX and ITMY ESD bias settings and near-30 Hz near-100 Hz line amplitudes
[Joan-Rene Merou, Alicia Calafat, Sheila Dwyer, Robert Schofield]

We have analyzed the evolution of the near-30 Hz and near-100 Hz comb amplitudes, continuing with the work on aLOG 87414. In that alog was shown how there appeared to be a correlation between the ITMY ESD bias and the amplitude of the near-30 Hz and near-100 Hz combs.

In this study, we first listed all time intervals between ITMX and ITMY bias changes from the study Robert Schofield did and reported on aLOG 78925 and the associated entries. Robert changed the biases in a number of occasions "for determining the ITM biases that minimize coupling of electronics ground noise". We wanted to see if this was also true for minimizing the amplitude of lines in DARM.

The full list of constant-bias segments in-between changes is shown in the following table, which defines the start and end GPS times, along with the corresponding ITMX and ITMY bias values. We have added a few data points in between the ones shown in the related Robert aLOGs.
| const_start_gps | const_end_gps | ITMX_bias | ITMY_bias |
|---|---|---|---|
| 1403650000 | 1403651100 | 0 | 0 |
| 1403651220 | 1403653448 | 0 | -39 |
| 1403653569 | 1403655679 | 0 | 170 |
| 1403655799 | 1403657640 | 0 | -222 |
| 1403657760 | 1403804070 | 0 | 0 |
| 1403804192 | 1403804365 | 0 | 77 |
| 1403804489 | 1403807629 | 0 | -80 |
| 1403807751 | 1403809555 | 0 | -20 |
| 1403809816 | 1403812204 | -40 | -40 |
| 1403812324 | 1403816907 | 36 | -40 |
| 1403817127 | 1403820880 | 36 | 0 |
| 1403821000 | 1403912193 | 0 | 0 |
| 1403912517 | 1403914518 | 20 | -20 |
| 1403914684 | 1403917205 | -19 | 19 |
| 1403917405 | 1404317823 | 0 | 0 |
| 1404317979 | 1404319278 | -20 | -22 |
| 1404319453 | 1404320829 | 20 | -20 |
| 1404320940 | 1404341414 | 0 | 0 |
| 1404341526 | 1404342991 | 0 | -20 |
| 1404343117 | 1404344533 | 0 | -40 |
| 1404344655 | 1404346187 | 40 | -40 |
| 1404346300 | 1404413221 | 0 | 0 |
| 1404413147 | 1404416077 | 0 | -40 |
| 1404416200 | 1404417200 | 0 | 0 |
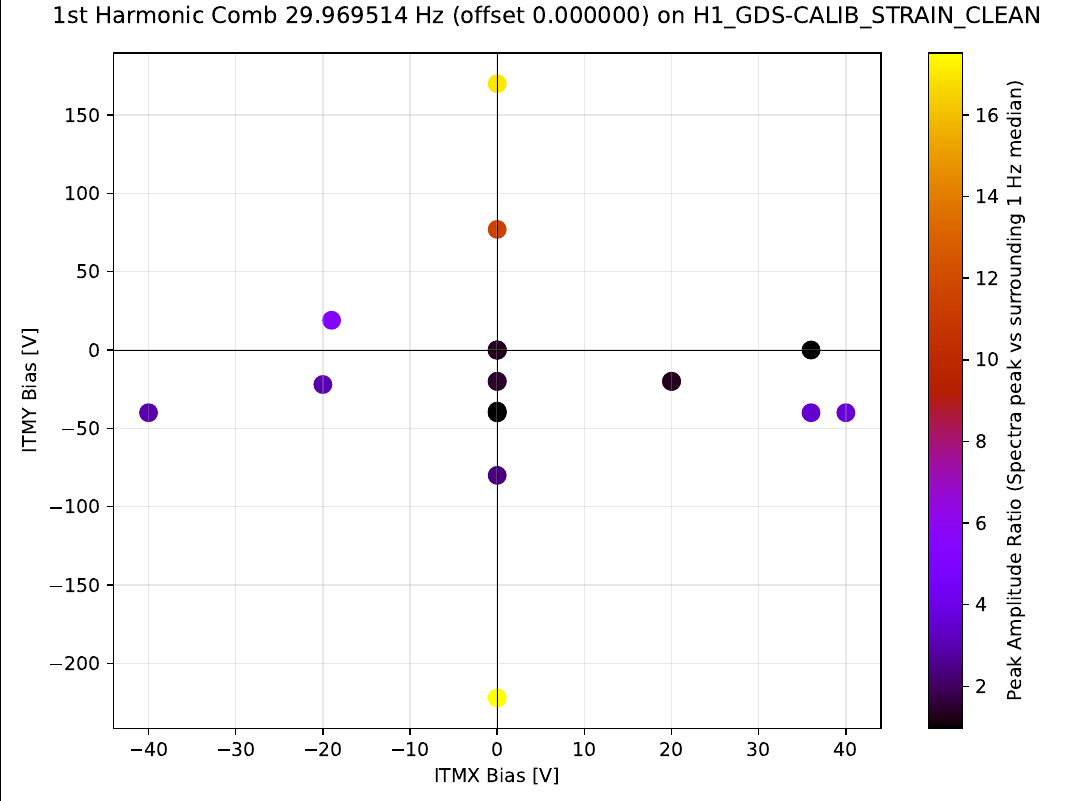 Although these results currently refer only to the first harmonic of each comb, this correlation already suggests a relationship between ITMY bias magnitude and the peak amplitude.
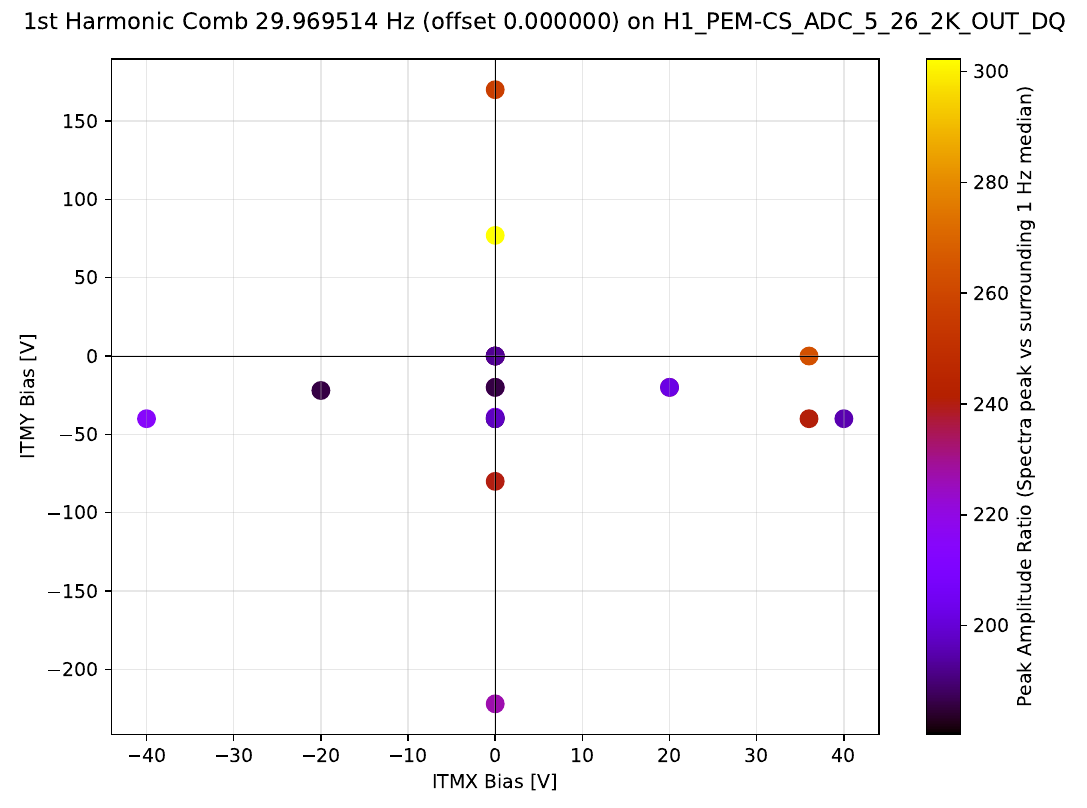
We also generated the same set of plots for the H1:PEM-CS_ADC_5_26_2K_OUT_DQ ADC channel, to test whether the observed trend in DARM is also visible in the ground current monitor. From these additional plots, the correlation appears less clear. For the near-30 Hz comb. It appears that changing ITM bias values does not change the comb amplitude in the ground monitor. Showing an example for the same comb as before:
Although these results currently refer only to the first harmonic of each comb, this correlation already suggests a relationship between ITMY bias magnitude and the peak amplitude.
We also generated the same set of plots for the H1:PEM-CS_ADC_5_26_2K_OUT_DQ ADC channel, to test whether the observed trend in DARM is also visible in the ground current monitor. From these additional plots, the correlation appears less clear. For the near-30 Hz comb. It appears that changing ITM bias values does not change the comb amplitude in the ground monitor. Showing an example for the same comb as before:
 The current analysis only considers a single harmonic per comb. The next steps are to extend the study to higher harmonics of these combs and check whether the same behavior is observed in other comb families beyond the 30 Hz and 100 Hz series.
Images attached to this report


Non-image files attached to this report
