Dr. Dripta B. and I went to EX today to do a PCAL End Station measurement with PS4 using the T1500062 ES Power Sensor RR Meas : Procedures & Log.
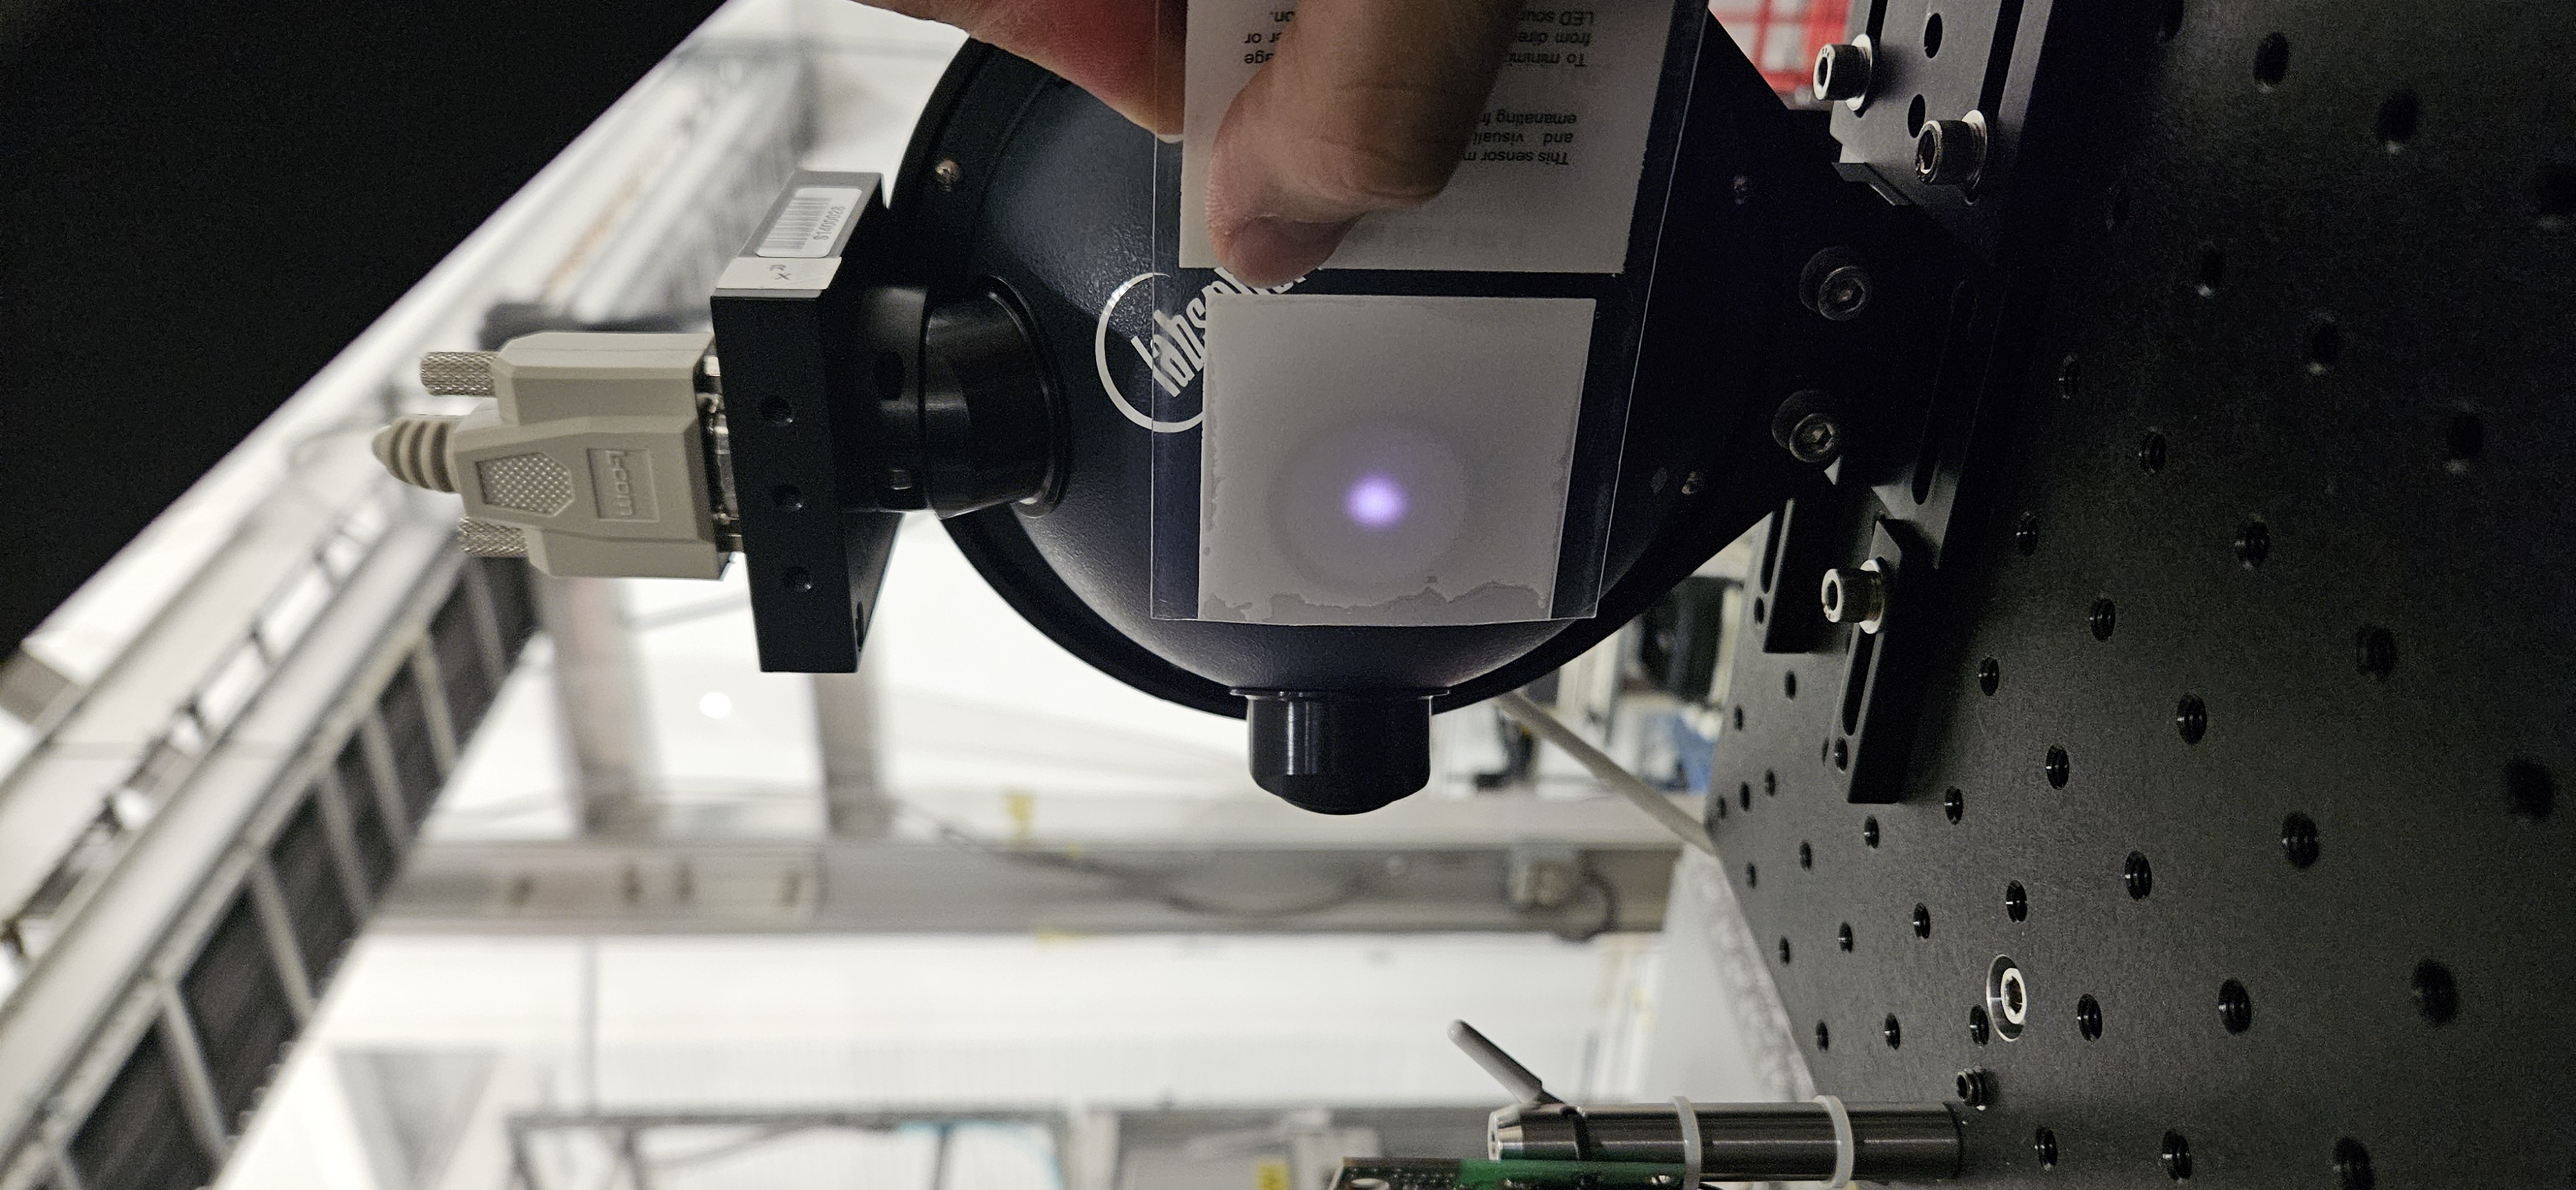
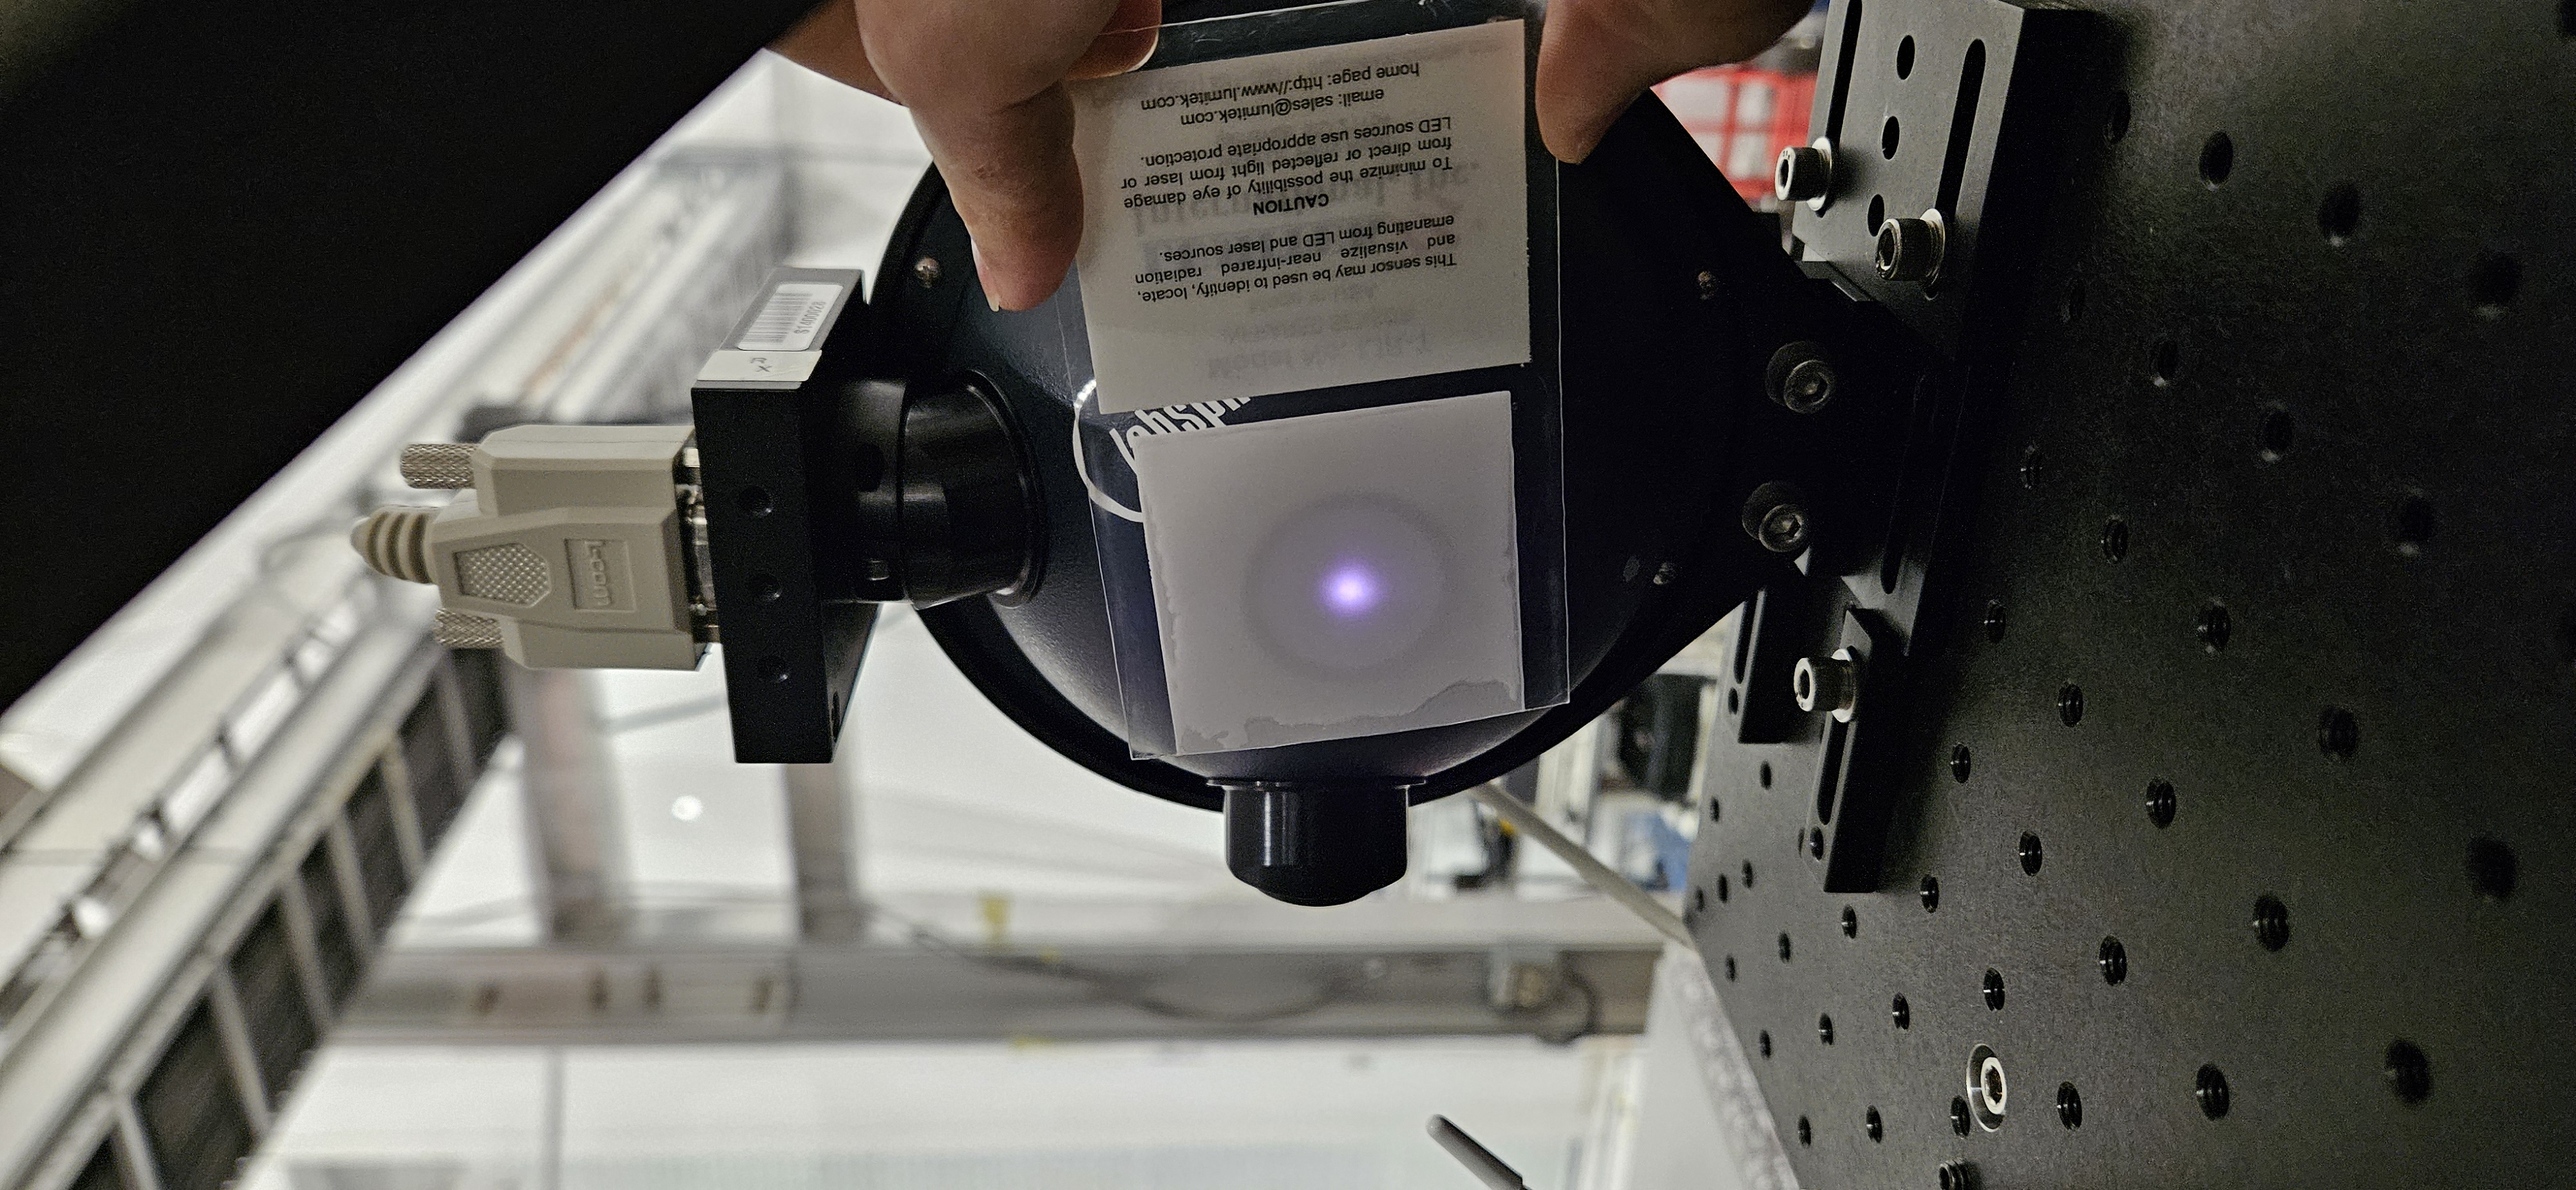
I took a picture of the beam spots before we started, and after we were done.
We ran Miriam's fantastic shell tool & left her some feed back written in the margins of the 2.2 section of the T1500062 Proc & Log document linked above.
We tried to run the measurement right at the end station but we didn't know that NDS servers were having a problem this week.
I eventually changed the server to be h1daqnds1 port 8088 to get the data instead.
Command Ran:
python generate_measurement_data.py --WS PS4 --date 2025-11-03
Reading in config file from python file in scripts
../../../Common/O4PSparams.yaml
PS4 rho, kappa, u_rel on 2025-11-03 corrected to ES temperature 299.5 K :
-4.7017855975867215 -0.0002694340454223 2.686163396659873e-05
Copying the scripts into tD directory...
Connected to h1daqnds1
martel run
reading data at start_time: 1446313243
reading data at start_time: 1446313659
reading data at start_time: 1446313992
reading data at start_time: 1446314497
reading data at start_time: 1446314910
reading data at start_time: 1446315256
reading data at start_time: 1446315430
reading data at start_time: 1446316080
reading data at start_time: 1446316490
Ratios: -0.46104301054554775 -0.4663040860974578
writing nds2 data to files
finishing writing
Background Values:
bg1 = 9.224674; Background of TX when WS is at TX
bg2 = 4.512480; Background of WS when WS is at TX
bg3 = 9.191238; Background of TX when WS is at RX
bg4 = 4.365167; Background of WS when WS is at RX
bg5 = 9.279967; Background of TX
bg6 = 0.429854; Background of RX
The uncertainty reported below are Relative Standard Deviation in percent
Intermediate Ratios
RatioWS_TX_it = -0.461043;
RatioWS_TX_ot = -0.466304;
RatioWS_TX_ir = -0.455583;
RatioWS_TX_or = -0.461207;
RatioWS_TX_it_unc = 0.084627;
RatioWS_TX_ot_unc = 0.080522;
RatioWS_TX_ir_unc = 0.093808;
RatioWS_TX_or_unc = 0.083107;
Optical Efficiency
OE_Inner_beam = 0.988311;
OE_Outer_beam = 0.989318;
Weighted_Optical_Efficiency = 0.988814;
OE_Inner_beam_unc = 0.058828;
OE_Outer_beam_unc = 0.054324;
Weighted_Optical_Efficiency_unc = 0.080074;
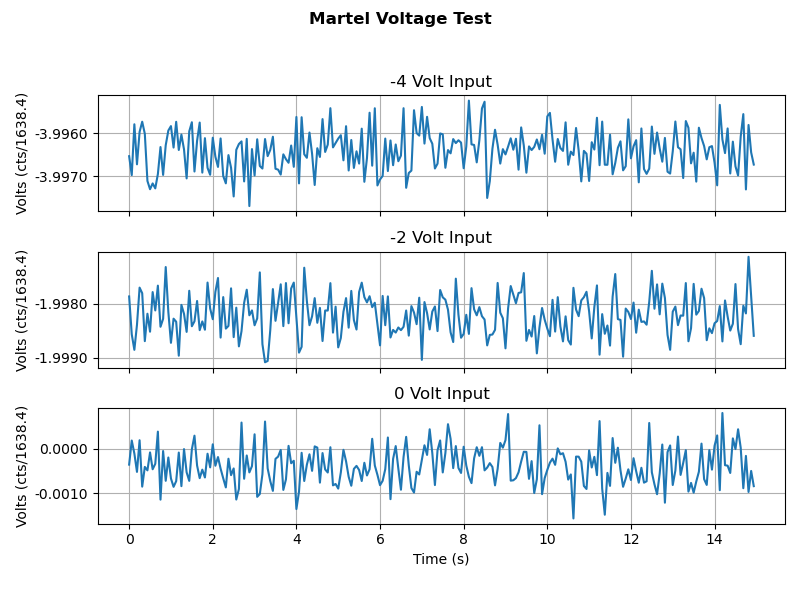
Martel Voltage fit:
Gradient = 1637.051728;
Intercept = 0.515075;
Power Imbalance = 0.988718;
Endstation Power sensors to WS ratios::
Ratio_WS_TX = -1.078345;
Ratio_WS_RX = -1.392858;
Ratio_WS_TX_unc = 0.050215;
Ratio_WS_RX_unc = 0.044908;
=============================================================
============= Values for Force Coefficients =================
=============================================================
Key Pcal Values :
GS = -5.135100; Gold Standard Value in (V/W)
WS = -4.701786; Working Standard Value
costheta = 0.988362; Angle of incidence
c = 299792458.000000; Speed of Light
End Station Values :
TXWS = -1.078345; Tx to WS Rel responsivity (V/V)
sigma_TXWS = 0.000541; Uncertainity of Tx to WS Rel responsivity (V/V)
RXWS = -1.392858; Rx to WS Rel responsivity (V/V)
sigma_RXWS = 0.000626; Uncertainity of Rx to WS Rel responsivity (V/V)
e = 0.988814; Optical Efficiency
sigma_e = 0.000792; Uncertainity in Optical Efficiency
Martel Voltage fit :
Martel_gradient = 1637.051728; Martel to output channel (C/V)
Martel_intercept = 0.515075; Intercept of fit of Martel to output (C/V)
Power Loss Apportion :
beta = 0.998895; Ratio between input and output (Beta)
E_T = 0.993842; TX Optical efficiency
sigma_E_T = 0.000398; Uncertainity in TX Optical efficiency
E_R = 0.994941; RX Optical Efficiency
sigma_E_R = 0.000398; Uncertainity in RX Optical efficiency
Force Coefficients :
FC_TxPD = 7.895132e-13; TxPD Force Coefficient
FC_RxPD = 6.181524e-13; RxPD Force Coefficient
sigma_FC_TxPD = 5.093350e-16; TxPD Force Coefficient
sigma_FC_RxPD = 3.738196e-16; RxPD Force Coefficient
data written to ../../measurements/LHO_EndX/tD20251104/
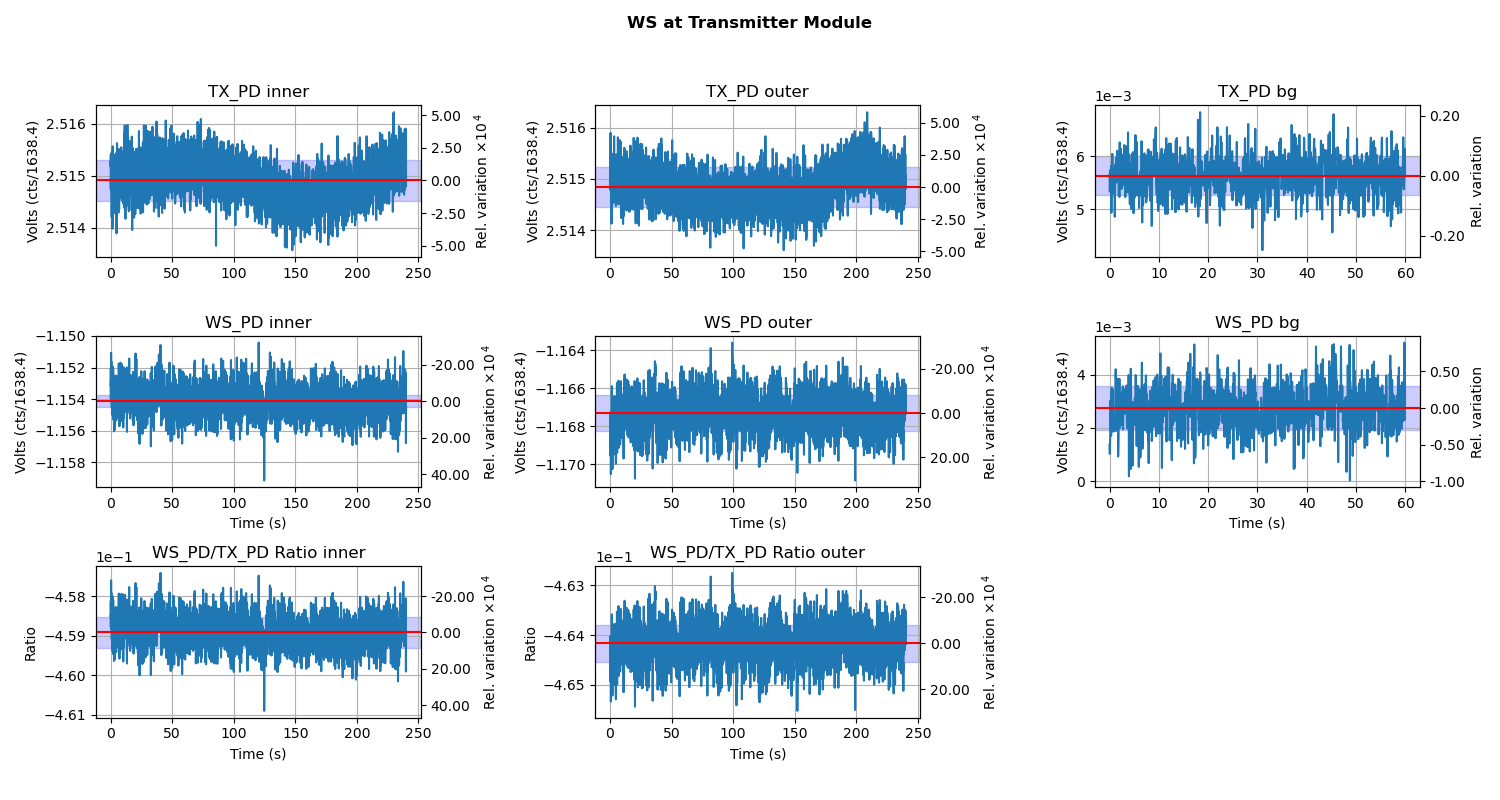
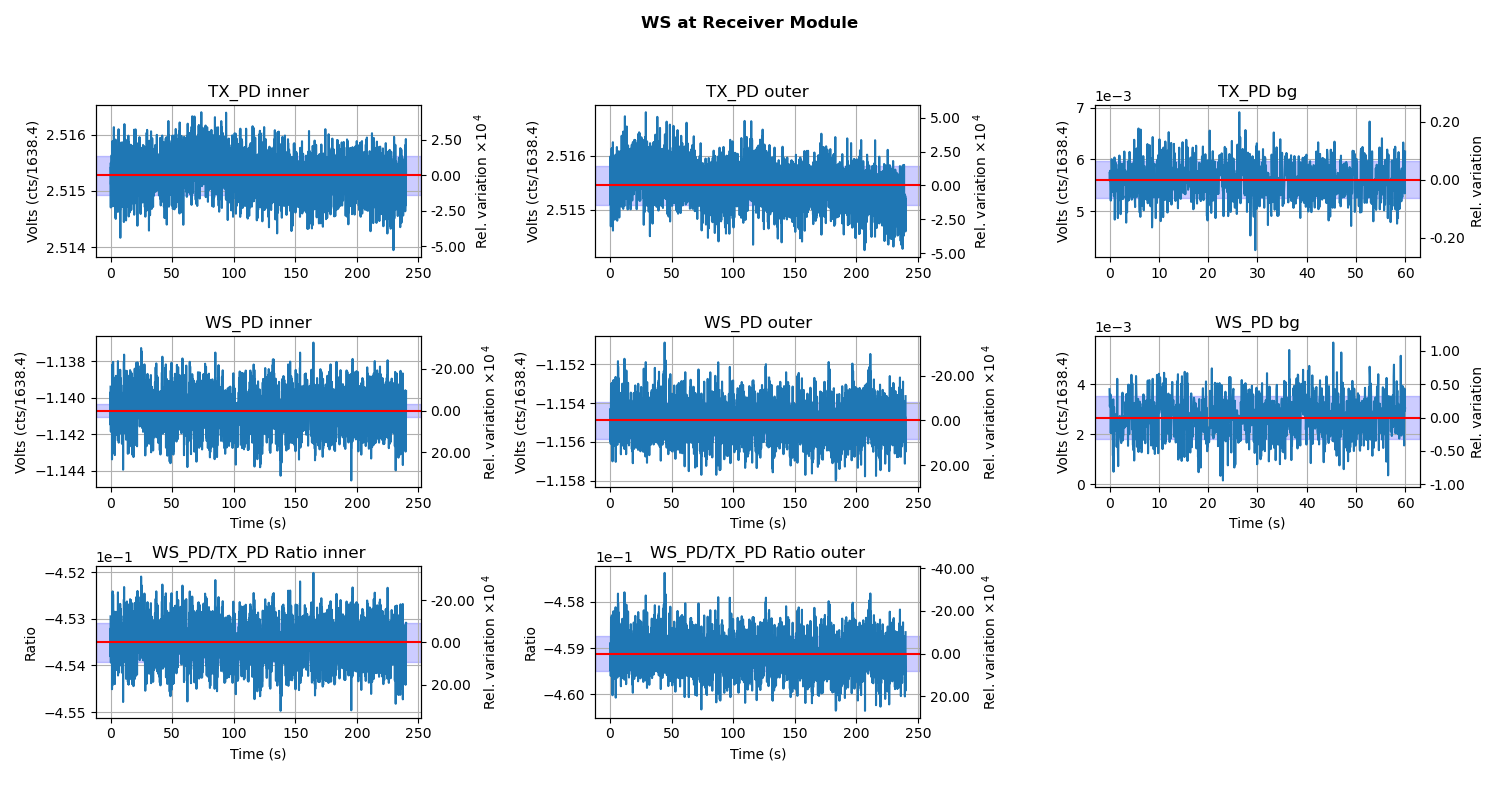
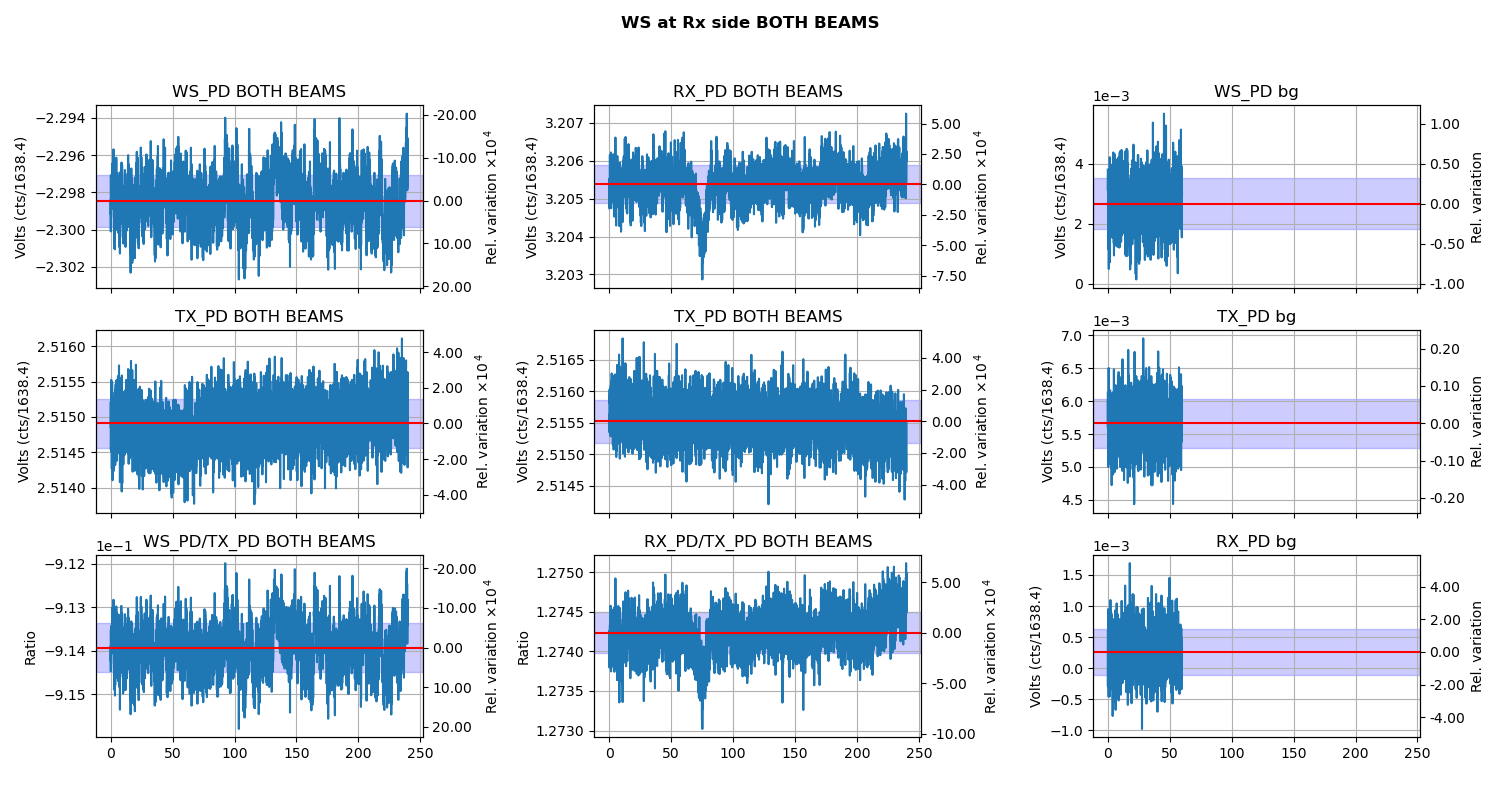
This produced the following plots:
Martel_Voltage_test.png
WS_at_TX.png
WS_at_RX.png
WS_at_RX_BOTH_BEAMS.png
Running the the Following command makes the Trends plots for the ES measurement:
python pcalPublishReportsV5.py LHO_EndX tD20251104
LHO_EndX_PD_ReportV5.pdf
All of this can be found at the PCAL git lab repo.


