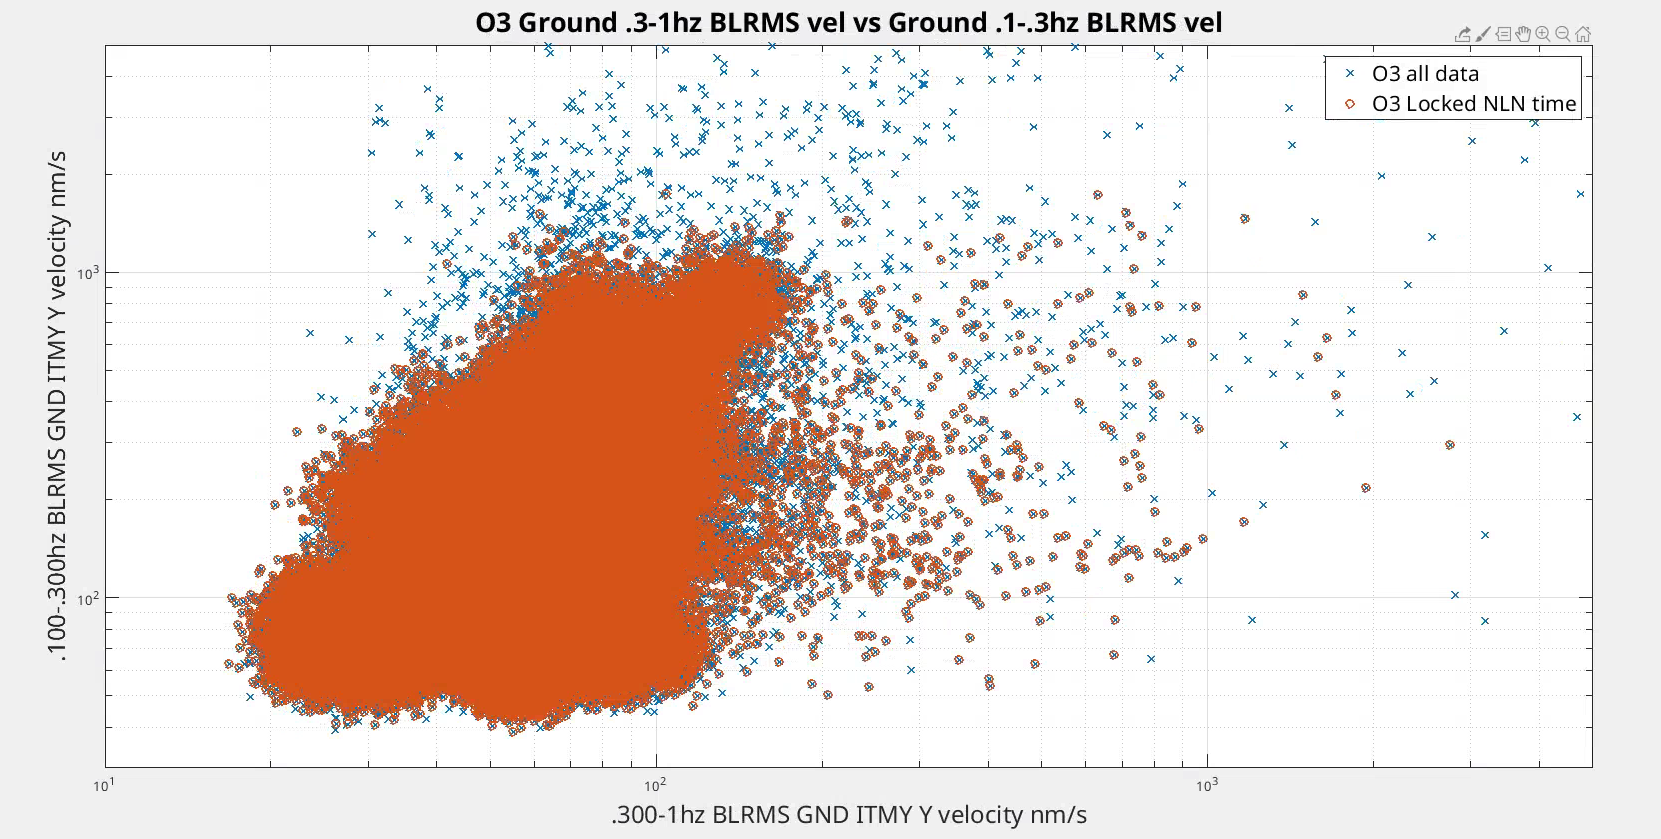
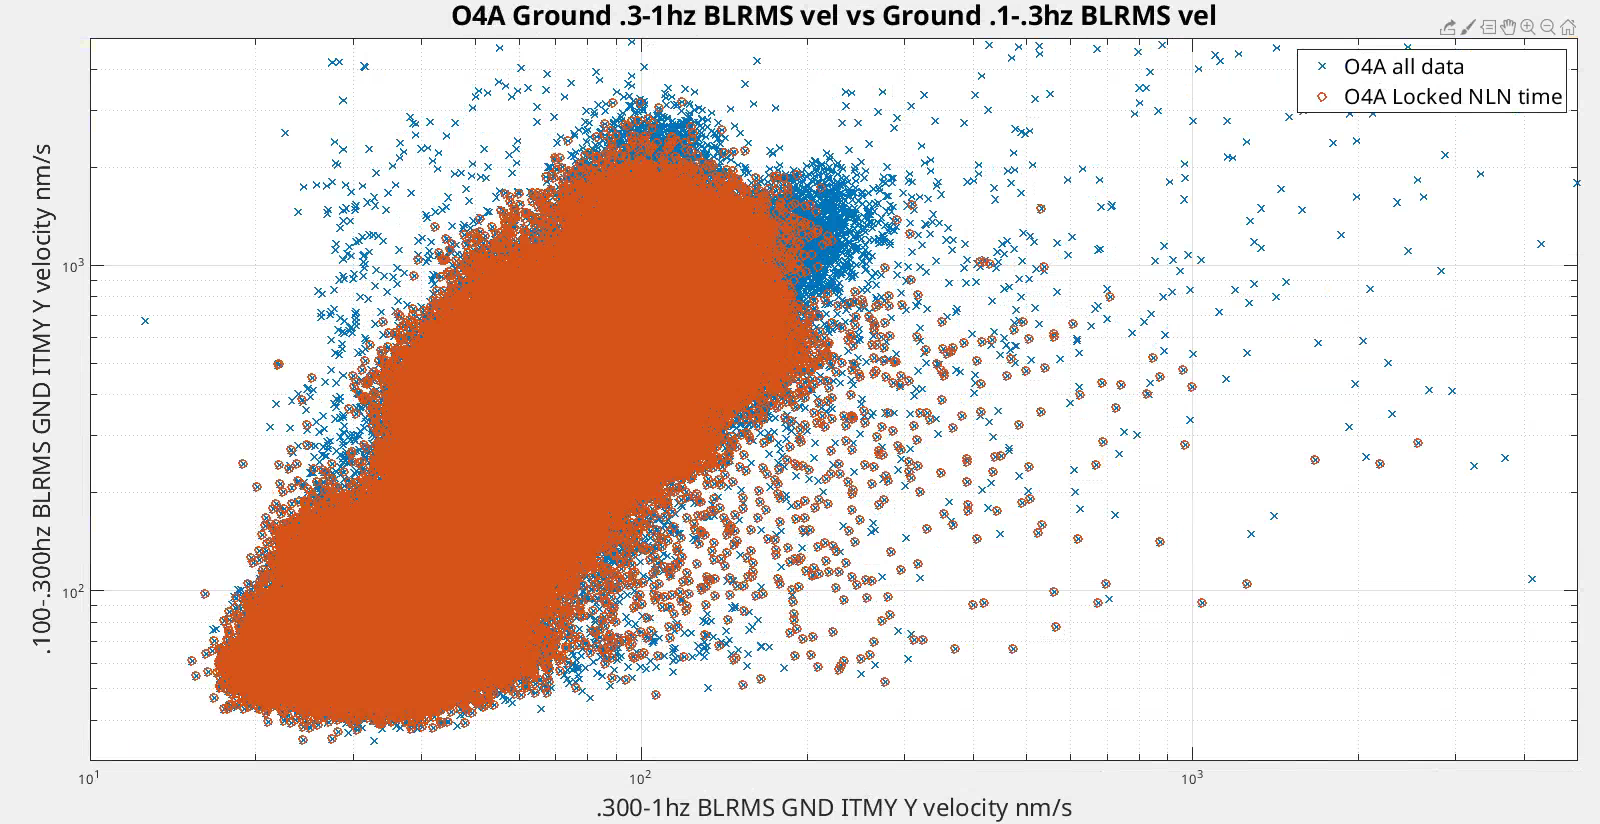
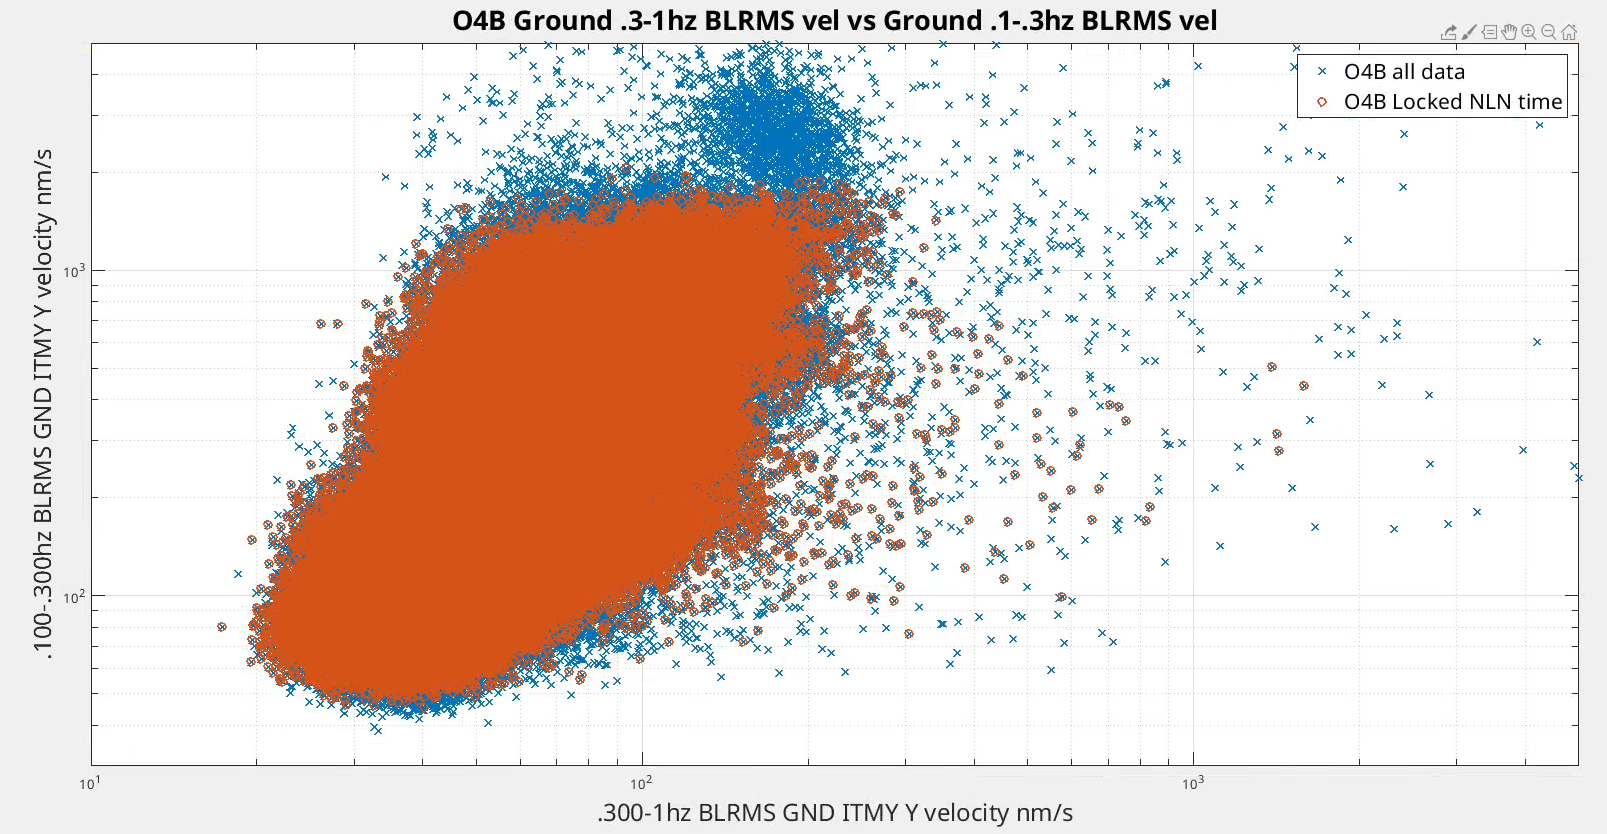
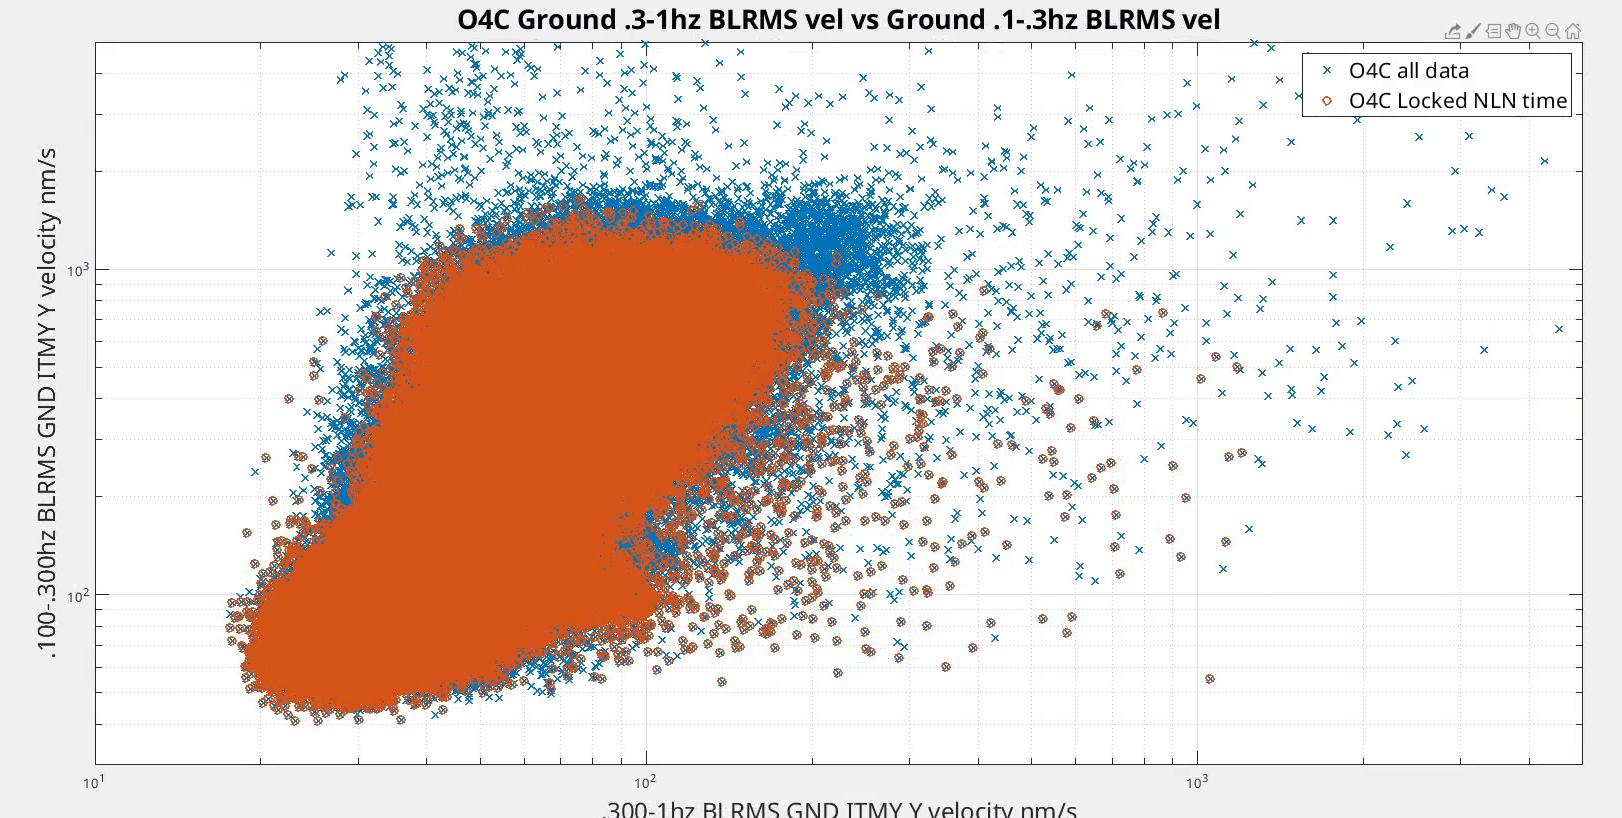
With the locking difficulties lately, we were wondering if the .3-1hz gnd motion might have an impact on the ability of the interferometer to stay locked. I'm not sure I have a complete answer to that yet, but it does seem like there might be some impact. For the 4 attached plots, I got the max minute trends for the .3-1hz blrms velocity and the .1-.3hz blrms for the Y leg of the ITMY STS for O3 and O4A,B&C. For each minute, I plot the .3-1hz blrms on the x-axis and .1-.3hz blrms on the y-axis. The blue points are all of the data points, the red points are for the times we were locked at NLN. The first plot is for O3, the second is O4A, third is O4B and the fourth is O4C.
For all plots, the bulk of the .3-1hz motion is below 200nm/s. For O3, it seems like the motion was generally lower for these bands in the y direction, but we were locked for more of the points above 200nm/s for the .3-1hz band. It also seems like we have gotten less robust against both bands as O4 has gone on, the distribution of red locked points seems pushed down and left for O4C relative to the other runs.
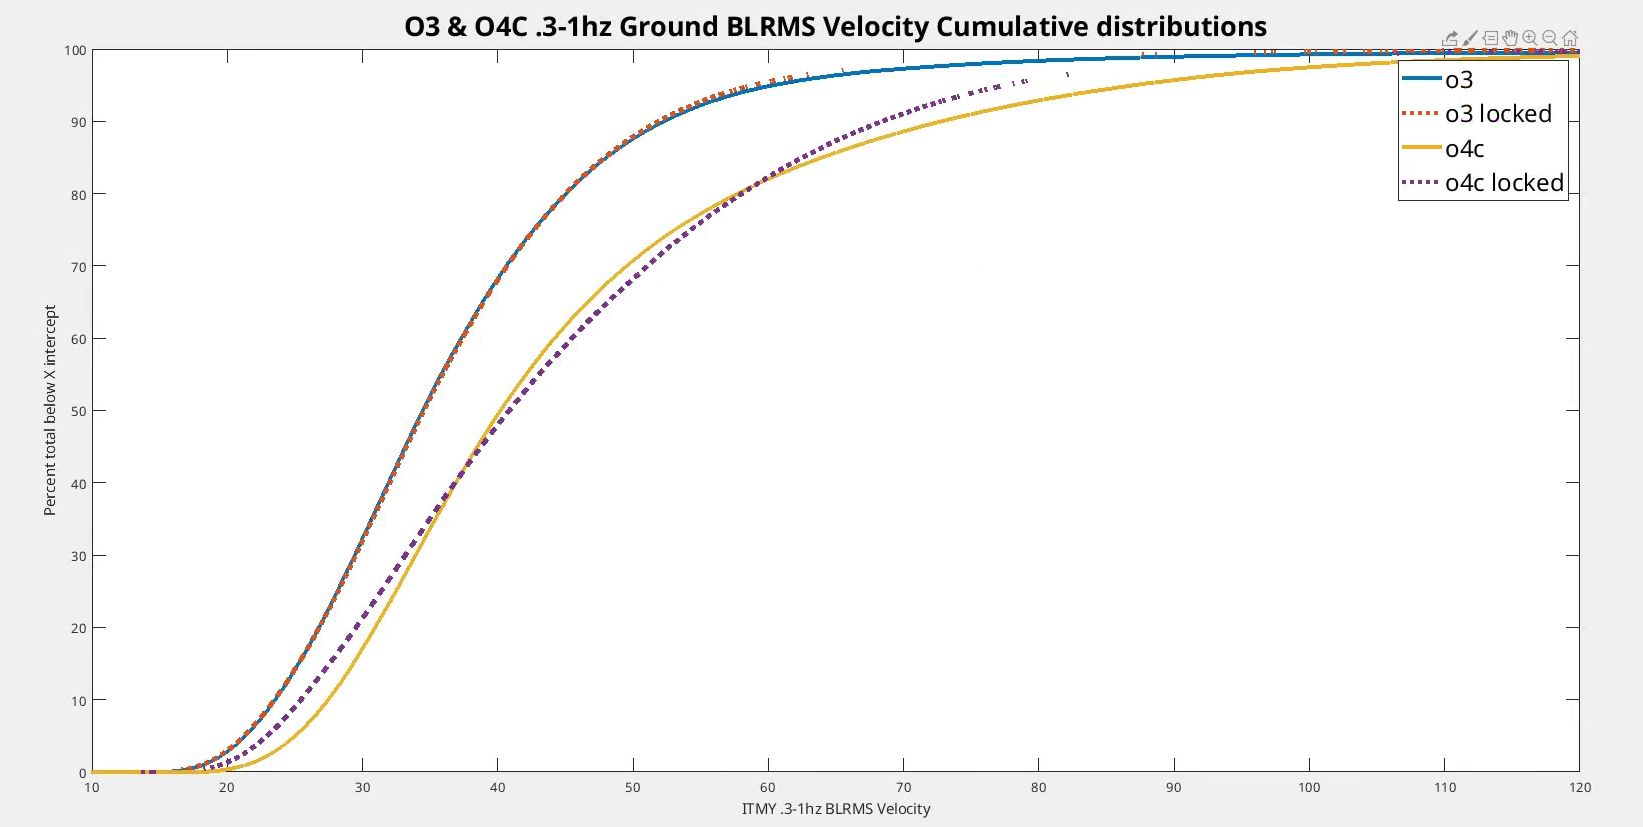
Last plot is a cumulative distribution function for the .3-1hz blrms velocity for O3 and O4C. The x axis is the .3-1hz blrms velocity, the y intercept for each curve is the percent of the time the velocity was below the x-value. The solid lines are the cdfs for all of the data for each run, the dashed lines are the cdfs for time we were locked at nln. This plot again suggests the overall velocities for O3 were lower than O4C. The separation between the upper end of the O4C curves also suggests that the higher velocities had more of an impact on our ability to stay locked.