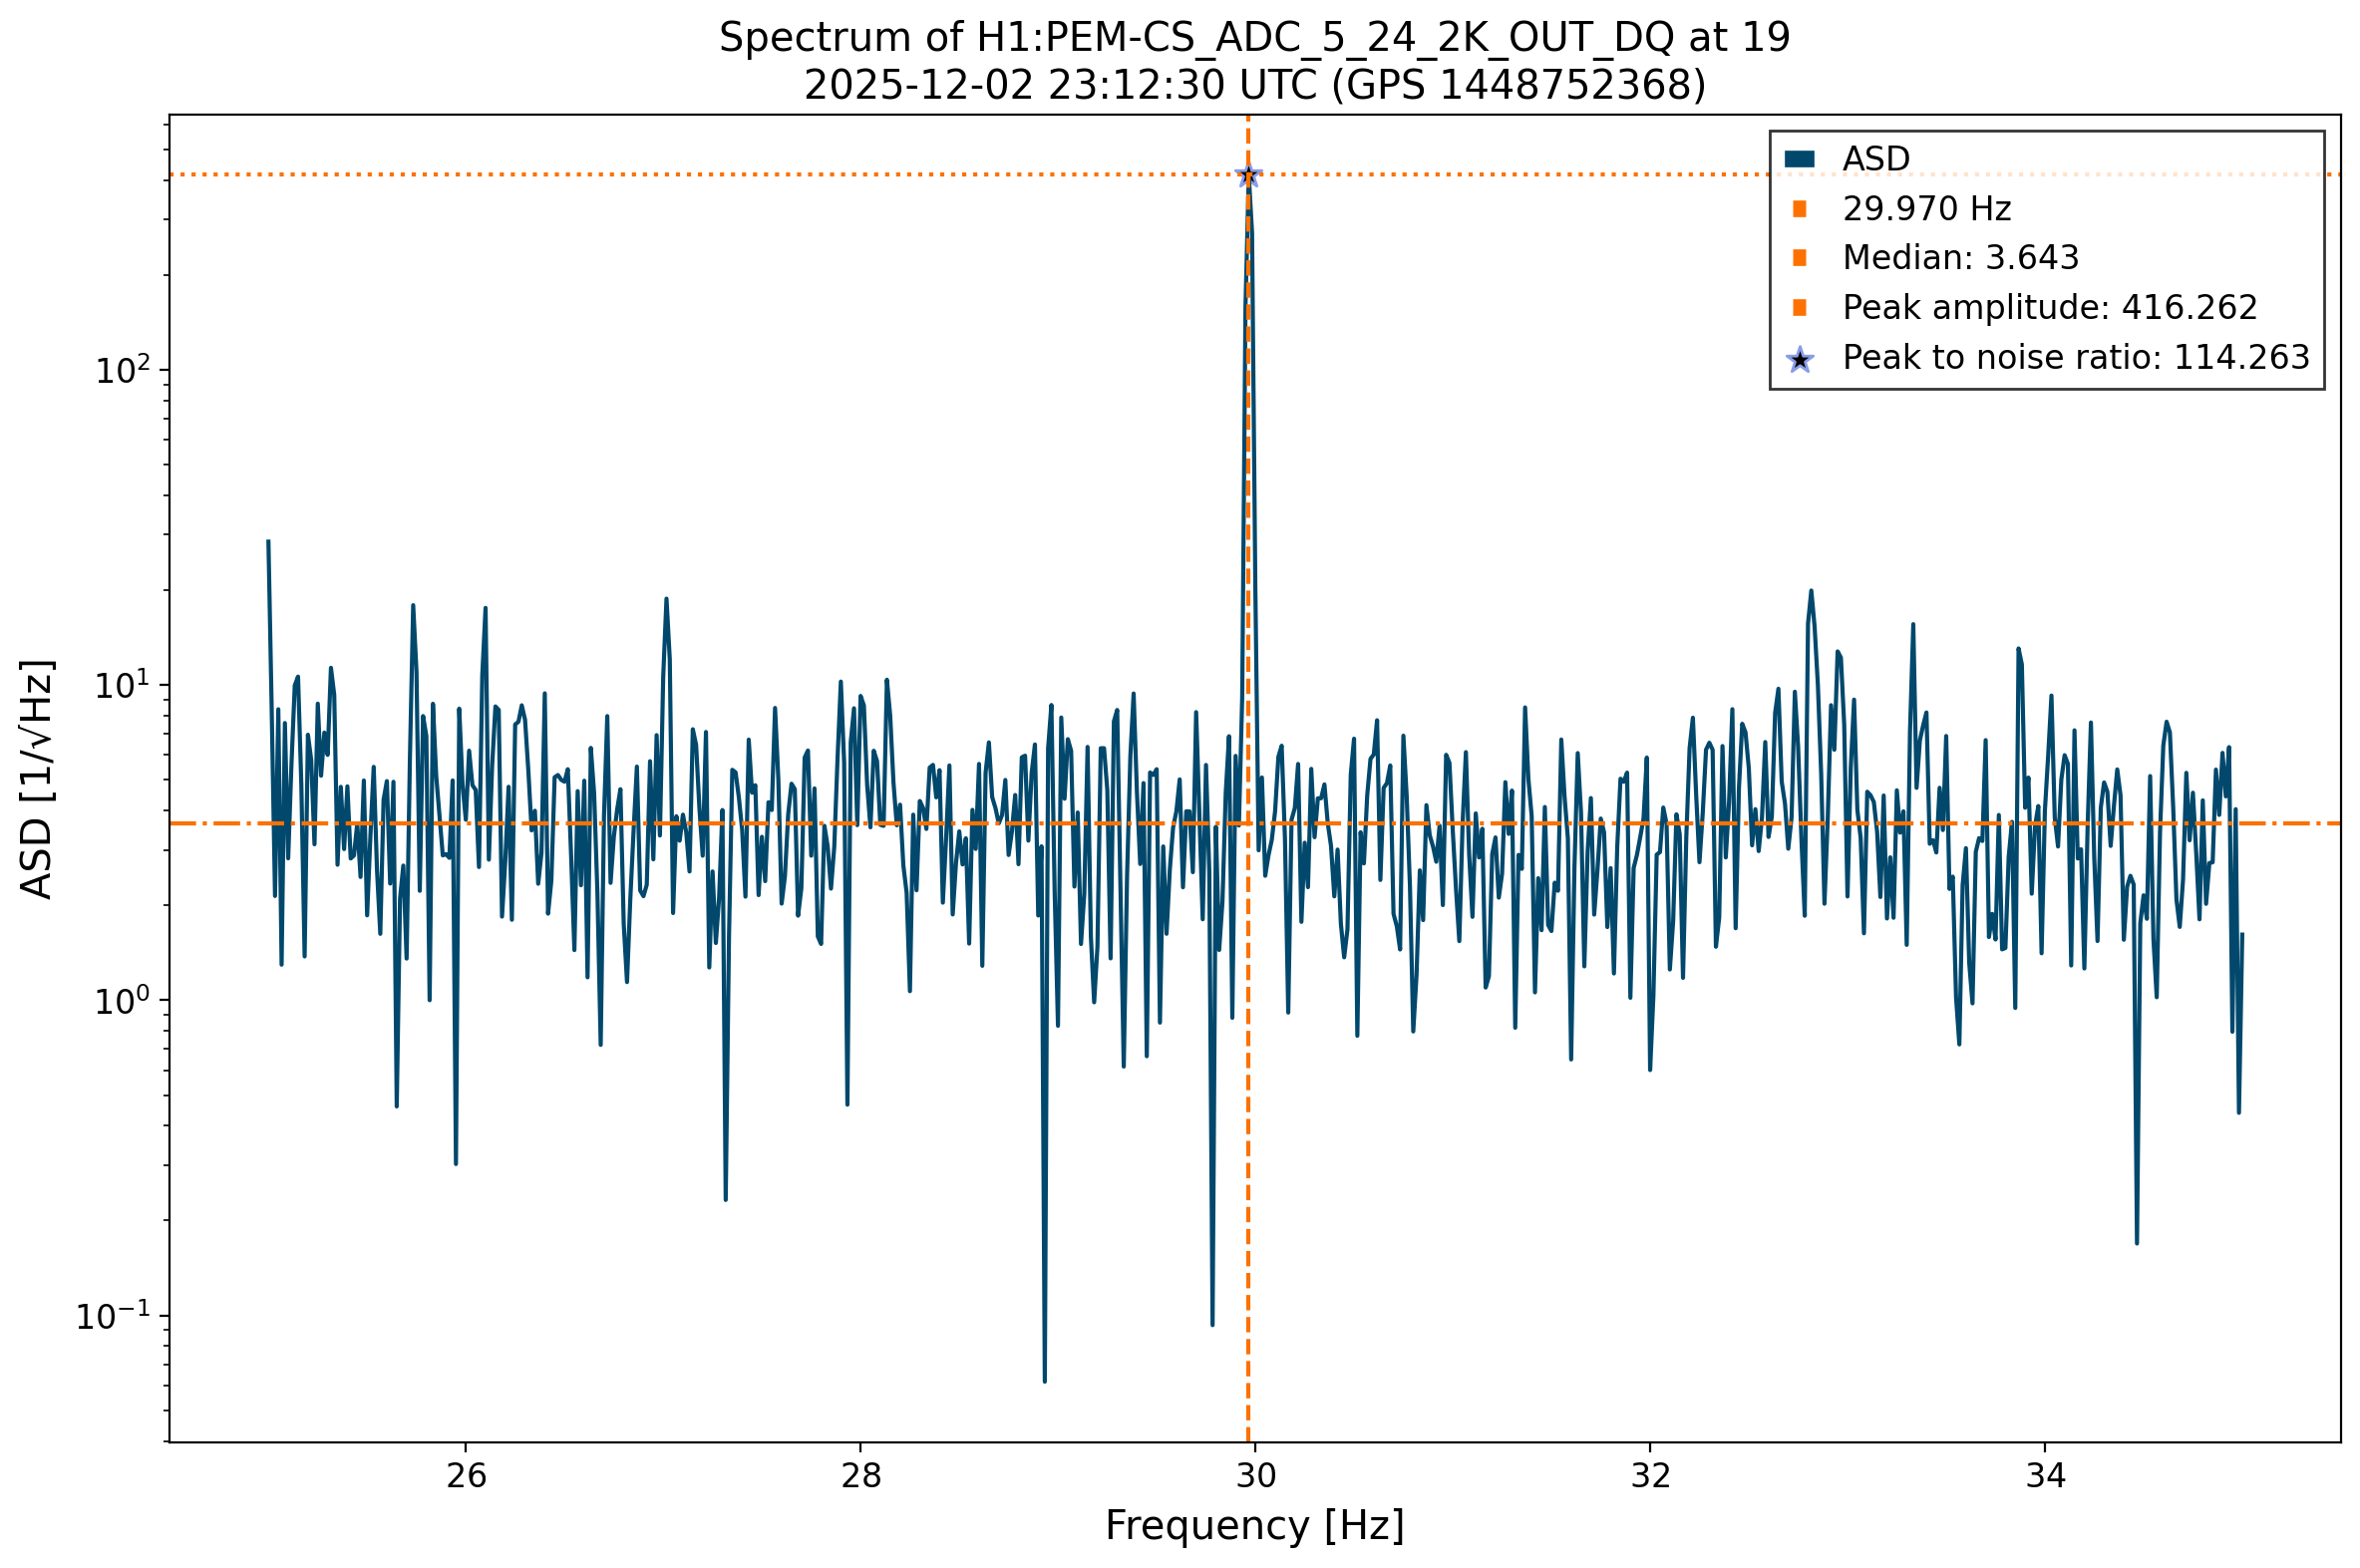
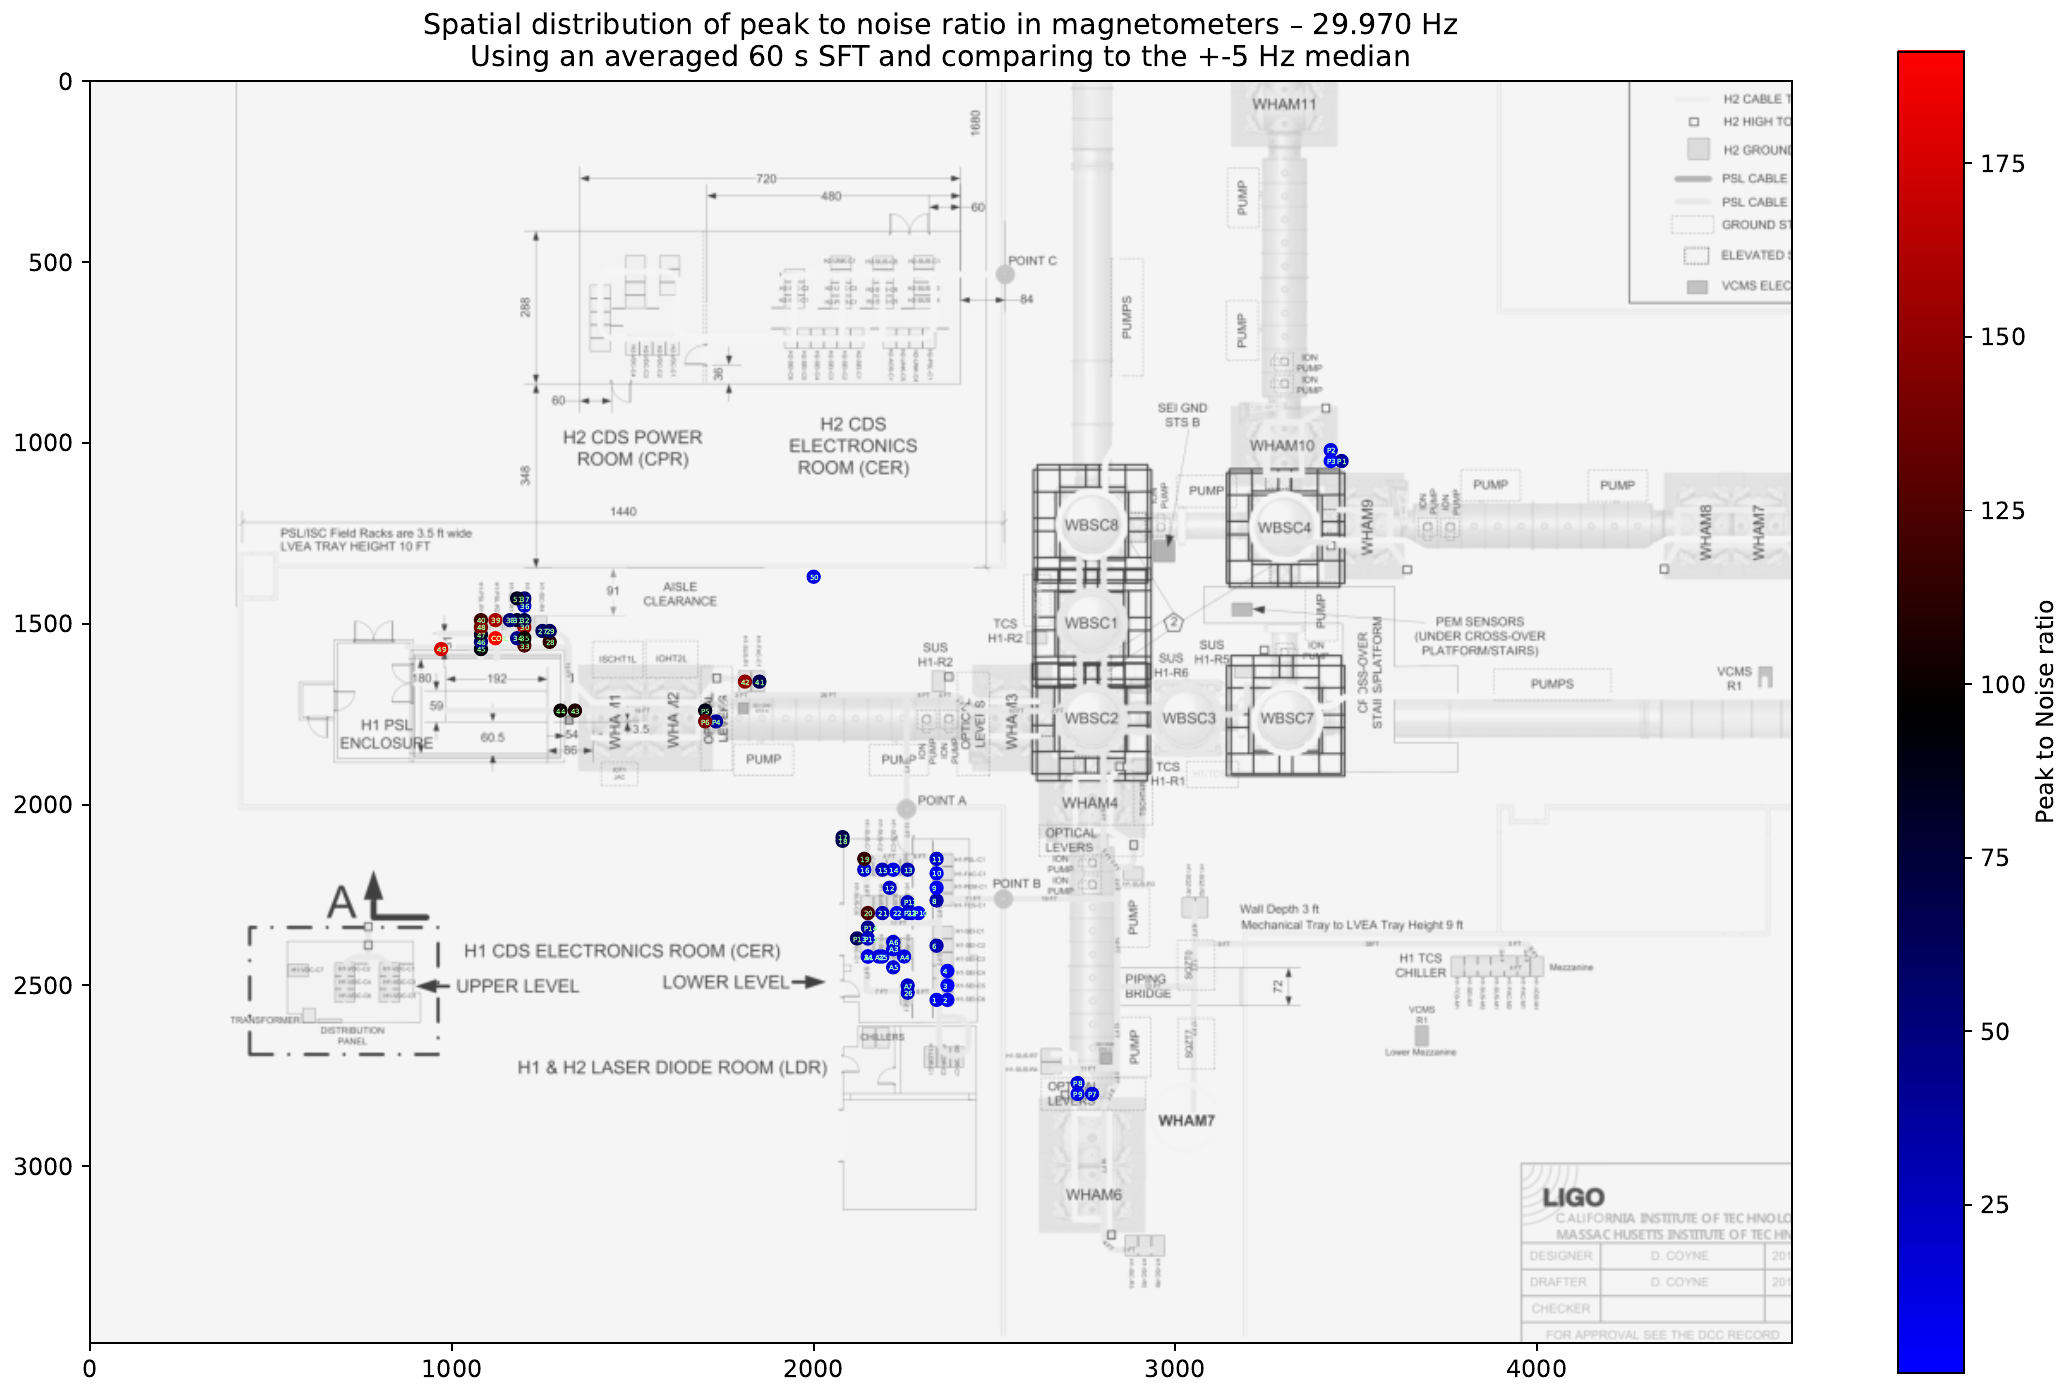
[Joan-Rene Merou, Alicia Calafat, Sheila Dwyer, Anamaria Effler, Robert Schofield] This is a continuation of the work performed to mitigate the set of near-30 Hz and near-100 Hz combs as described is Detchar issue 340 and lho-mallorcan-fellowship/-/issues/3. As well as the work in alogs 88089, 87889 and 87414. In this search, we have been moving around two magnetometers provided to us by Robert. Given our previous analyses, we thought the possible source of the combs would be around either the electronics room or the LVEA close to input optics. We have moved around these two magnetometers to have a total of more than 70 positions. In each position, we left the magnetometers alone and still for at least 2 minutes, enough to produce ASDs using 60 seconds of data and recording the Z direction (parallel to the cylinder). For each one of the positions, we recorded the data shown in the following plotThat is, we compute the ASD using 60s FT and check the amplitude of the ASD at the frequency of the first harmonic of the largest of the near-30 Hz combs, the fundamental at 29.9695 Hz. Then, we compute the median of the +- 5 surrounding Hz and save the ASD value at 29.9695 Hz "peak amplitude" and the ratio of the peak against the median to have a sort of "SNR" or "Peak to Noise ratio". Note that we also check the permanent magnetometer channels. However, in order to compare them to the rest, we multiplied the ASD of the magnetometers that Robert gave us times a hundred so that all of them had units of Tesla. After saving the data for all the positions, we have produced the following two plots. The first one shows the peak to noise ratio of all positions we have checked around the LVEA and the electronics room:
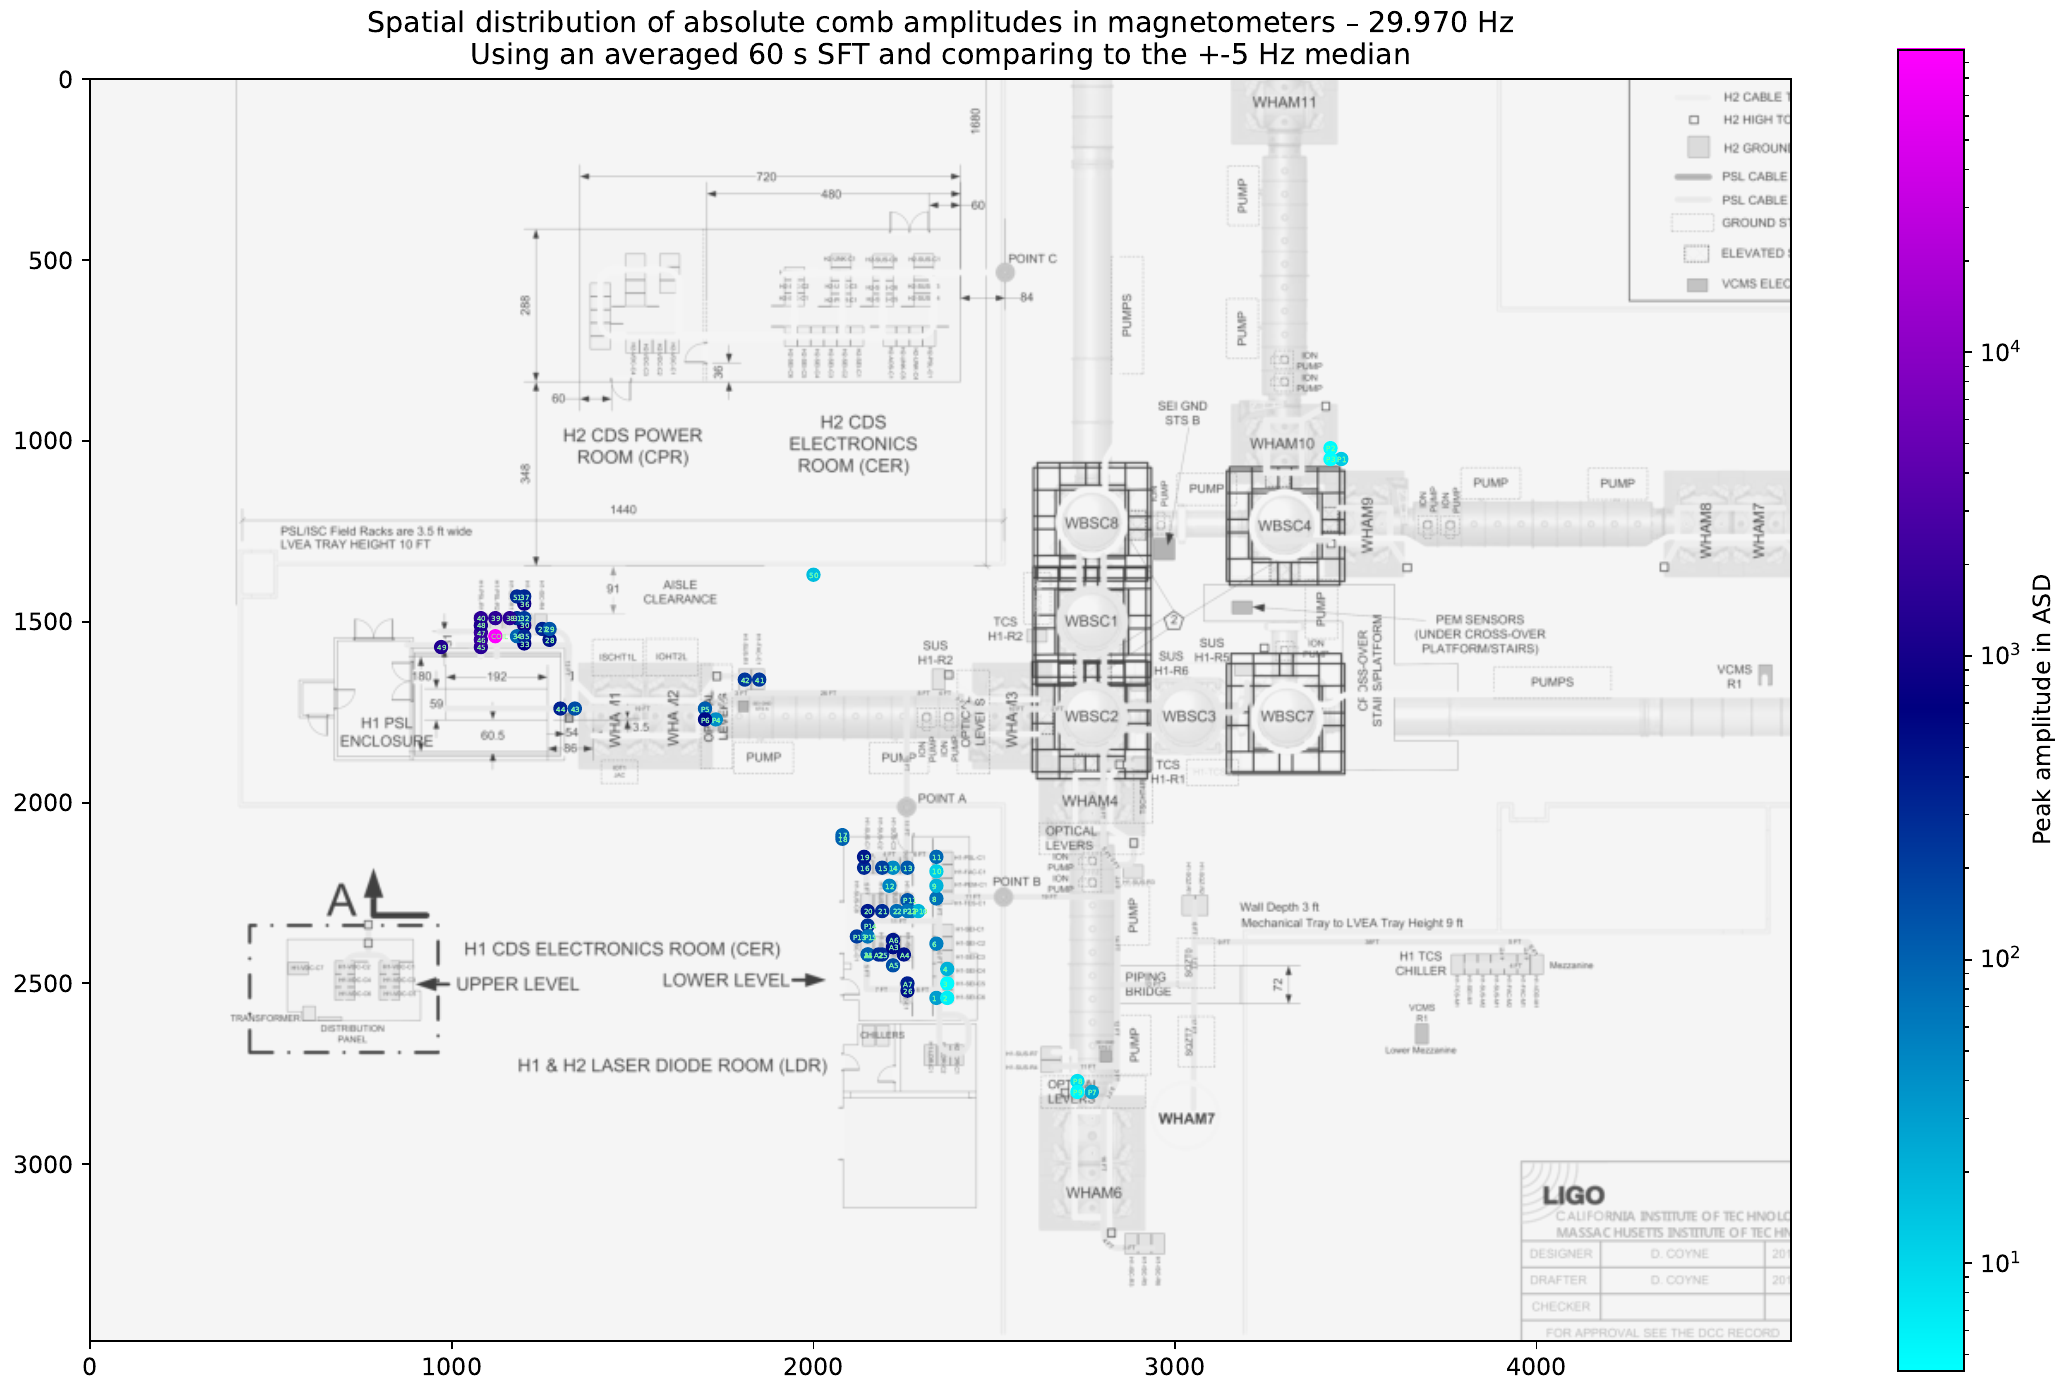
Where the X and Y axis are simply the image pixels. The color scale indicates the peak to noise ratio of the magnetometer in each position. The background LVEA has been taken from LIGO-D1002704. Note that some points slightly overlap with other ones, this is because in some cases we have check different directions or positions in the same rack. It can be seen how from this SNR plot the source of the comb appears to be around the PSL/ISC Racks. Things become more clear if we also look at the peak amplitude (not ratio) as shown in the following figure:
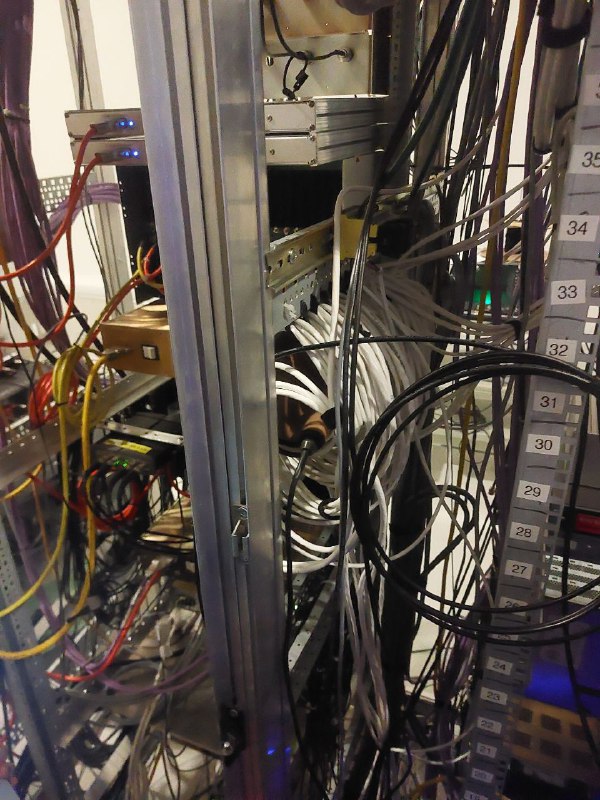
Note that in this figure, the color scale is logarithmic. It can be seen how, looking at the peak amplitudes, there is one particular position in the H1-PSL-R2 rack whose amplitude is around 2 orders of magnitude larger than the other positions. Note that this position also had the largest peak to noise ratio. This position, that we have tagged as "Coil", is putting the magnetometer into a coil of white cables behind the H1-PSL-R2 rack, as shown in this image:
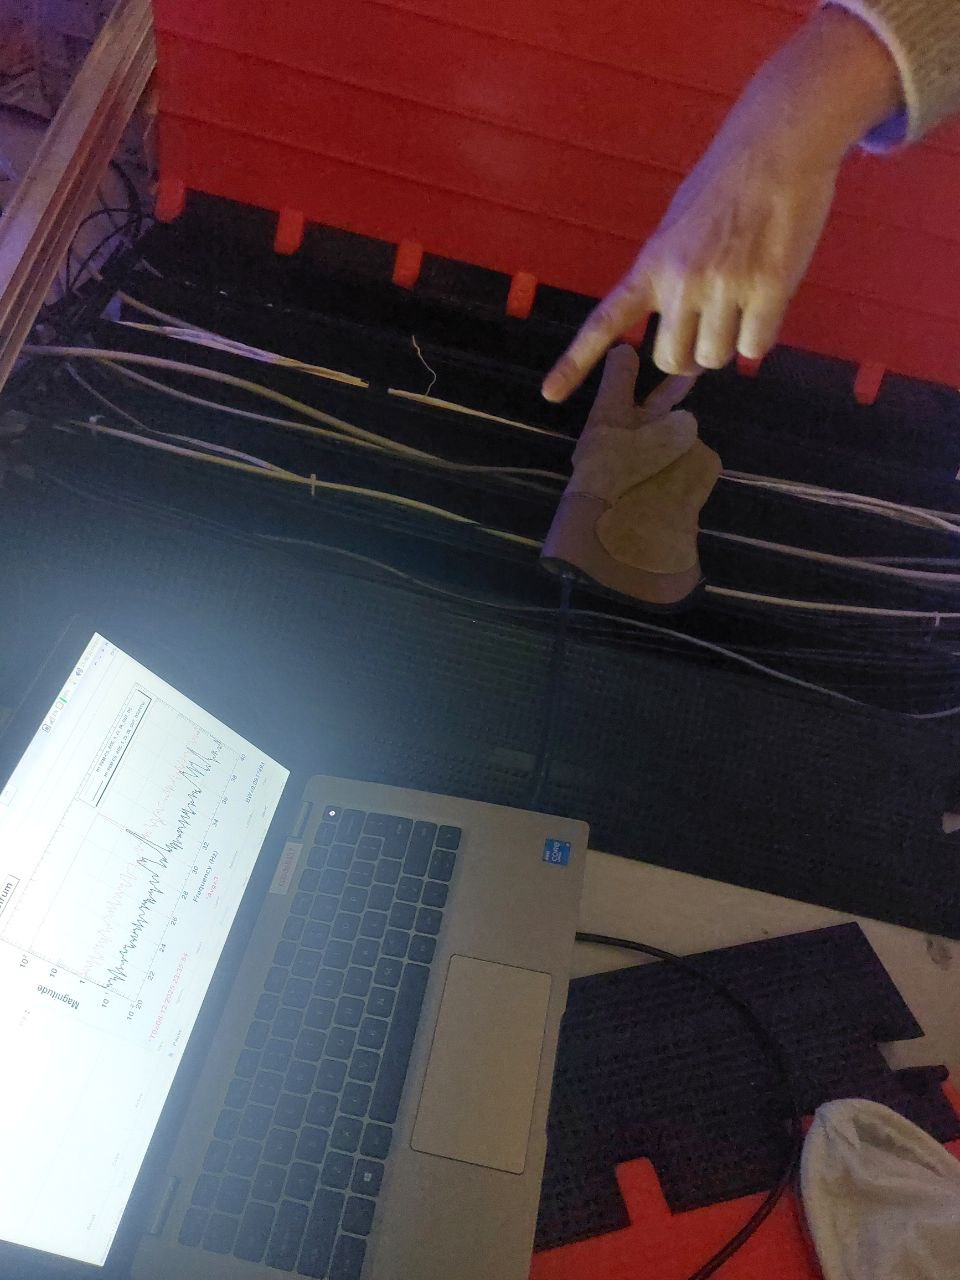
The reason that led us to put the magnetometer there is that we also found the peak amplitude to be around 1 order of magnitude larger than on any other magnetometer on top of one set of white cables that go from inside the room towards the rack and up towards we are not sure where:
This image shows the magnetometer on top of the cables on the ground behind the H1-PSL-R2 rack, the white ones on the top of the image appear to show the peak at its highest. It could be that the peak is louder in the coil because there being so many cables in a coil distribution will generate a stronger magnetic field. This is the actual status of the hunt. These white cables might indicate that the source of these combs is the different interlocking system in L1 and H1, which has a chassis in the H1-PSL-R2 rack. However, we still need to track down exactly these white cables and try turning things on and off based on what we find in order to see if the combs dissapear.
The white cables in question are mostly for the PSL enclosure environmental monitoring system, see D1201172 for a wiring diagram (page 1 is the LVEA, page 2 is the Diode Room). After talking with Alicia and Joan-Rene there are 11 total cables in question: 3 cables that route down from the roof of the PSL enclosure and 8 cables bundled together that route out of the northern-most wall penetration on the western side of the enclosure (these are the 8 pointed out in the last picture of the main alog). The 3 that route from the roof and 5 of those from the enclosure bundle are all routed to the PSL Environmental Sensor Concentrator chassis shown on page 1 of D1201172, which lives near the top of PSL-R2. This leaves 3 of the white cables that route out of the enclosure unaccounted for. I was able to trace one of them to a coiled up cable that sits beneath PSL-R2; this particular cable is not wired to anything and the end isn't even terminated, it's been cleanly cut and left exposed to air. I haven't had a chance to fully trace the other 2 unaccounted cables yet, so I'm not sure where they go. They do go up to the set of coiled cables that sits about half-way up the rack, in between PSL-R1 and PSL-R2 (shown in the next-to-last picture in the main alog), but their path from there hasn't been traced yet.
I've added a PSL tag to this alog, since evidence points to this involving the PSL.