Fri Jan 23 10:09:29 2026 INFO: Fill completed in 9min 25secs
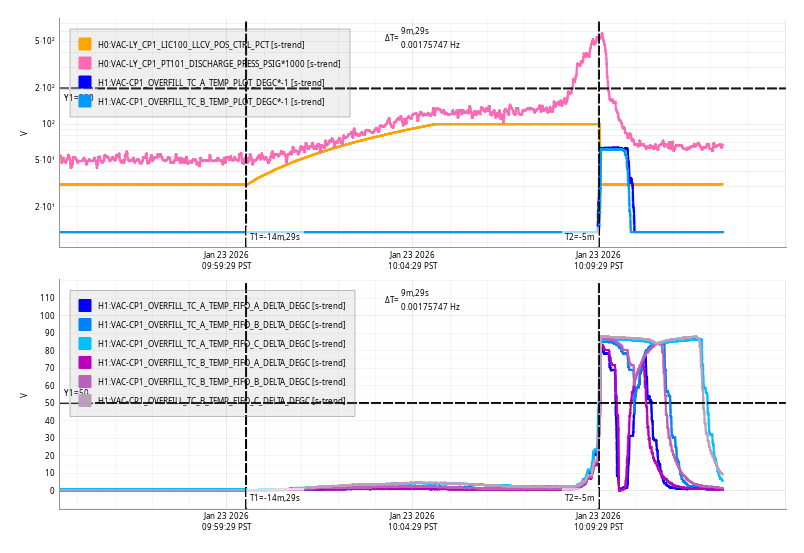
Note I am using a new format for the trend plot which reduces the number of log divisions on the top plot's y-axis.
The problem: during the winter months the TCs start with a positive temp, dropping to around -70C when LN2 is flowing. To show the TCs along with the discharge line pressure and LLCV on the same plot the TC signals are inverted and then all are ploted logarithmically. This means the baseline (positive)temps are now negative which is not shown on a log plot, and when crossing zero they force many divisions in the autoscaled log axis.
The solution: I modified cp1 overfill IOC to serve modified TC[A,B] channels with max temp limits. Max temp is currently -12.3C, settable in the configuration file. Any temp greater that -12.3 is kept at this value for the channels H1:VAC-CP1_OVERFILL_TC_[A,B]_TEMP_PLOT_DEGC