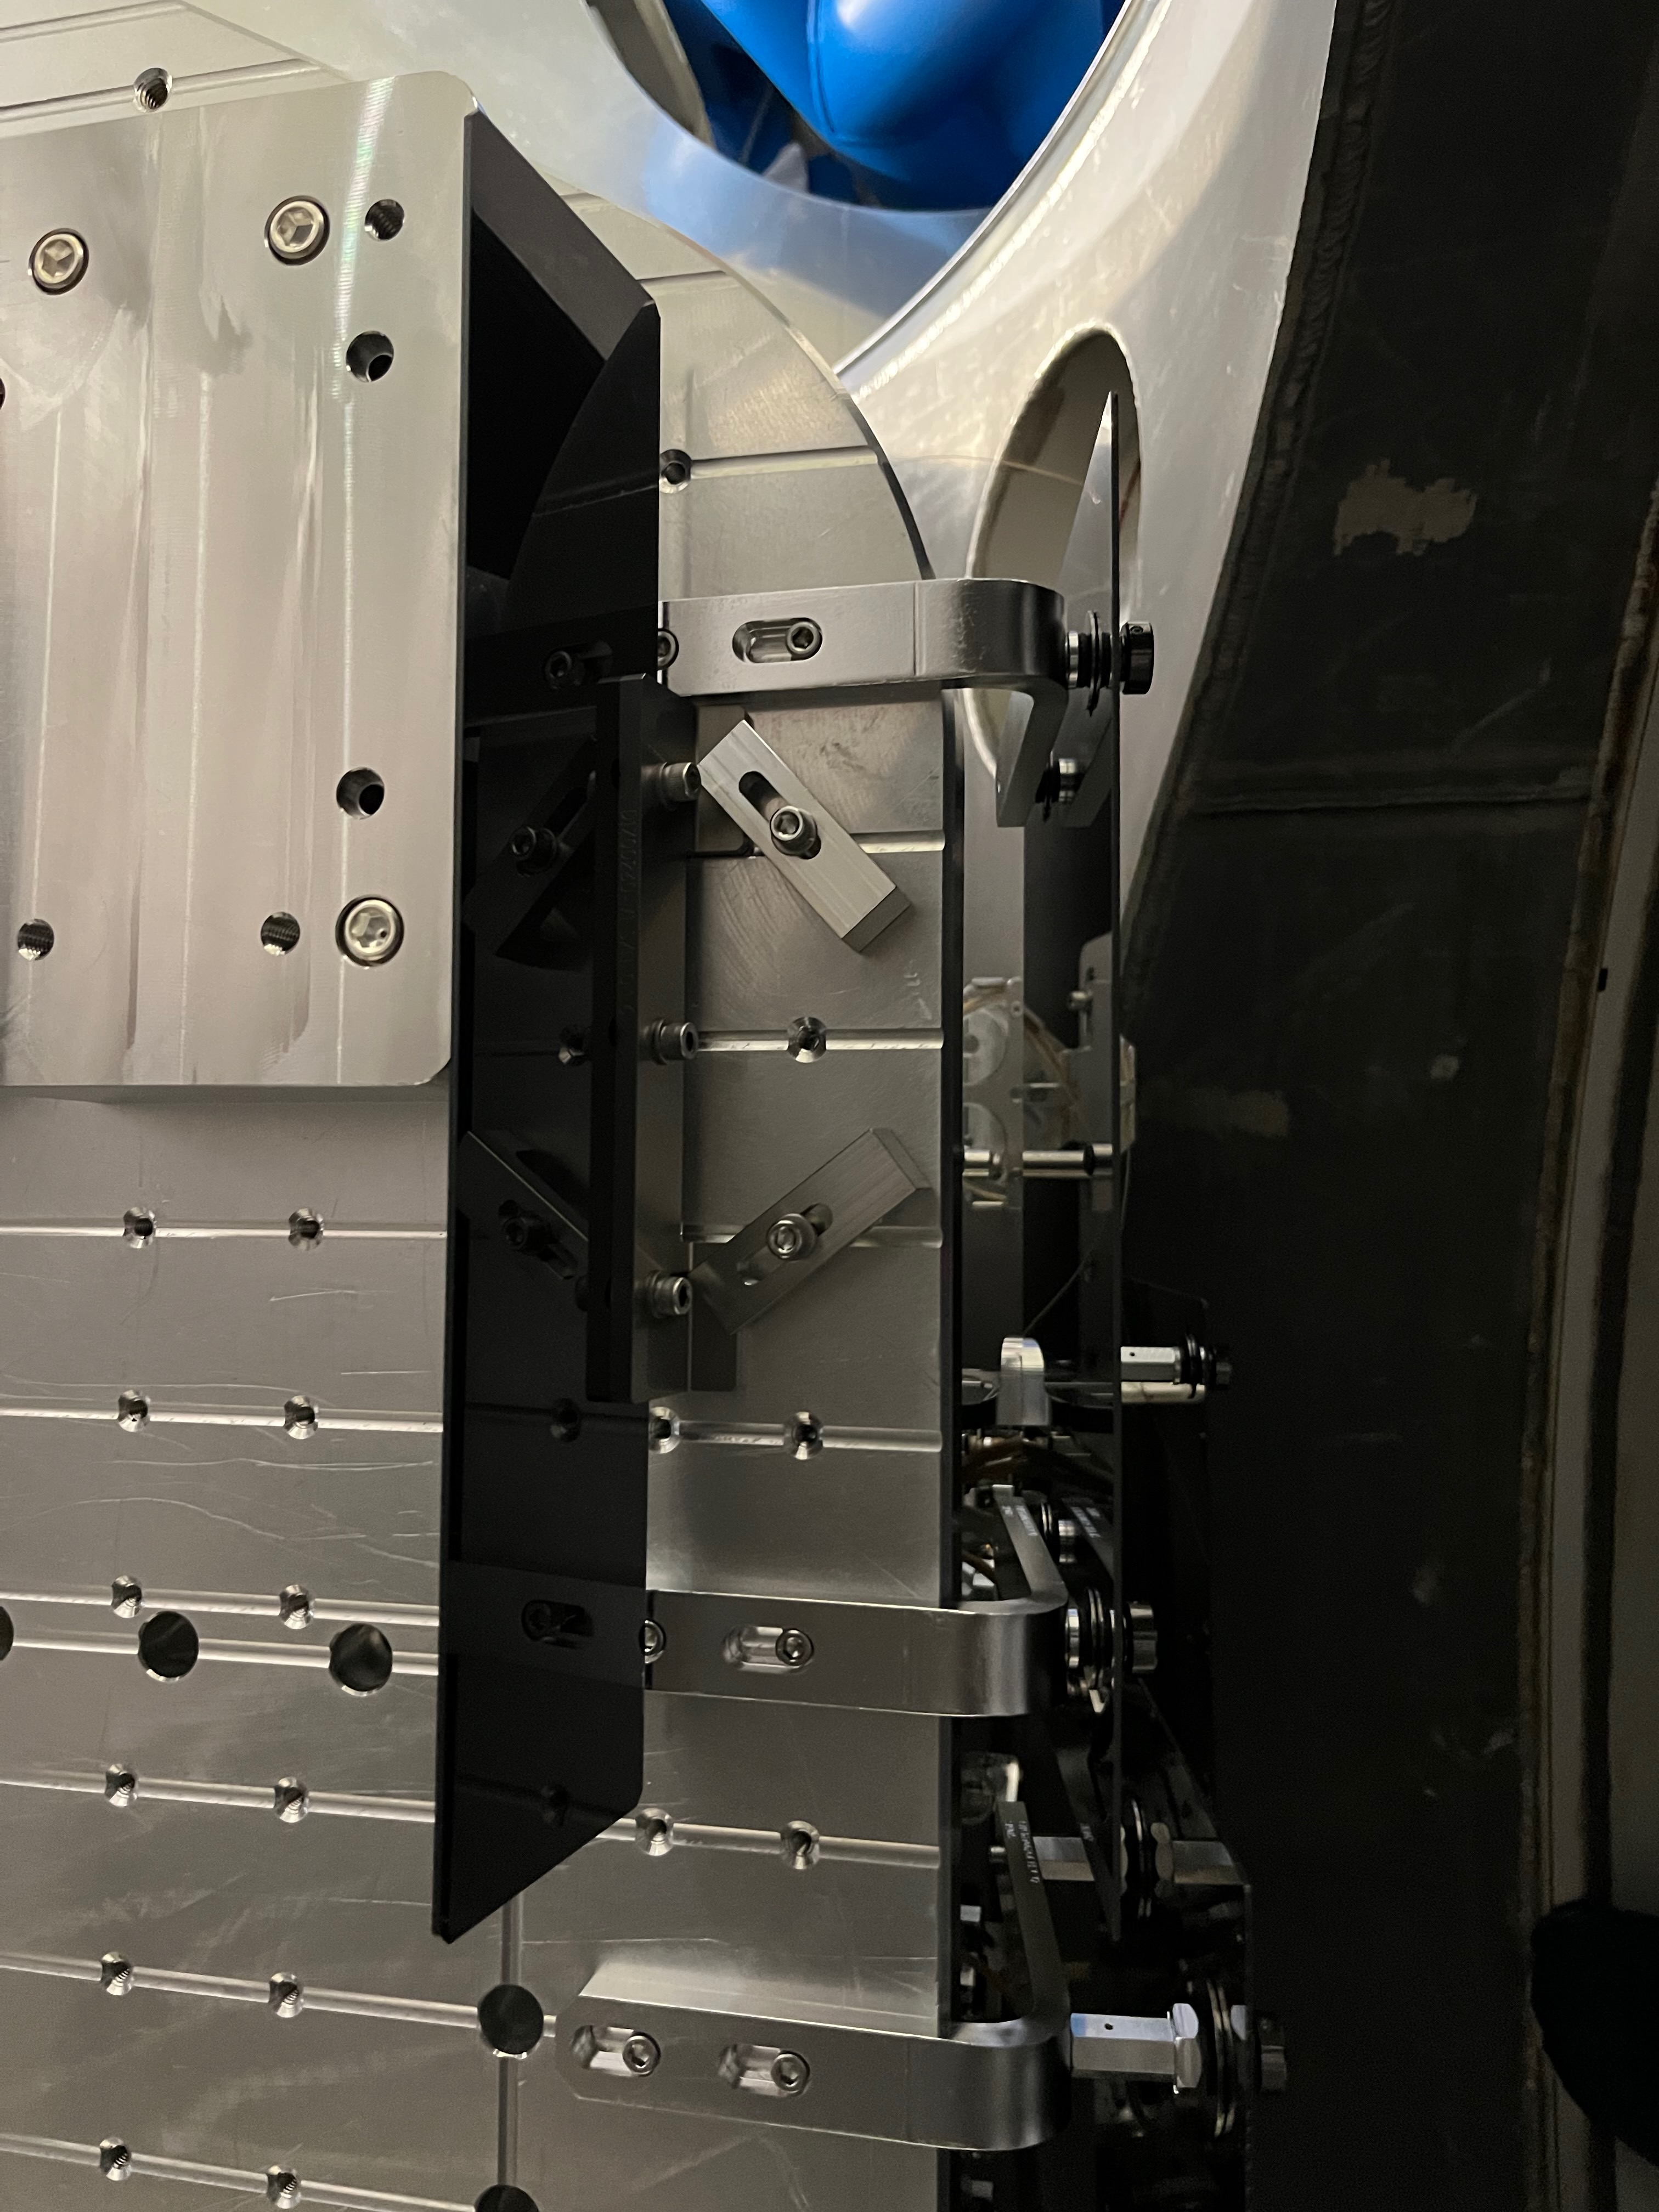
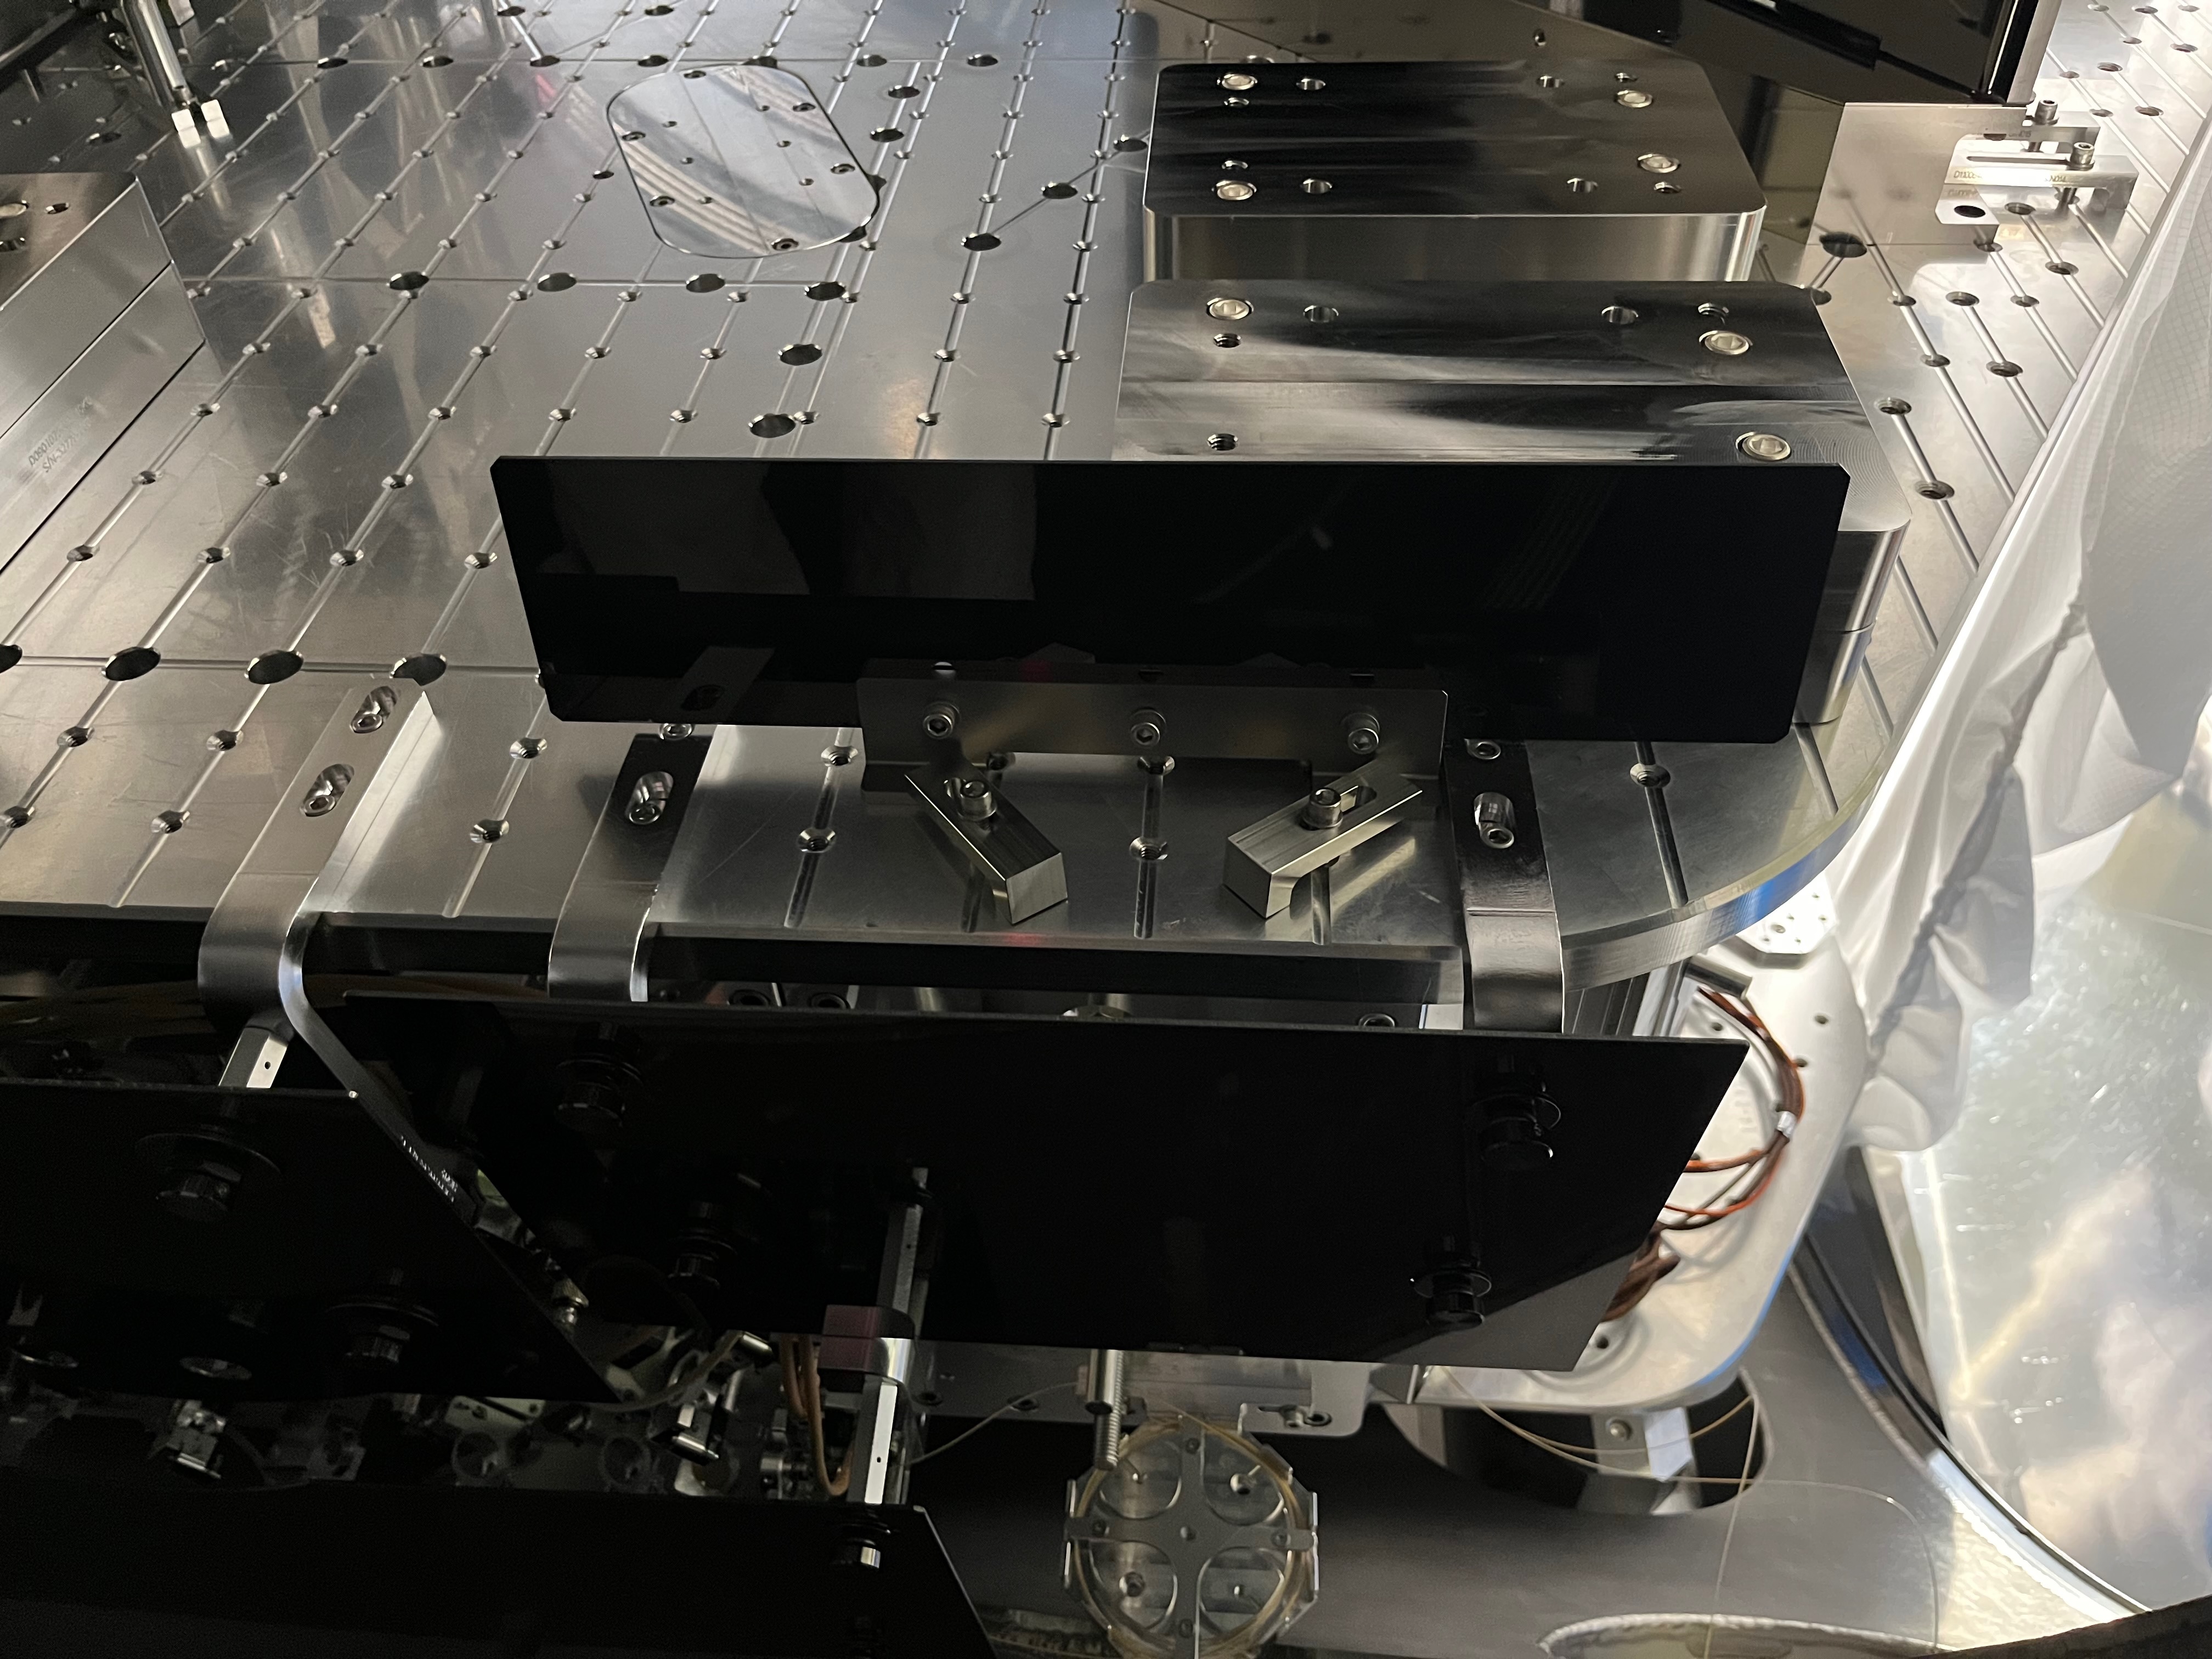
Below is the analysis for data taken on the FC path: between ZM1 and ZM2 and between ZM2 and ZM3, with Nanoscan, see Camilla's log 90573. As a reminder, ZM1 are flat optics, ZM2 is a PSAM with variable curvature, FC1 HR side is flat, AR side is curved with RoC ~1m.
The data suggest that the OPO mode is slightly different from O4 OPO, and also strongly suggest a new optimal ZM2 PSAM voltage can be found within the range.
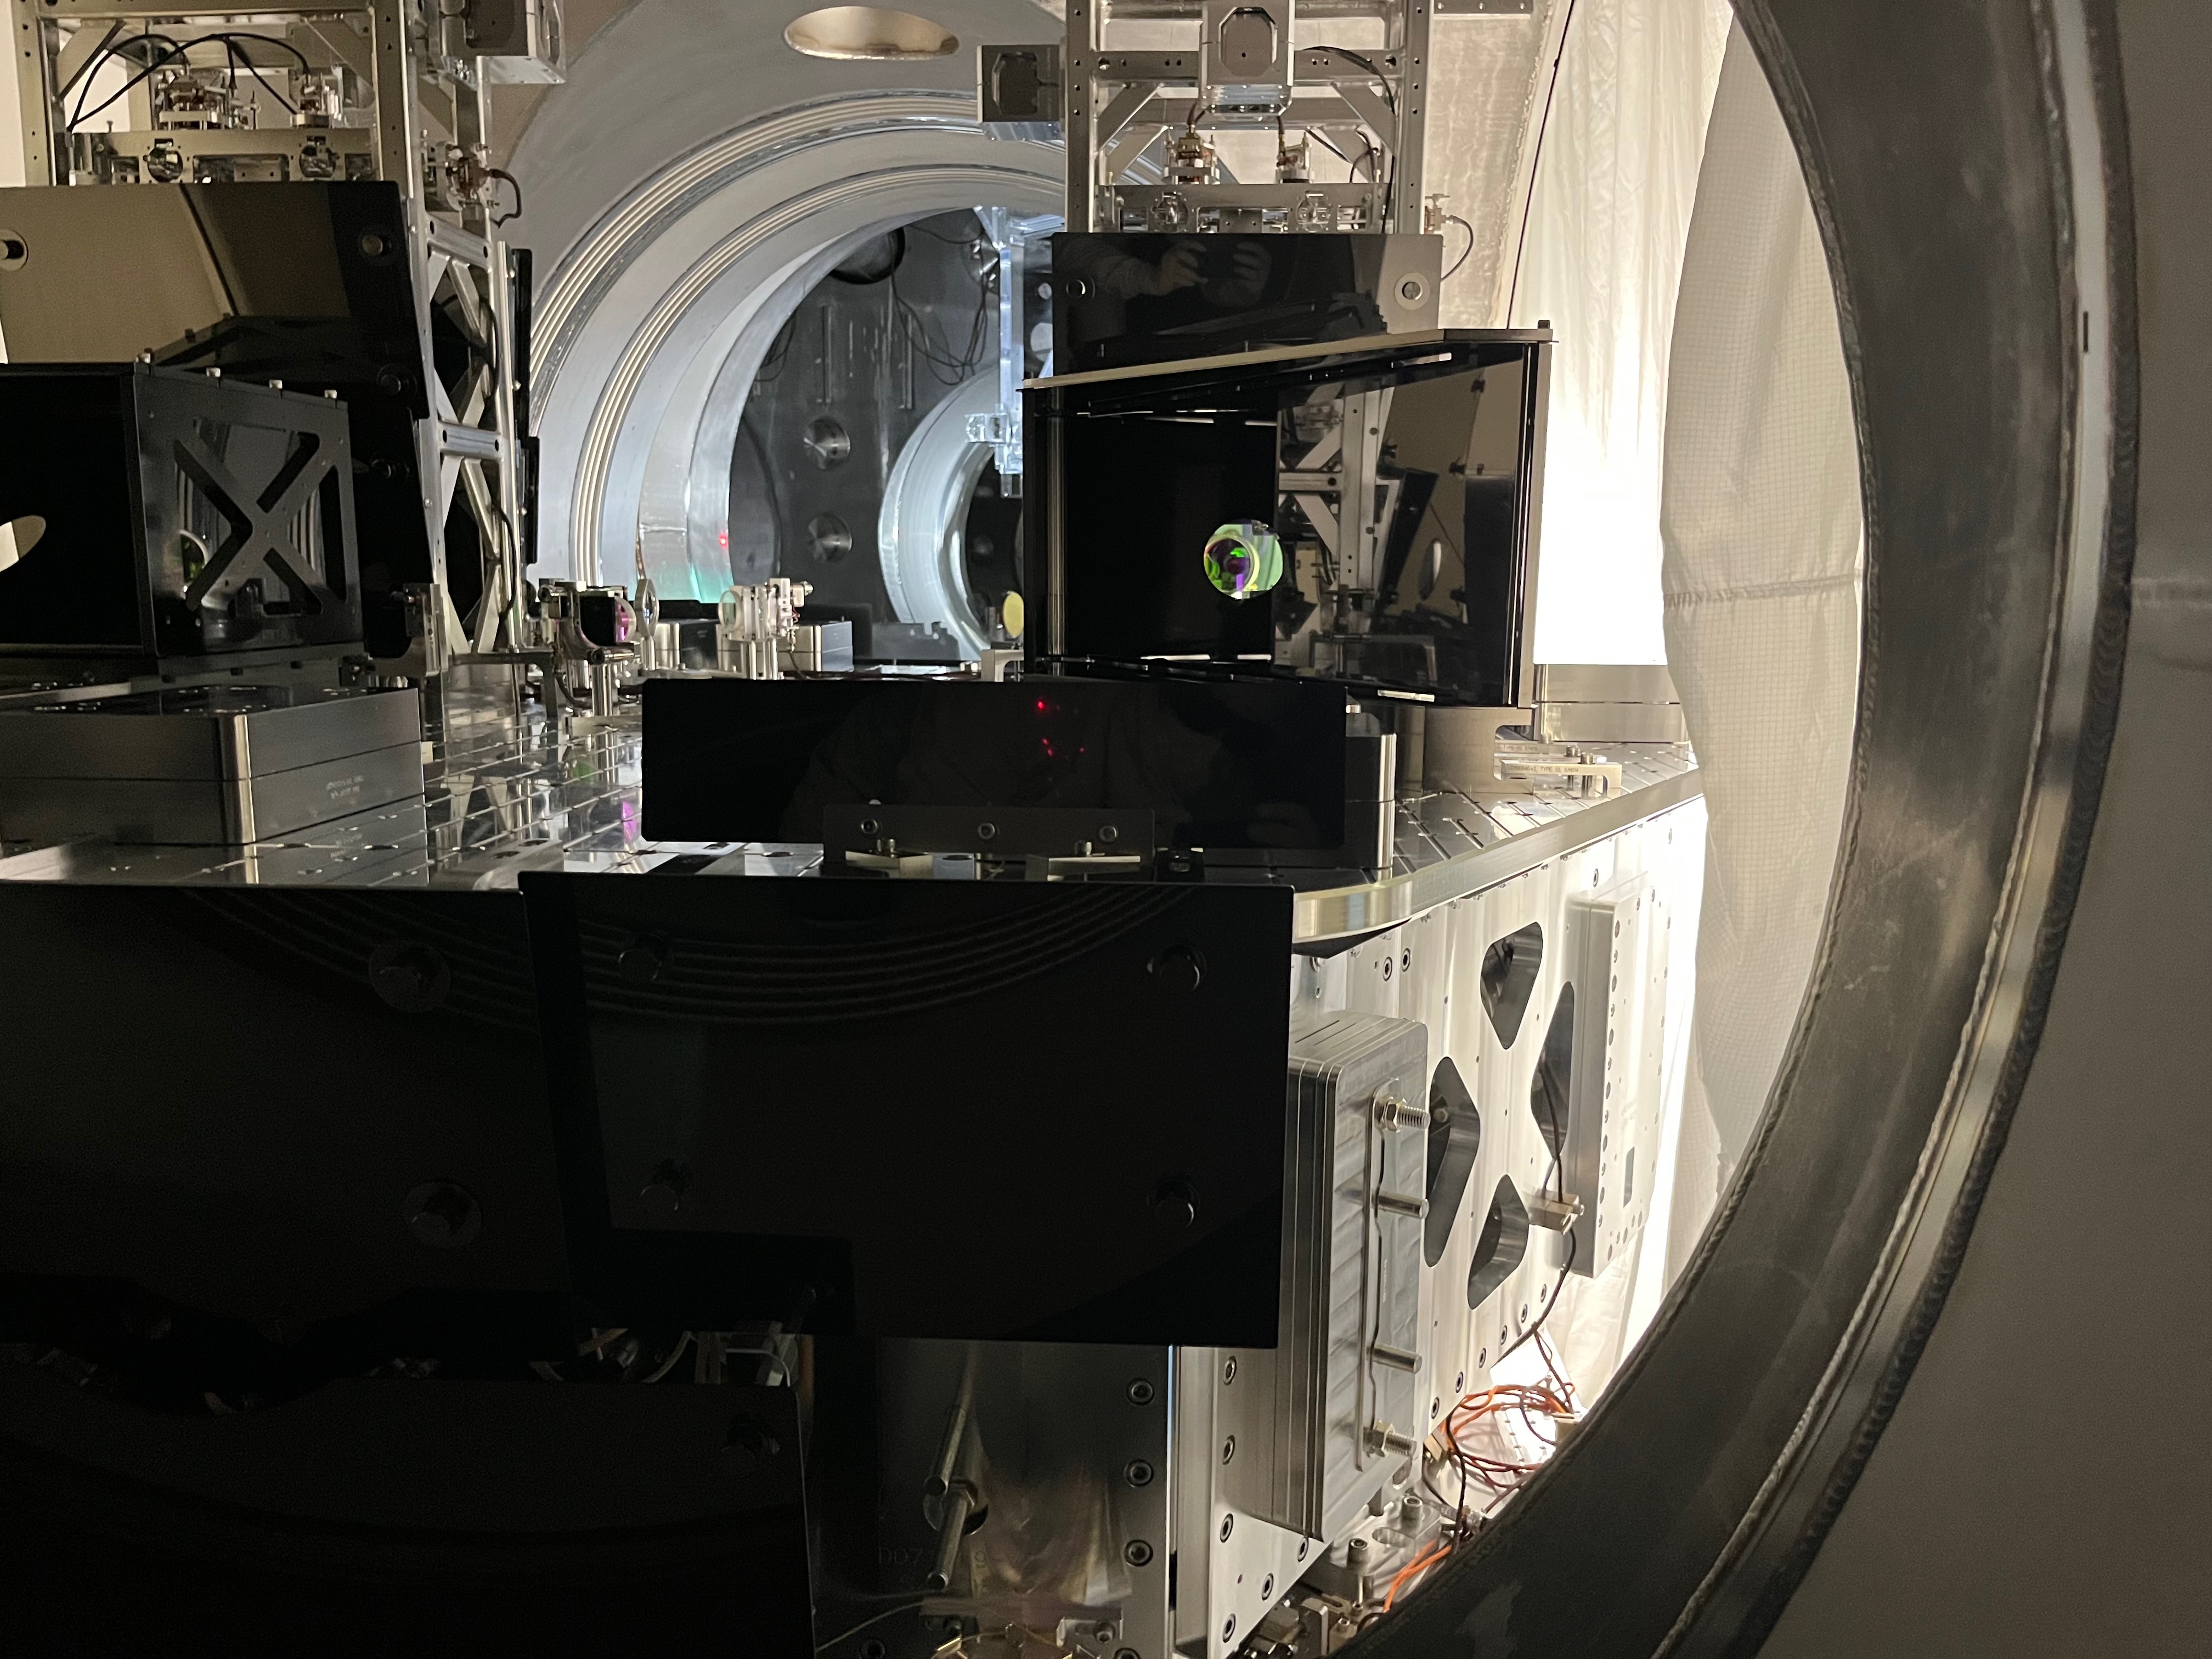
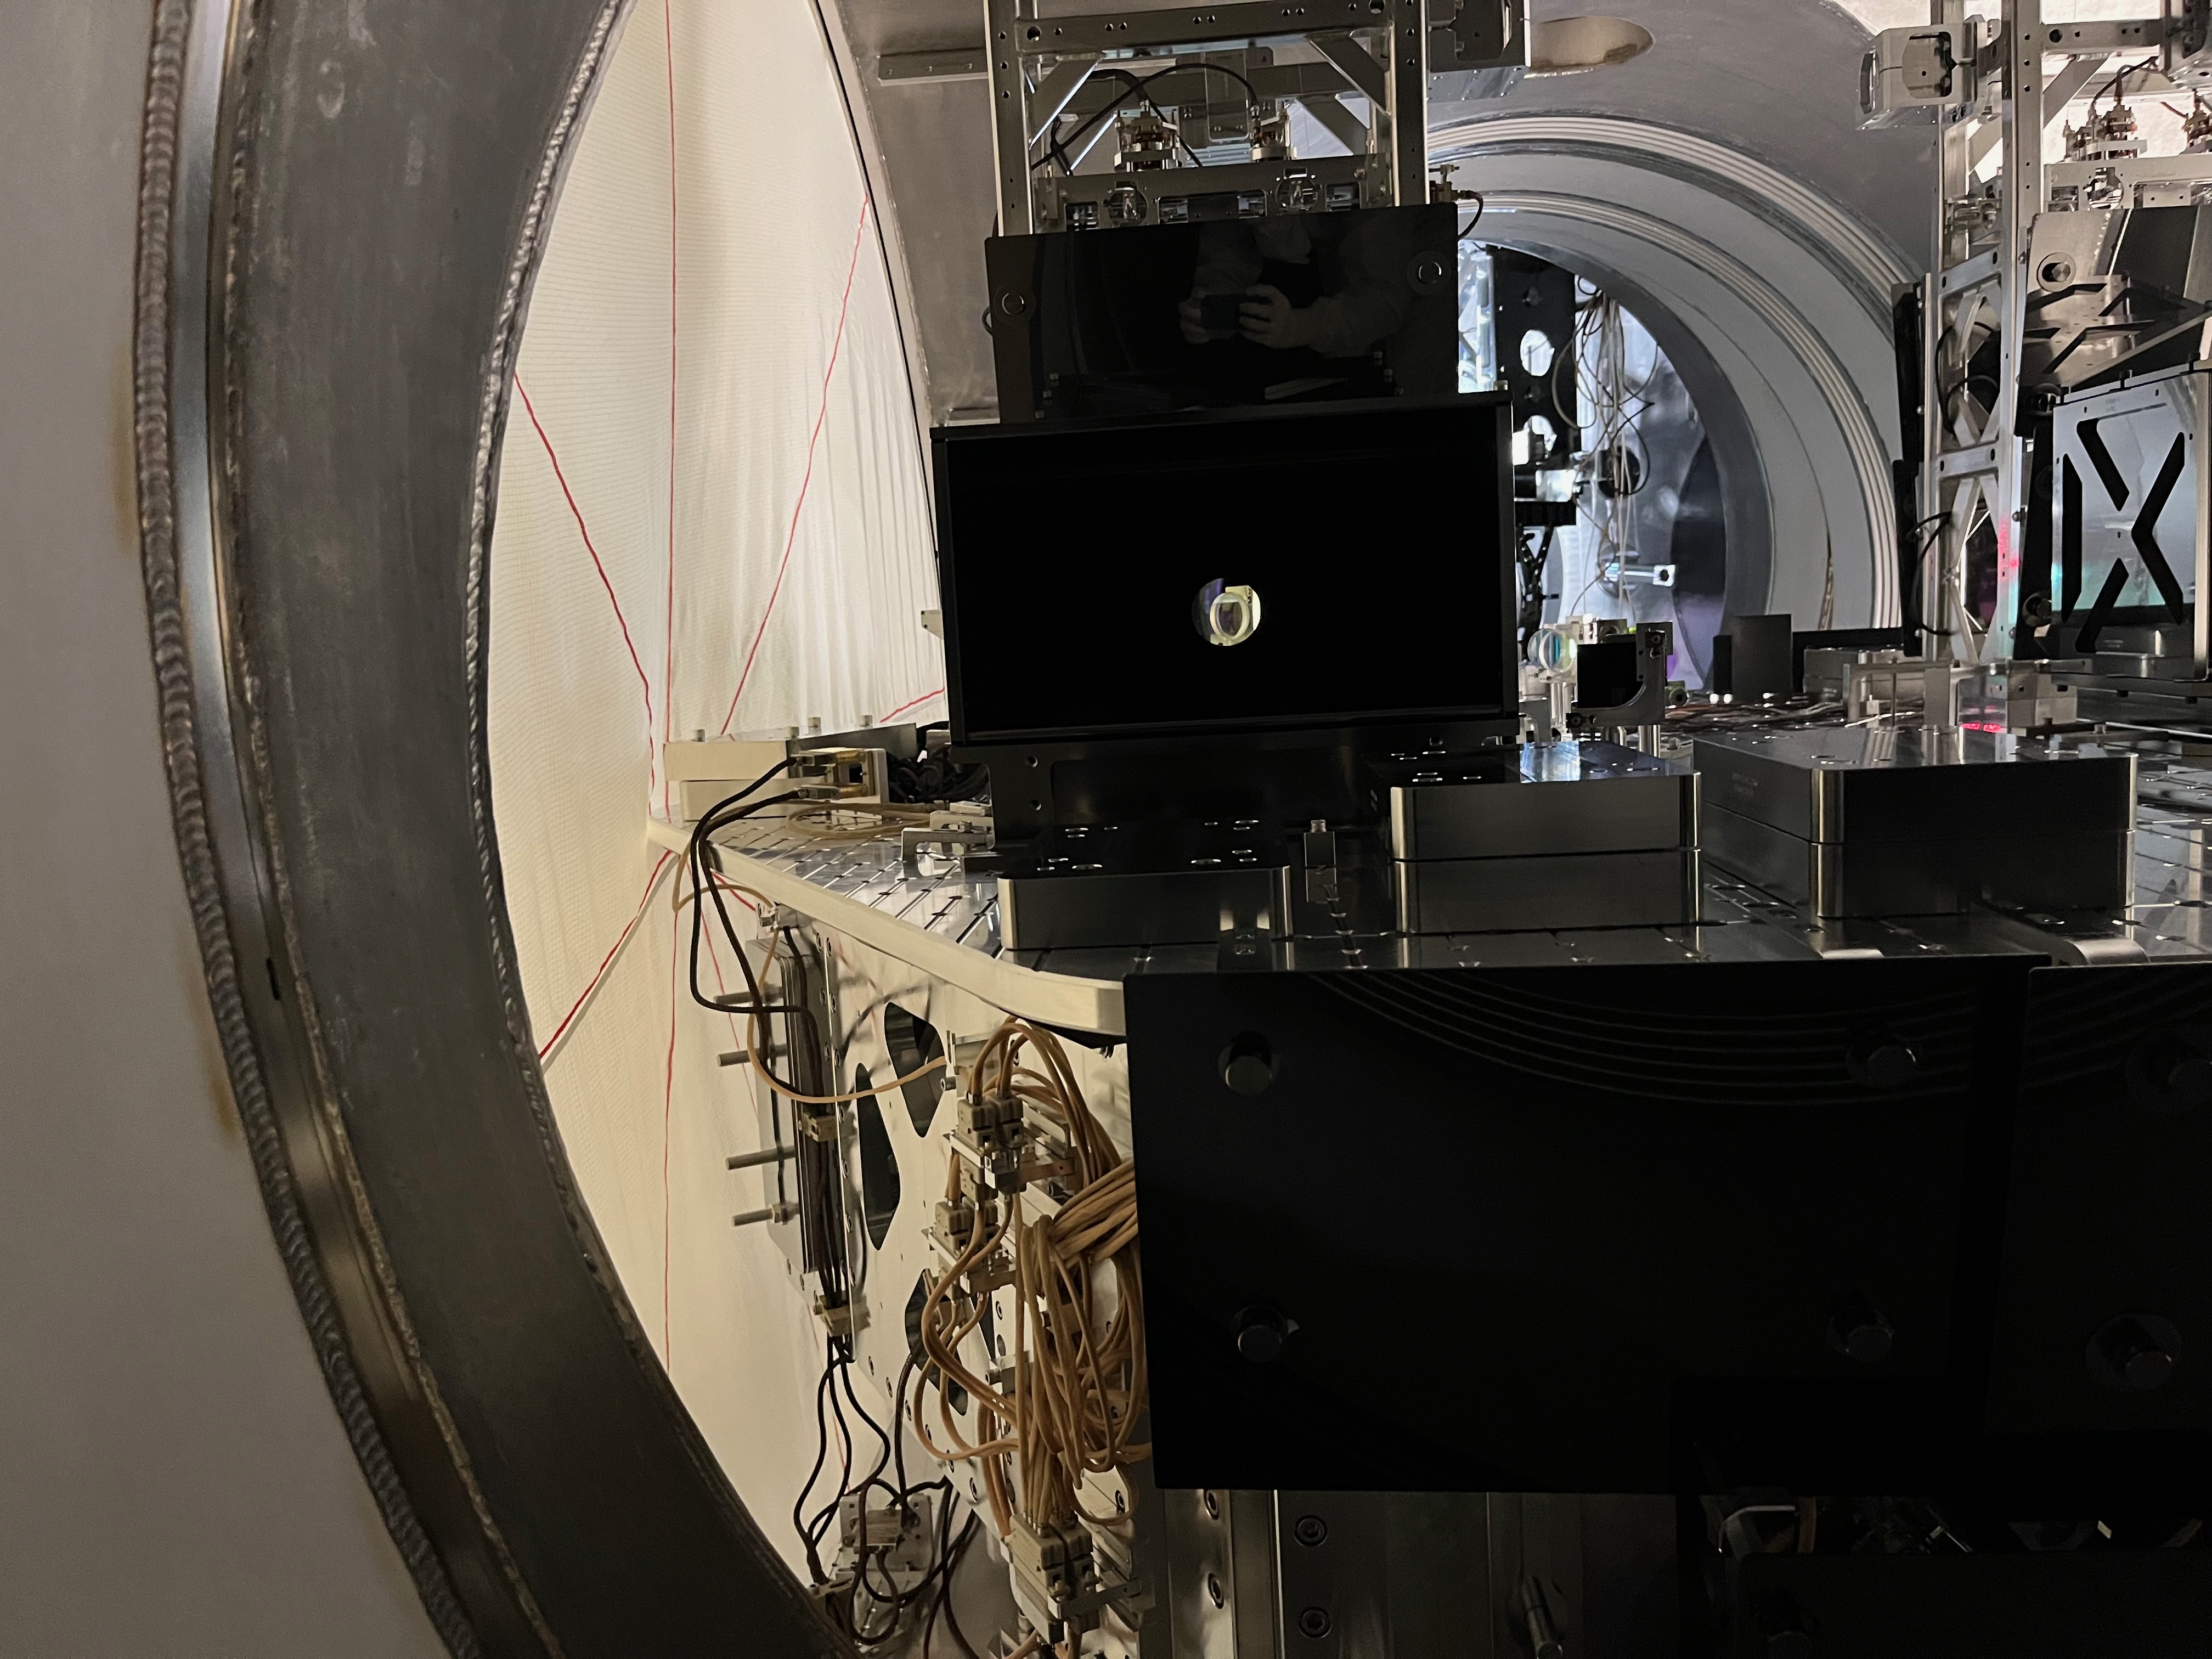
We measured the beam profile at 5 different points after ZM1 with A:L2 lens at its nominal 0 position (sled that the lens lives on is flush to its translation stage on both front and back edges). At the last point with A:L2 at 0, we realized it would be pertinent to measure beam profiles for the two extremities of the A:L2 translation stage: -13 mm, which is closer to ZM1 by 13 mm and +17 mm, which is 17 mm further from ZM1. We then proceeded to take 5 measurements (again downstream from ZM1) for each of these lens positions. The nanoscan screenshots for each measurement are attached in the .zip folder.
The attached gif shows the beam waist position estimation extracted from the beam profile scans downstream ZM1, for all three A:L2 positions. The "target" and "O4 x/y" come from Keita's log 59515. The overlap plot attached shows the field overlap in percentage for all three A:L2 positions, with target and O4 beam parameters. With A:L2@0, the overlaps are above 99%, which bodes well for the FC mode matching prospects. There could potentially be a better mode matching solution to the "target" or "O4" for A:L2 between 0 pos and -13mm pos. However, the following measurements betwen ZM2 and ZM3 suggest fine-tuning of A:L2 position will not be necessary.
We also measured beam profile between ZM2 and ZM3 for three different points, setting ZM2 PSAM voltage to 4 different values at each point. The "nominal" O4 strain gauge (S.G.) for ZM2 has been 3.15 V, which corresponds to ~ 60 or 90 V pzt supply voltage depending on which direction one scans from. The edges of the psam range are 0 V and 196 V, which corresponds to ~1.2-1.3 V and ~6.04 V S.G. respectively. In the interest of more uniform sampling of the available psam curvatures, we also chose to sample 4.5 V S.G. (~120 V or 150 V).
This table shows experimental data mapped to radii of curvature of the ZM2 mirror, using Camille's E2100298. The exact PZT strain gauge/ PZT supply voltage that gives a certain RoC is affected by the hysteresis curve i.e. sweep direction.
| Strain Gauge (V) |
PZT Supply Voltage (V) |
RoC (m) with increasing scan |
RoC (m) with decreasing scan |
| 1.3 V |
0 |
0.8211 |
0.82202 |
| 6.0x V |
196 |
0.8911 |
0.89114 |
| 3.1x V |
60 (d) or 90 (i) V |
0.8523 |
0.85025 |
| 4.4x V |
120 or 150 V |
0.87534 |
0.87242 |
Attached gif for propagation between FC1 and ZM2 show esimated beam parameters for all four SG cases: 1.3, 3.1x, 4.4x and 6.0x V. The exact values for the strain gauge varied from one beam profile position to the next, however it should be good enough to tell if we have enough range on ZM2 or not.
The gif switches between different SG values once every 2 second, the lefthand plot is useful in looking at the beam divergence near FC1 while the righthand plot is a zoom-in around the beam waist. Looking at the estimated beam waist position for 1.3 V and 3.1x V cases switching across the "FC x/y waist", "VOPO target waist", ''O4 x/y waist", we can guess there could be a better mode matching solution between these two SG values. "FC x/y waist" comes from the Finesse eigenmode solution for the FC path (thanks Kevin Kuns!), target and O4 values are the same from the above-mentioned Keita log, assuming ZM2 curvature to be 0.85025 m (3.15V SG), and the following distances between the optics: A:M3 --> ZM1: 158.2 mm, ZM1--> ZM2: 1498.625 mm, ZM2 --> ZM3: 1821.497 mm, ZM3--> FC1: 1000.261 mm. Camilla extracted these distance values from D1900365-v1.
Knowing the applied PZT voltage and the corresponding RoC, we can use the measurements at 3.1x V and 1.3 V to estimate the mode matching we would obtain if we swept the RoC between that of these strain gauge values. The attached FC mode matching projection plot is computed by taking beam parameter estimated from the beam size measurements for 3.1x V, propagates the beam back to ZM2, unapplies the estimated RoC (decreasing RoC value was used informed by data, indicated in bold in the above table), then reapplies the RoC between these two values, after the overlap with the FC eigenmode is calculated. This projection suggests that mode-matching points with >99% overlap for both x and y axes are accessible. Clearly, there is varying astigmatism with strain gauge setting, see beam profile plots where 3.1x and 6.0x V shows beams with smaller astig. than the other two points. Since the PSAM characterization data gives only a single RoC number rather than separate x/y effective curvatures, the projection should be interpreted as approximate. In practice, the final optimization should be done empirically.
The effect of the astigmatism is also apparent in this defocus vs beam size at FC1 plot that shows mode matching contours. The calculation is made at the FC1.p2.o plane in Finesse.


We did use the long 27m patch fiber for chamberside testing, and it worked well.
There is an other 5m PM fiber on the cart nearby you can use to verify if it's a problem with the connector or the fiber itself.
I would also inspect the fiber ferrules of the long fiber with a fiber microscope to check for damages.