ryan.crouch@LIGO.ORG - posted 16:30, Thursday 12 February 2026 (89135)
OPS Thursday Day shift summary
TITLE: 02/12 Day Shift: 1530-0030 UTC (0730-1630 PST), all times posted in UTC
STATE of H1: Planned Engineering
INCOMING OPERATOR: None
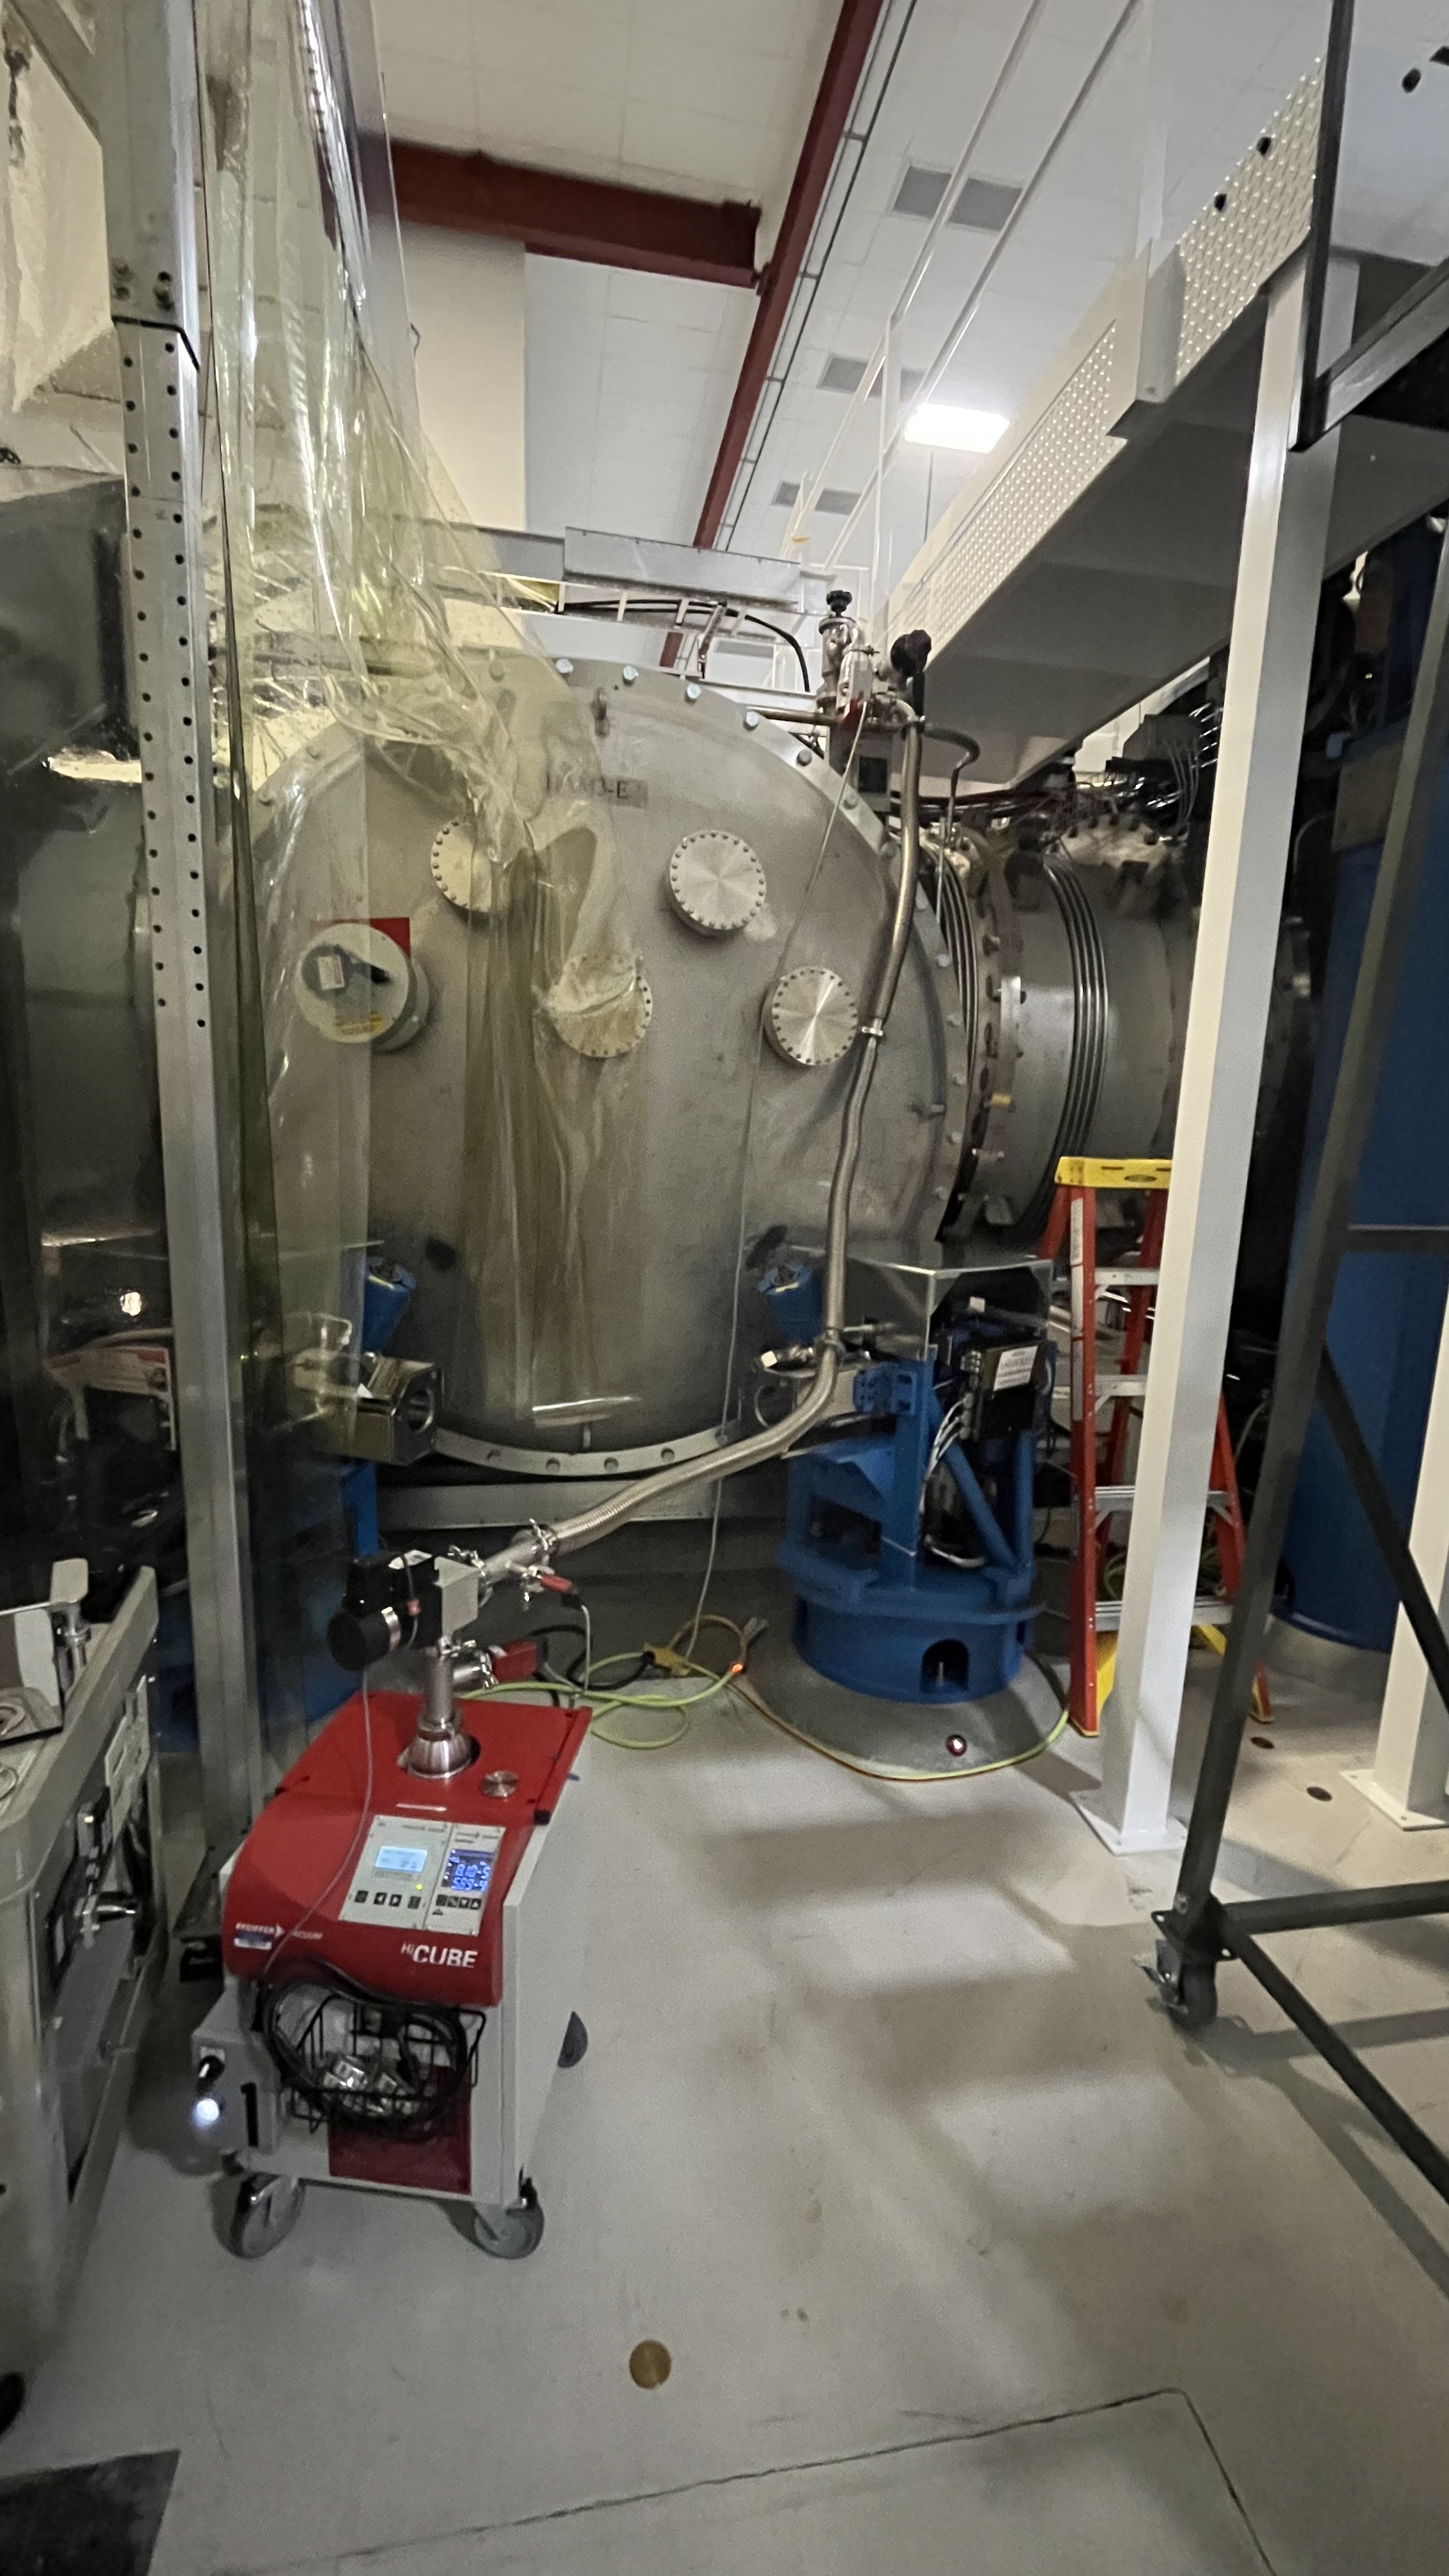
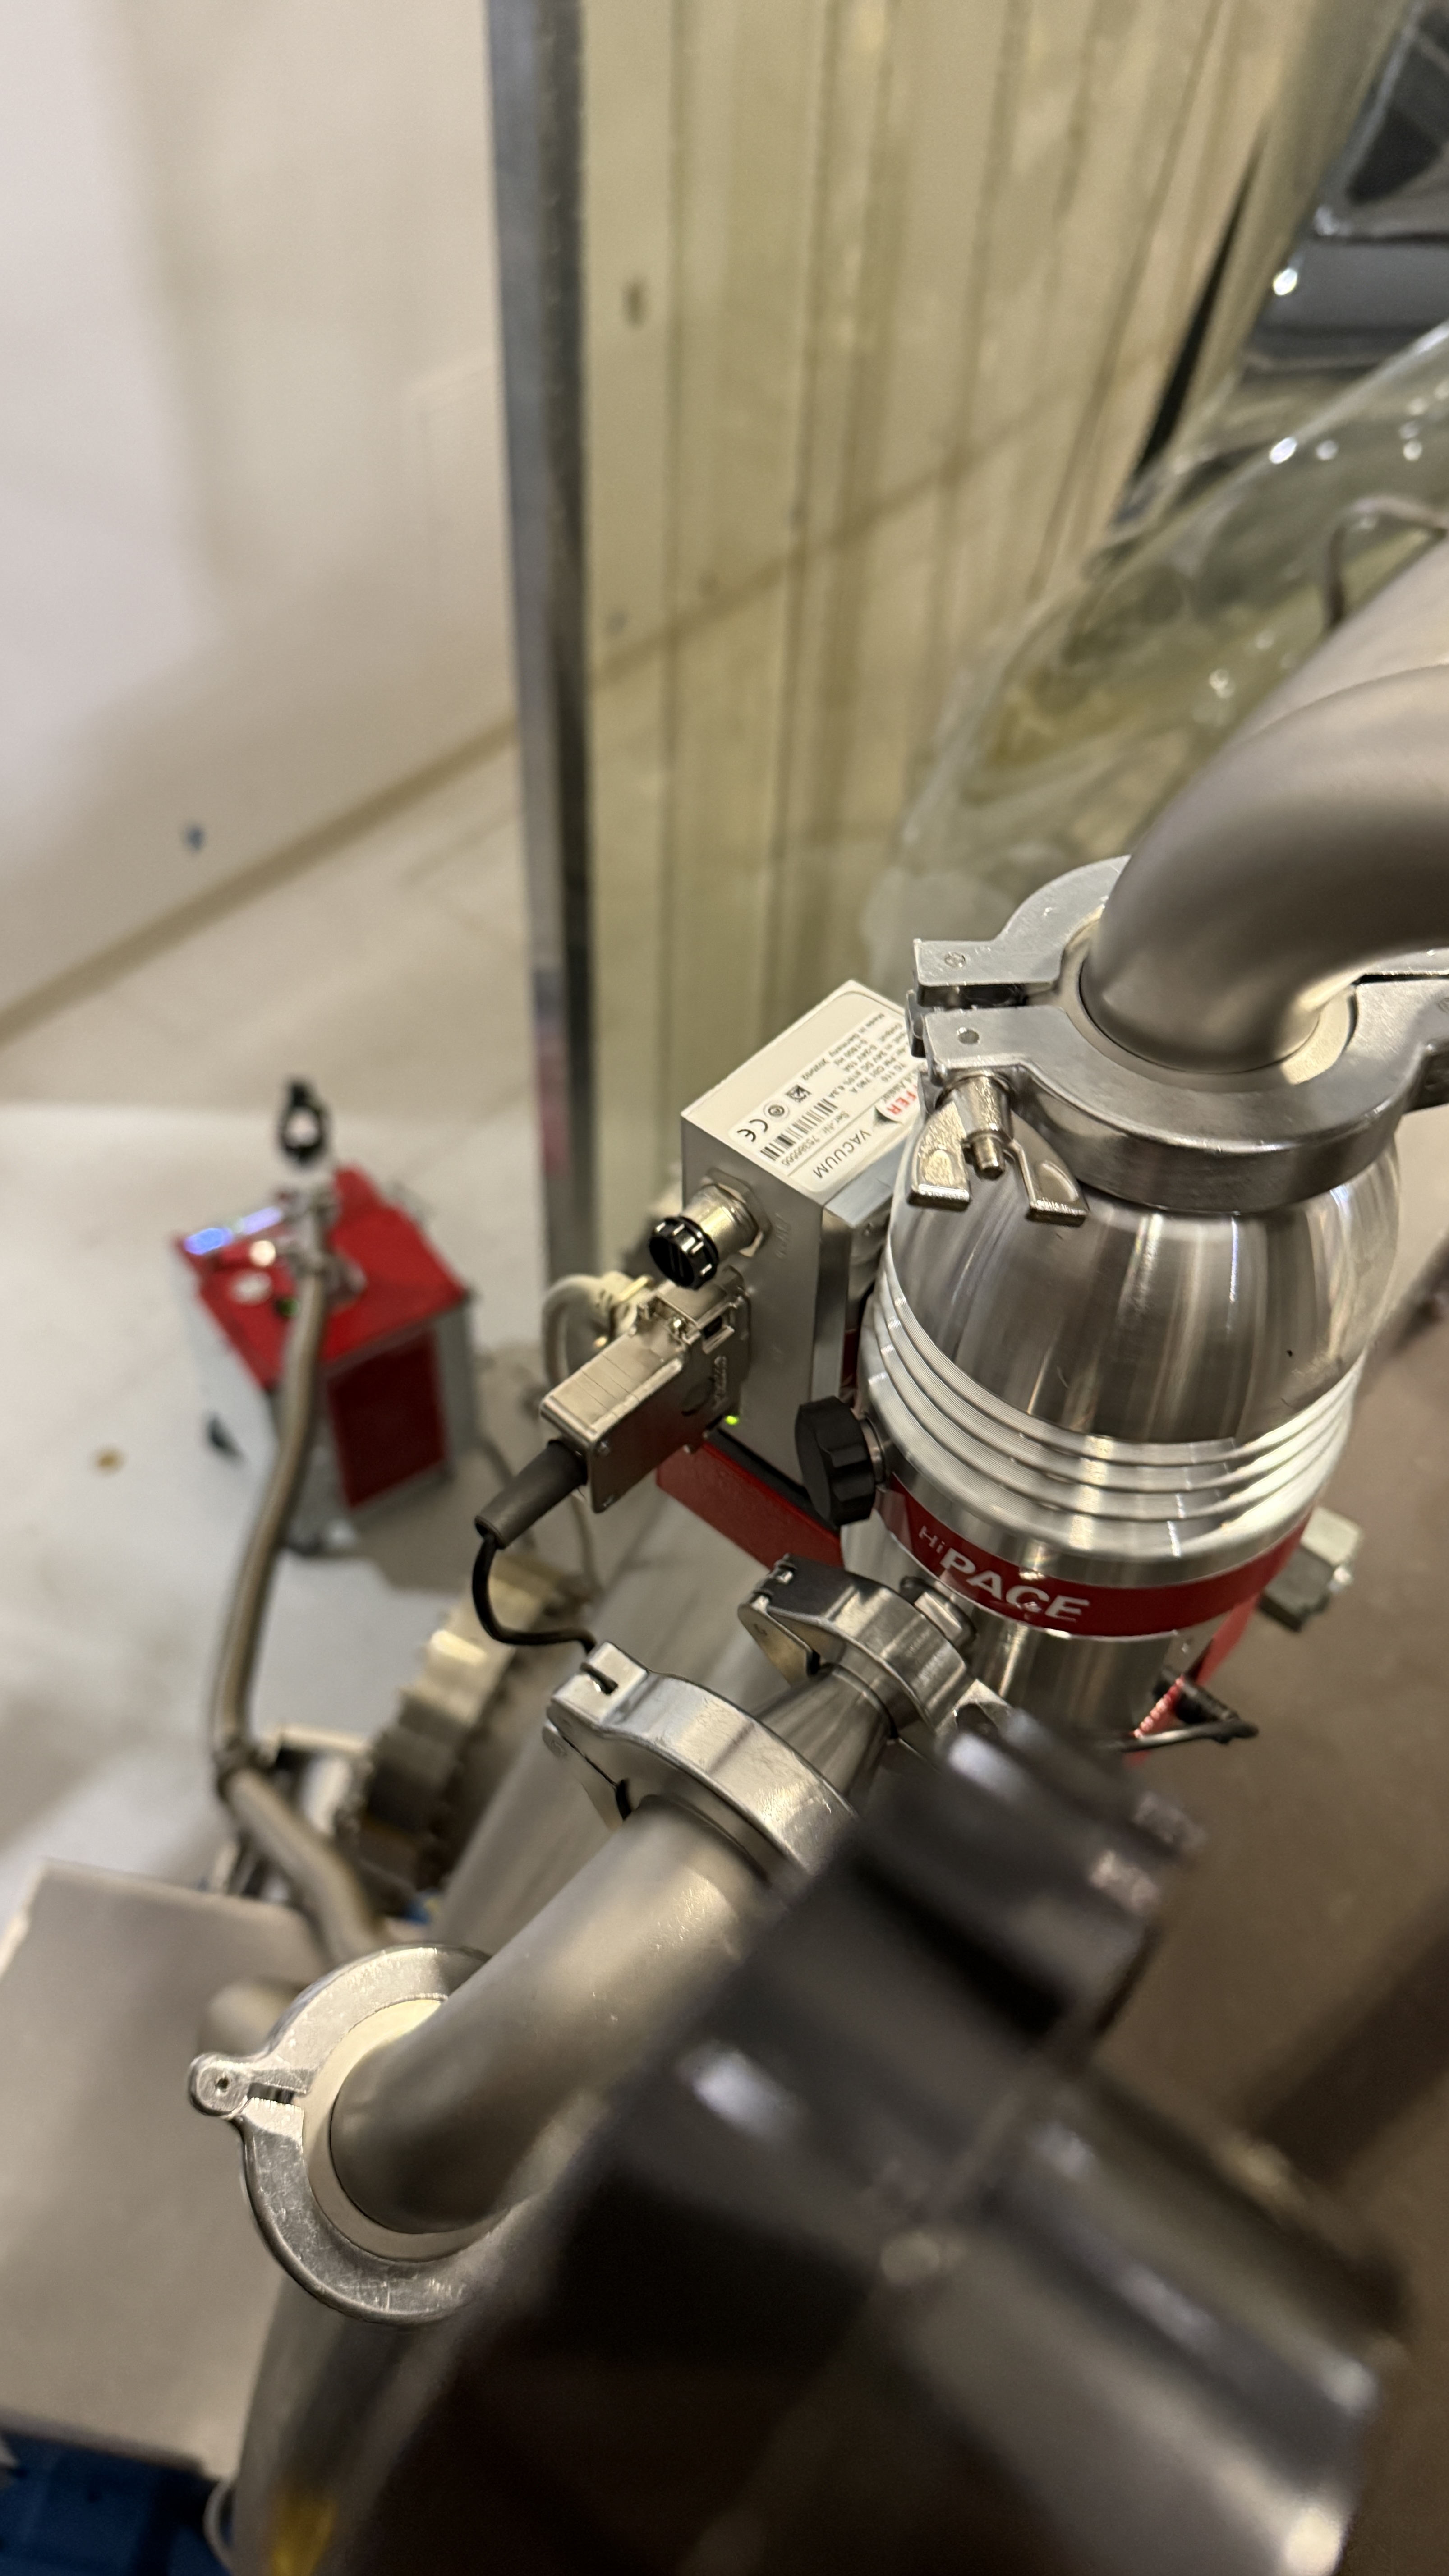
SHIFT SUMMARY: Dave did some CDS restarts early in the day, alog89133, and alog89130 and again at the end of the day. Secondary microseism has gone up quite a lot in the past 9 hours, presumably from the 10.5m (windy.com) waves crashing into the Juneau/Ketchikan area north of Washington state. VAC team left an AUX cart pumping down by HAM4. HAM1 alignment and EOM crystal work continued today.
LOG:
| Start Time | System | Name | Location | Lazer_Haz | Task | Time End |
|---|---|---|---|---|---|---|
| 22:49 | SAF | LVEA is Laser SAFE | LVEA | NO* | LVEA is Laser SAFE *BIFURCATED HAM1/2 | 16:49 |
| 16:17 | FAC | Kim | LVEA | N* | Tech clean | 17:51 |
| 17:14 | EE | Marc, FIl | MSR, Mez, LVEA | N* | Cable pulling for BHD | 00:01 |
| 17:18 | FAC | Mitch | LVEA | N* | Checks | 17:35 |
| 17:22 | FAC | Richard | LVEA | N* | BSC2, HAM3/4 area checks | 17:35 |
| 17:24 | ISC | Jason | LVEA | Y | HAM1 JAC work | 18:50 |
| 17:27 | ISC | Keita | LVEA | Y | HAM1 | 18:55 |
| 17:33 | ISC | Jennie | LVEA | Y | HAM1 work | 20:08 |
| 17:58 | FAC | Randy | LVEA | N* | Talk to Fil and Marc | 19:02 |
| 18:14 | FAC | Richard | LVEA | N | BSCs 1,2,3 checks | 18:50 |
| 18:15 | FAC | Kim | EndY | N | Restock garb | 18:15 |
| 18:39 | ISC | Betsy | Optics lab then HAM1 | N, Y | Check in with crew, parts dropoff | 20:08 |
| 18:53 | VAC | Gerardo, Jordan | HAM4/5 | N* | Swap ion pump, Gerardo out at 1930 back in 2000 | 20:18 |
| 18:55 | ISC | Camilla | LVEA | Y | HAM1 | 20:04 |
| 18:56 | ISC | Keita, Elenna | Optics lab | N | EOM, Keita out 2022 | 20:20 |
| 18:56 | ISC | Camilla | Optics lab | N | eom | 18:56 |
| 19:34 | VAC | Travis | LVEA | N* | Talk to VAC crew | 19:43 |
| 19:53 | VAC | Travis | LVEA | Y | Help swap pump | 20:18 |
| 21:02 | FAC | Randy | LVEA | N* | BSC2 platform work, height laser hazard | 21:40 |
| 21:04 | ISC | Keita, Elenna | Optics lab | N | EOM | 23:00 |
| 21:29 | VAC | Jordan | LVEA | Y | HAM4/5 pump work | 22:32 |
| 21:31 | VAC | Gerardo | LVEA | Y | Join Jordan | 22:32 |
| 21:44 | SQZ | Camilla | LVEA | N* | SQZ bay | 22:00 |
| 22:05 | ISC | Jason, Jennie | LVEA | Y | HAM1 work, Jennie out 23:30 | Ongoing |
| 22:20 | SQZ | Sheila, Camilla | Optics lab | N | Checks, Sheila out at 23:08 | 23:35 |
| 22:34 | PEM | Robert | EndX | N | Ground work, back to CS at 00:00 then back out | Ongoing |
| 22:36 | ISC | Betsy | Optics lab, HAM1 | N/Y | Parts, help teams out | 23:55 |
| 23:00 | ISC | Keita, Elenna | LVEA | Y | HAM1 in at 23:00, Elenna out 00:22 | 01:09 |


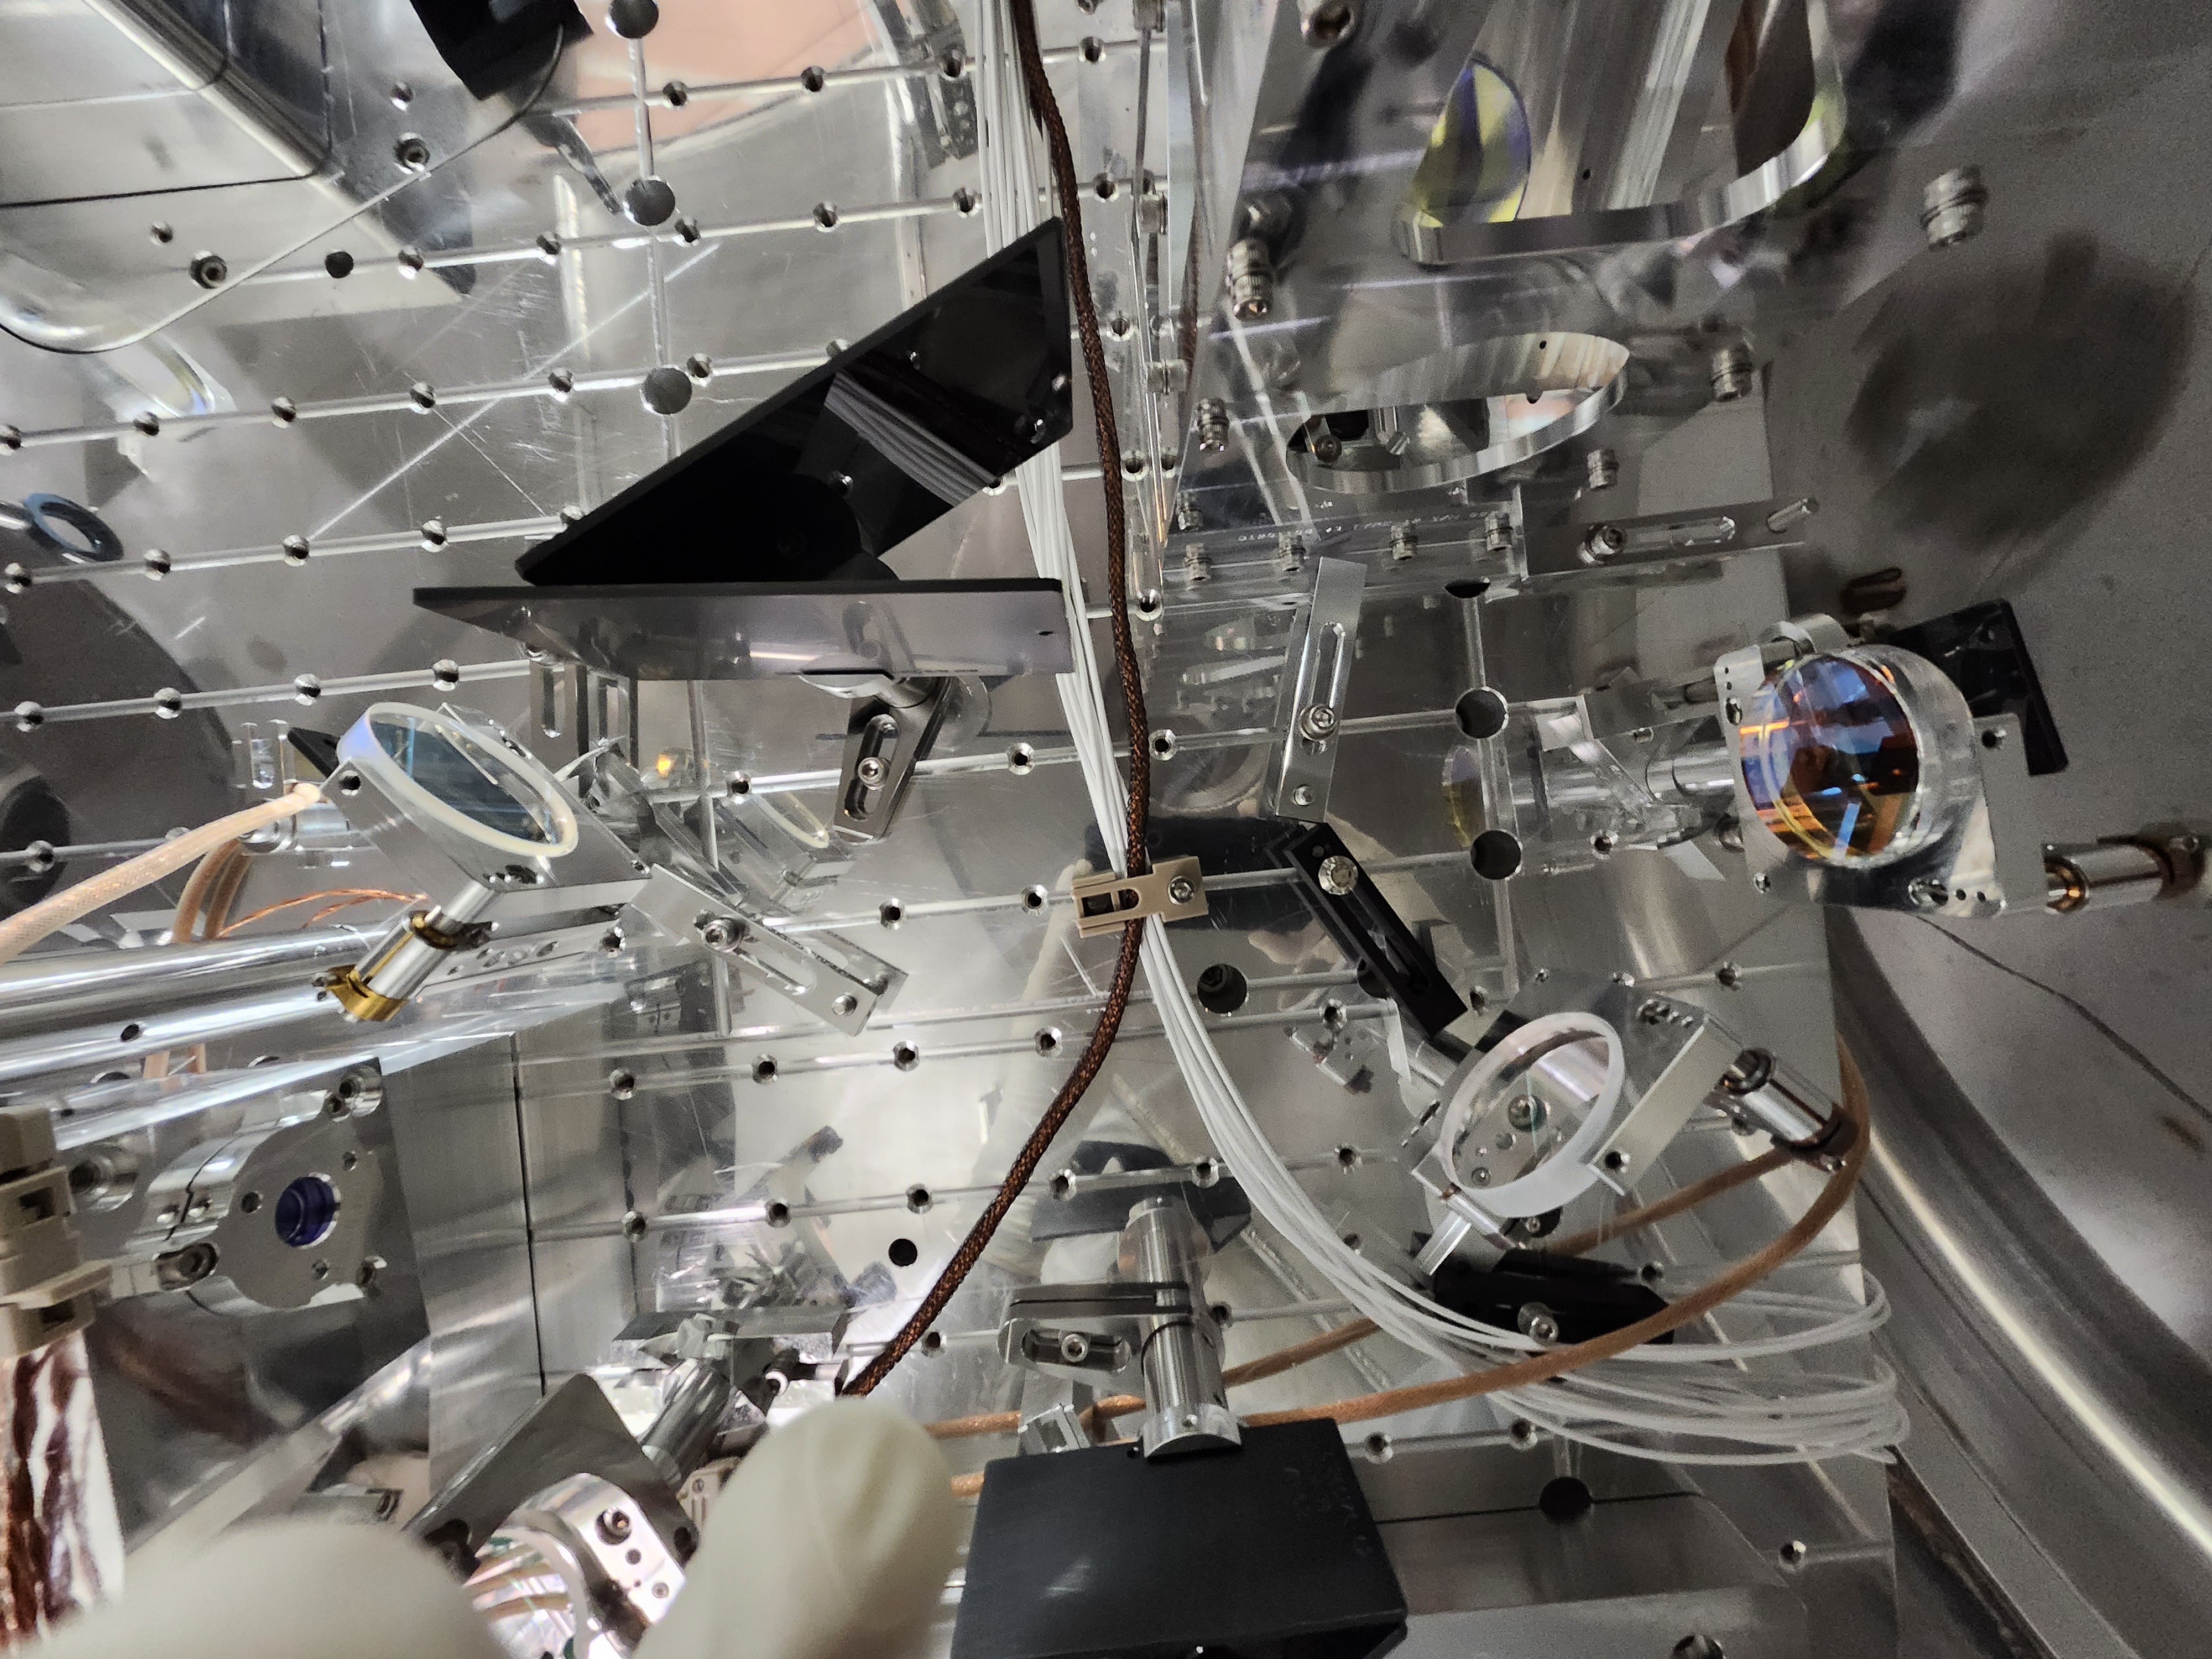
EOM crystal was swapped, EOM was tuned in the lab and put back in place in HAM1. Tuning is good. First look at the beam looks good, no ghosts.
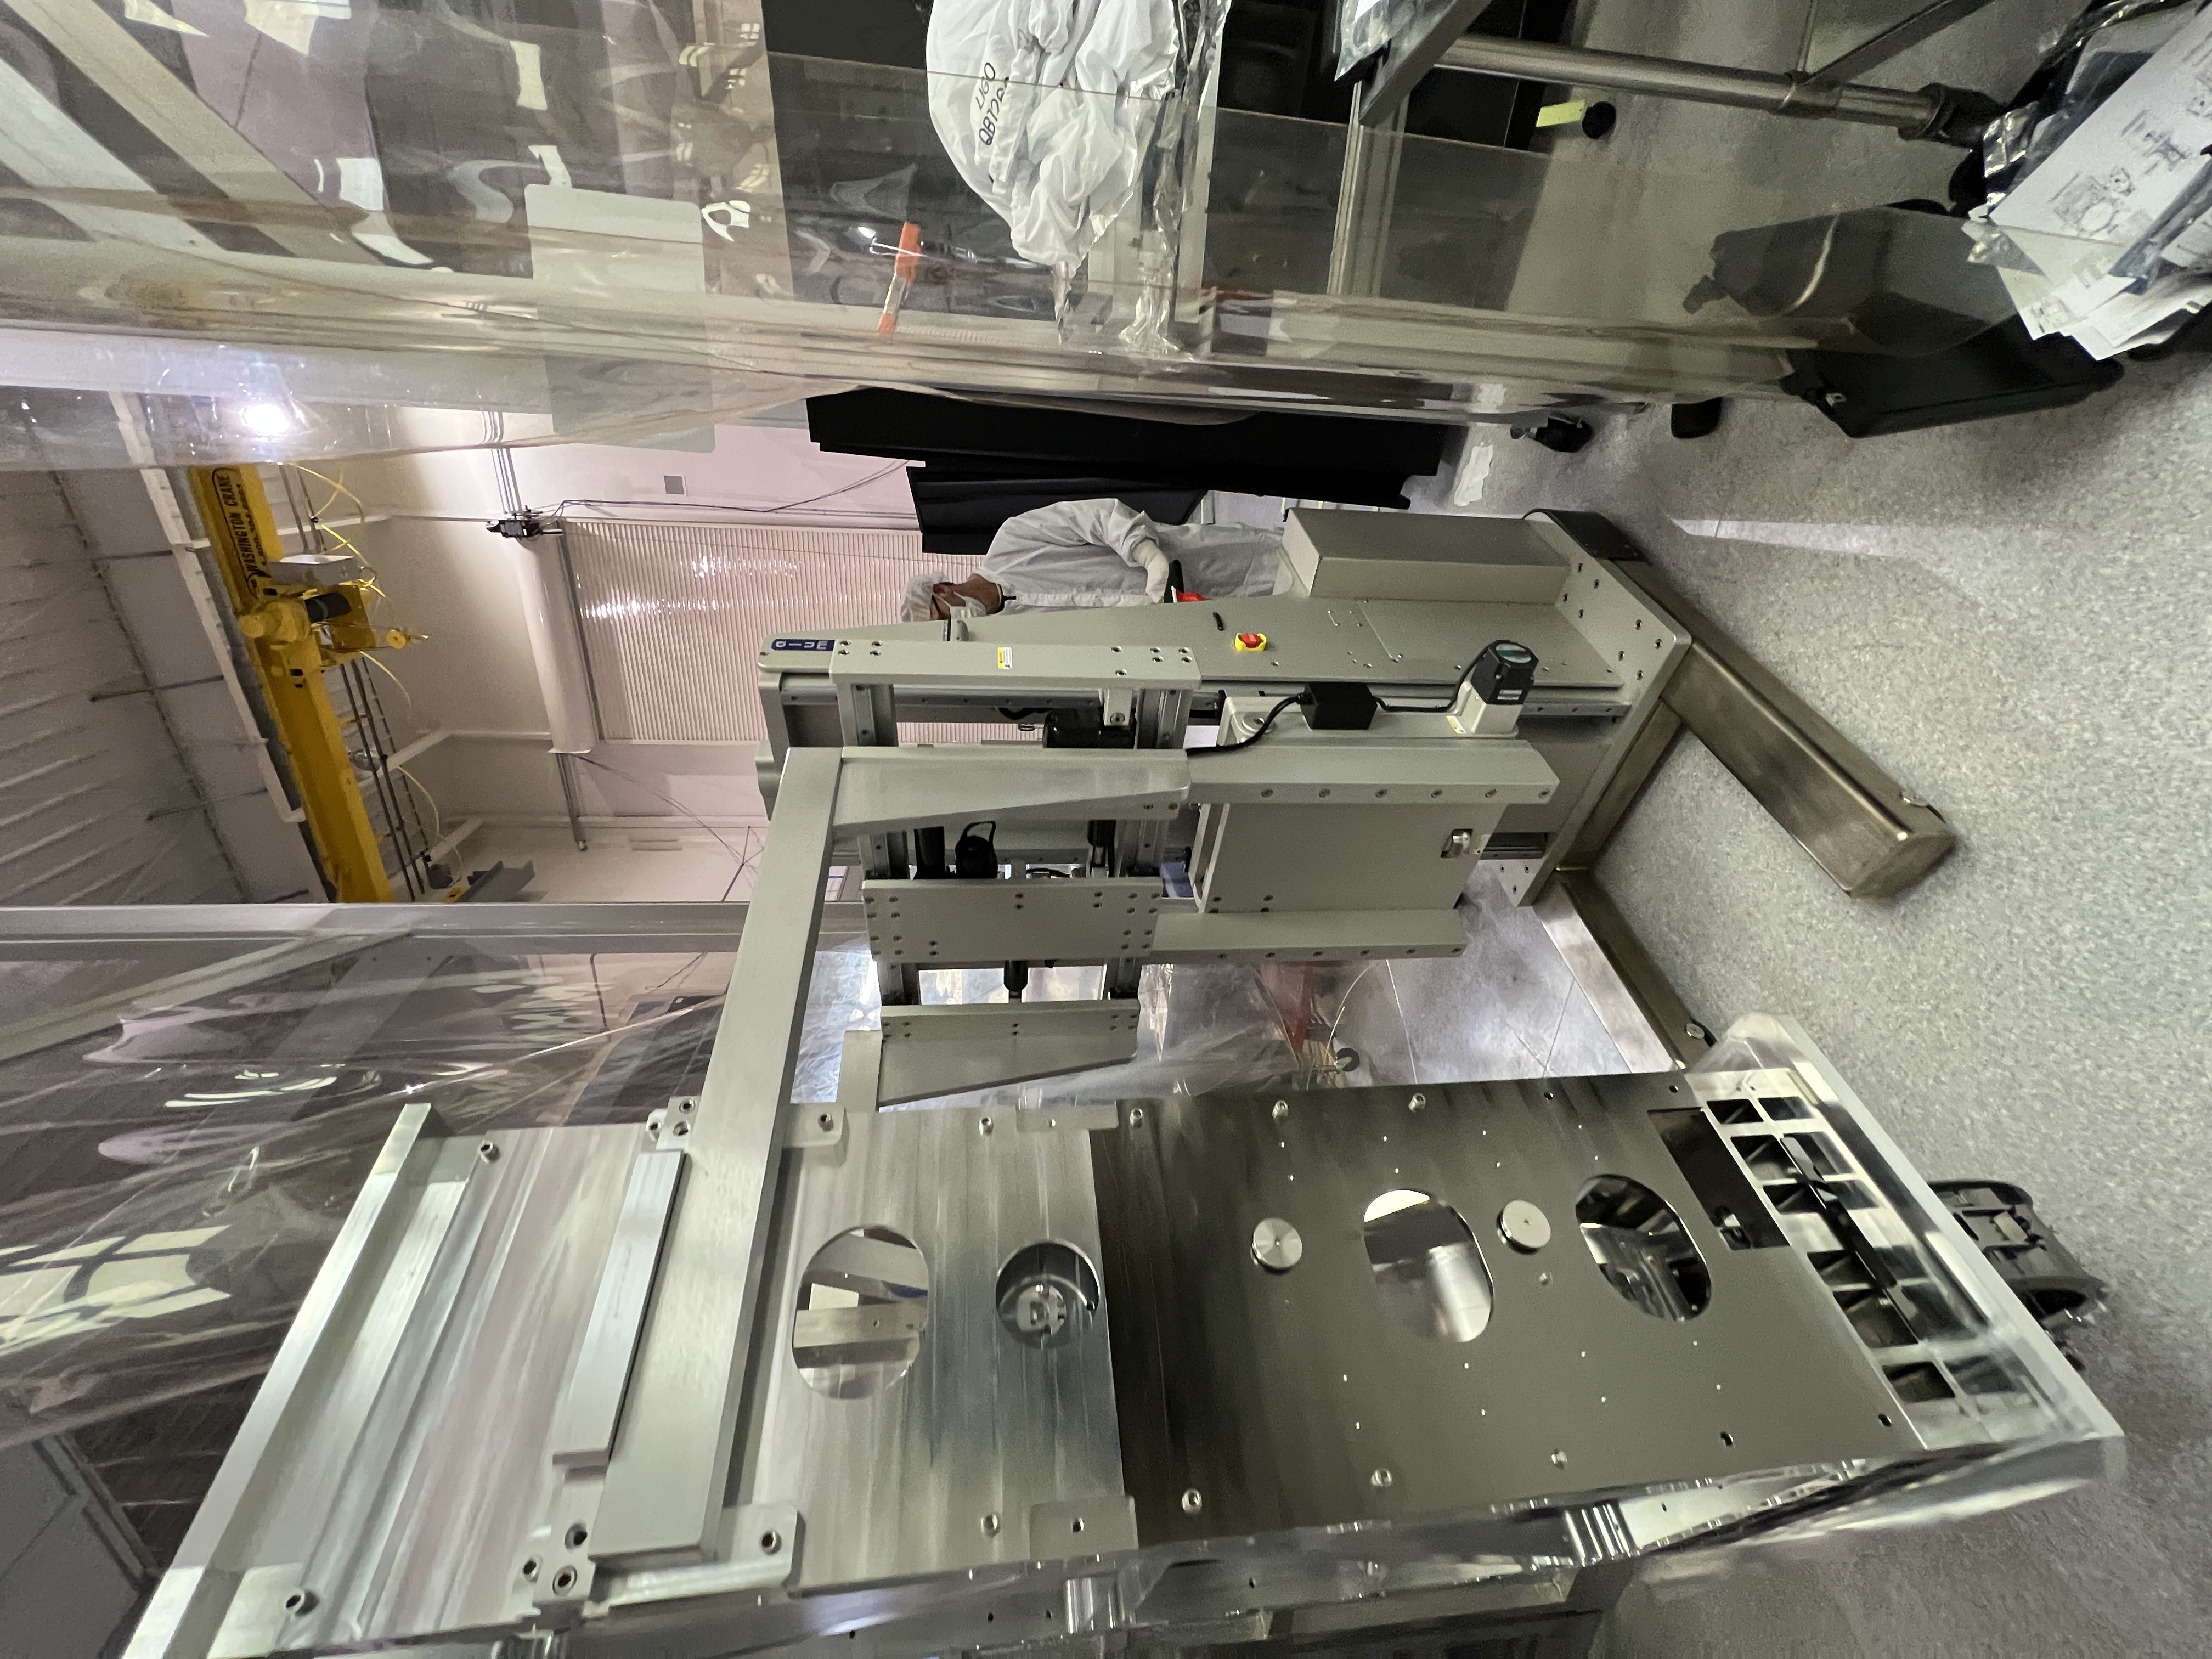
We extracted the EOM from HAM1 after the position of the EOM base was marked with three dog clamps.
In the lab, the EOM pivot plate was separated from the EOM base (which was a major pain again), then the EOM top structure was separated from the pivot plate.
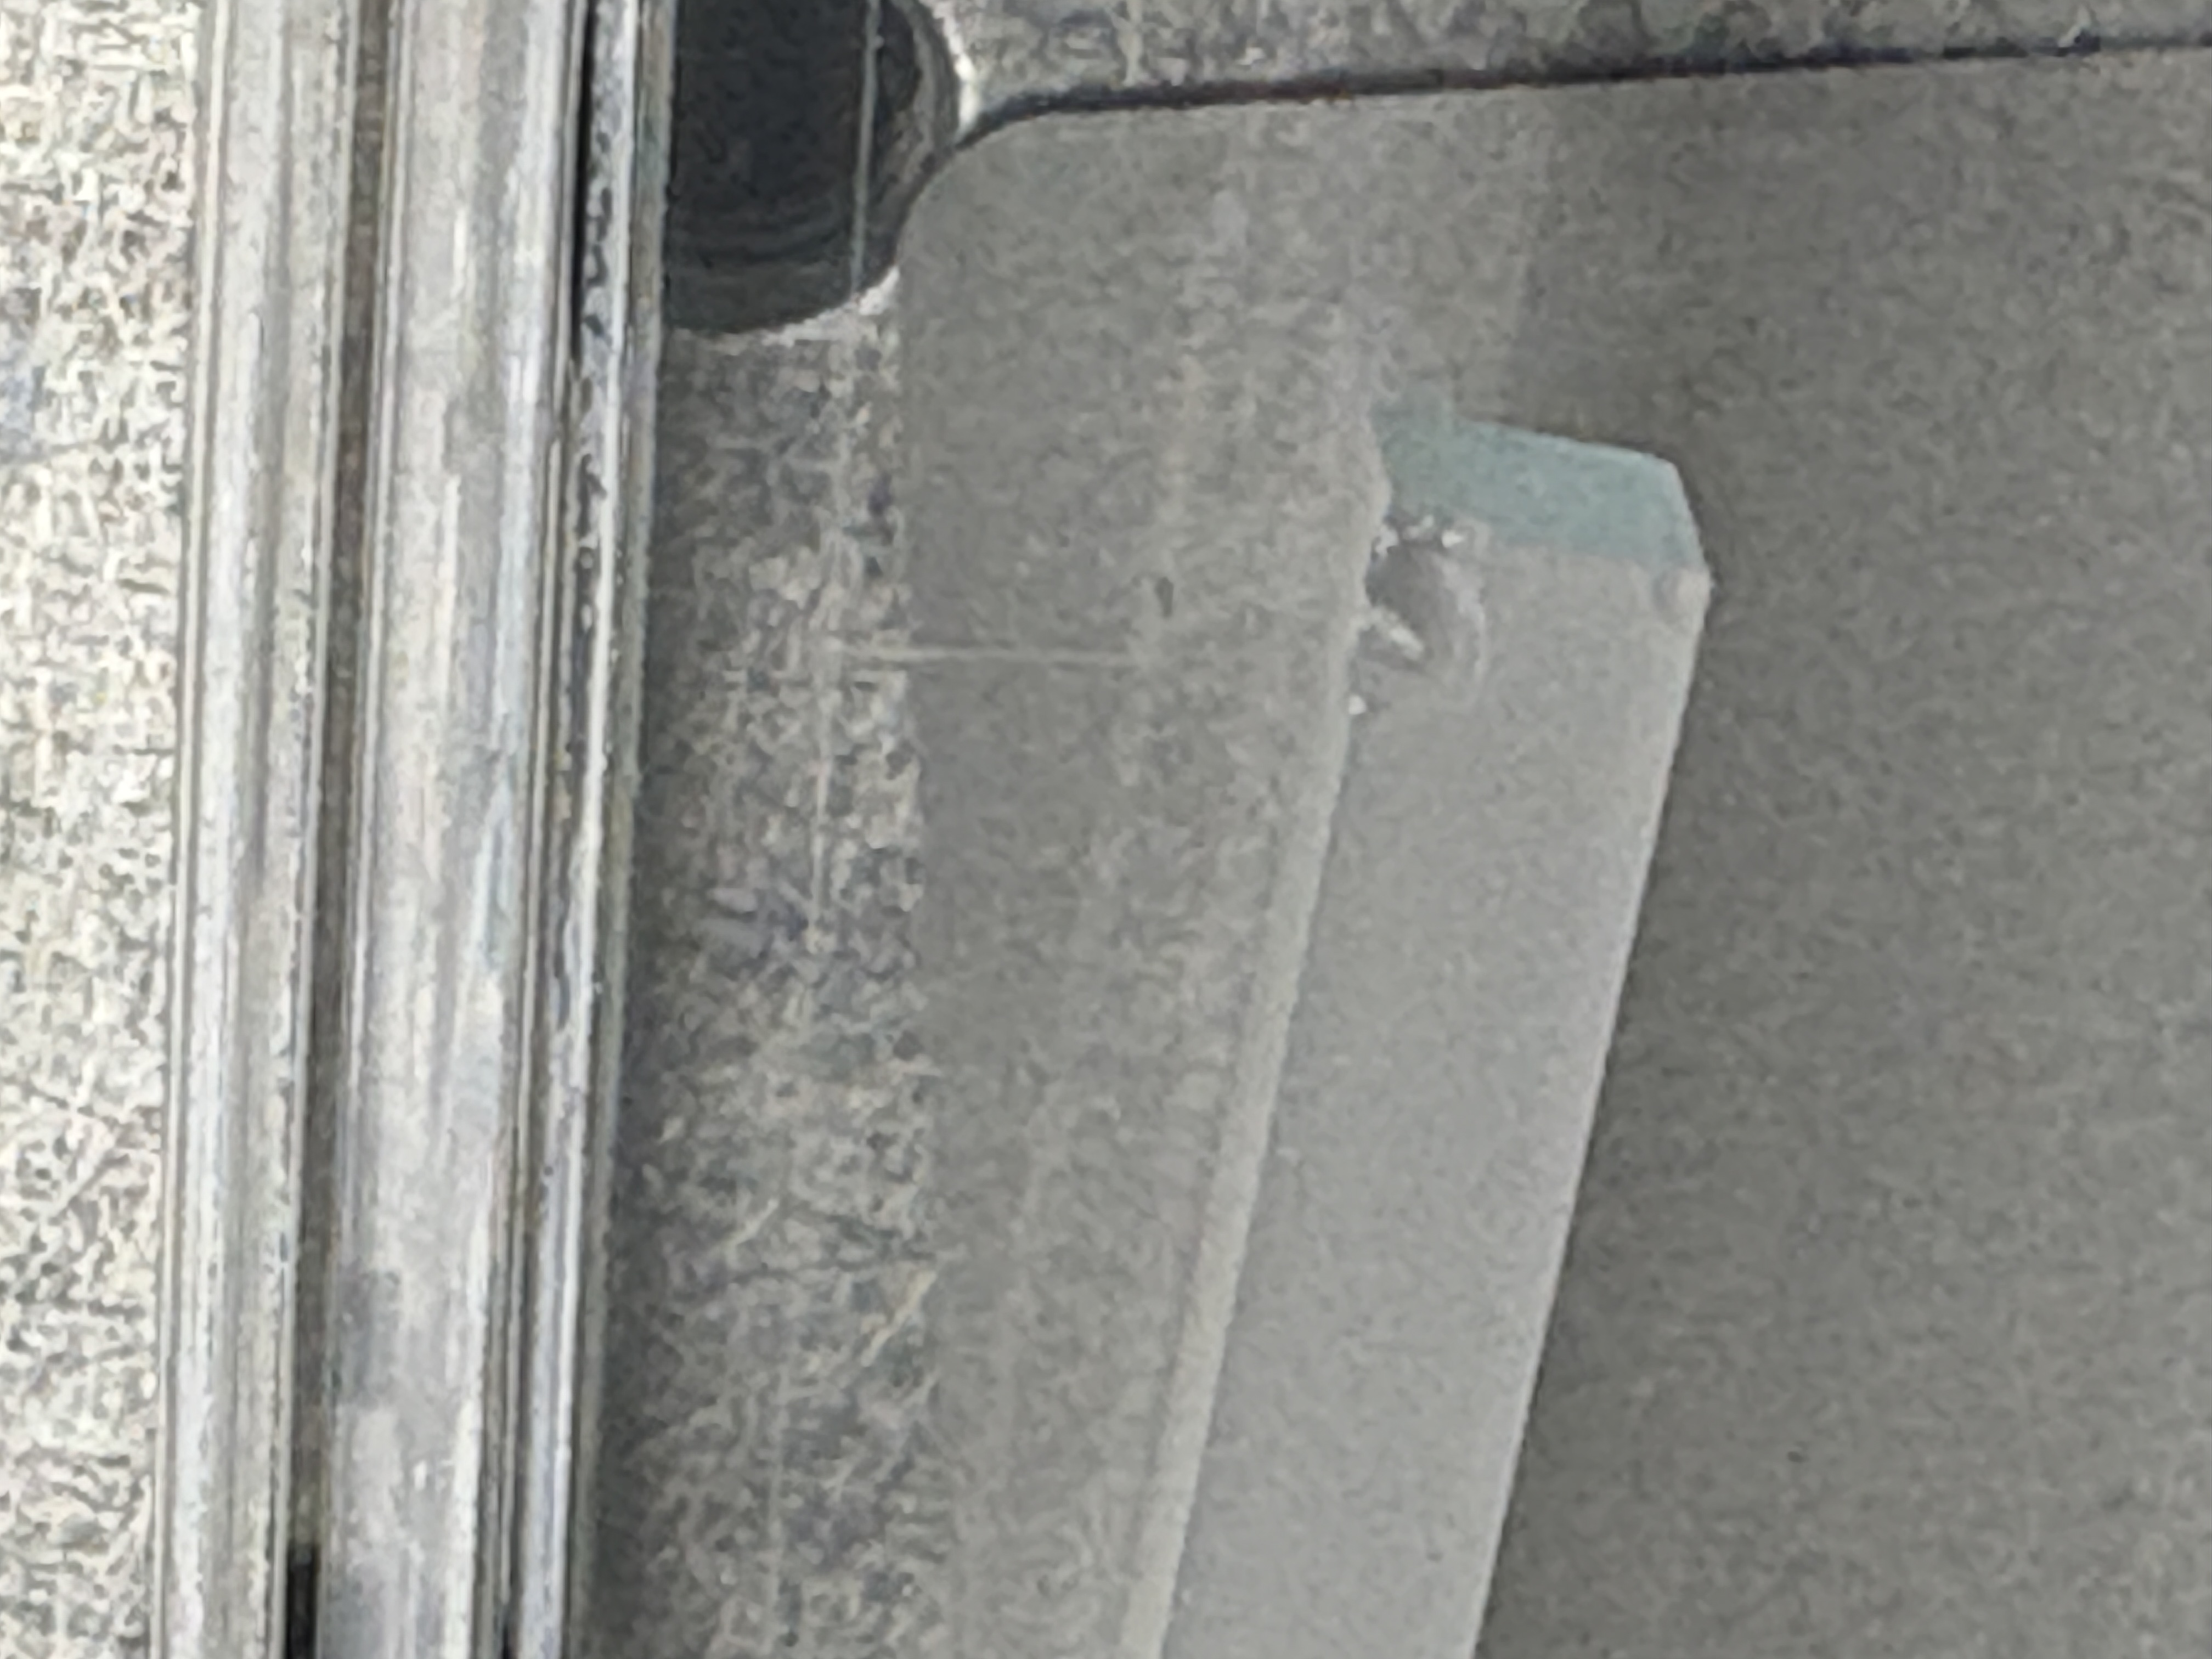
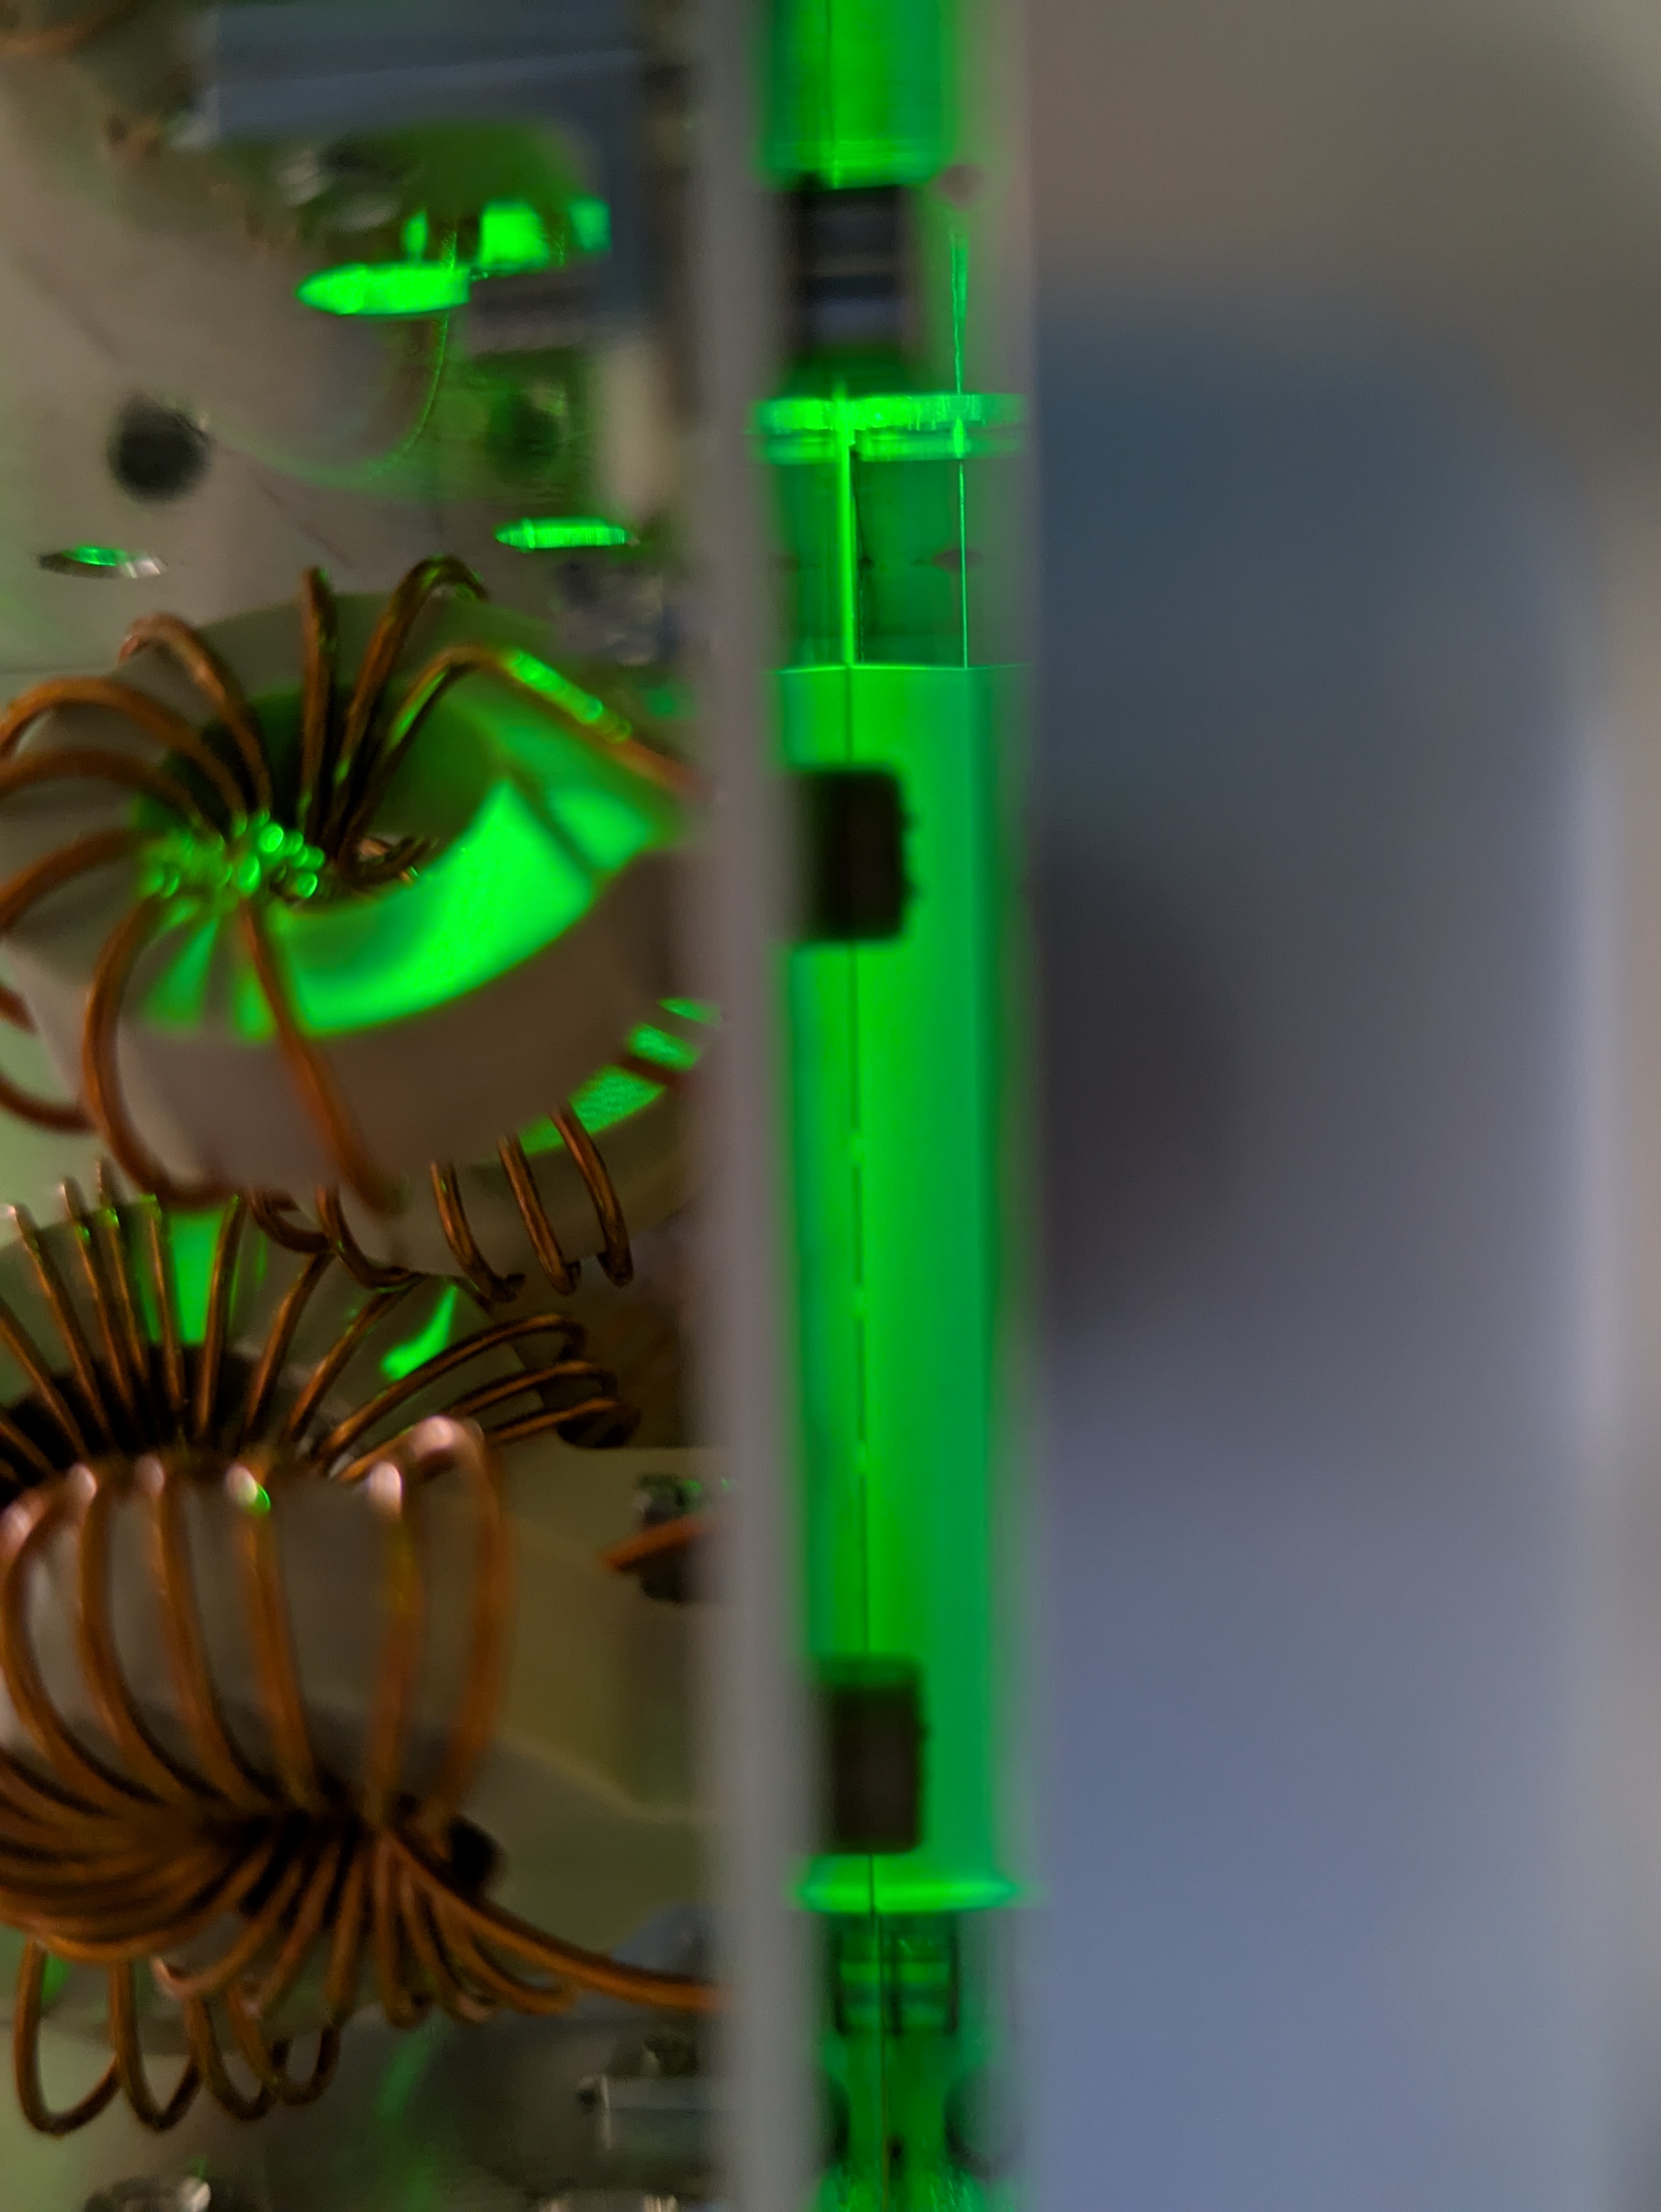
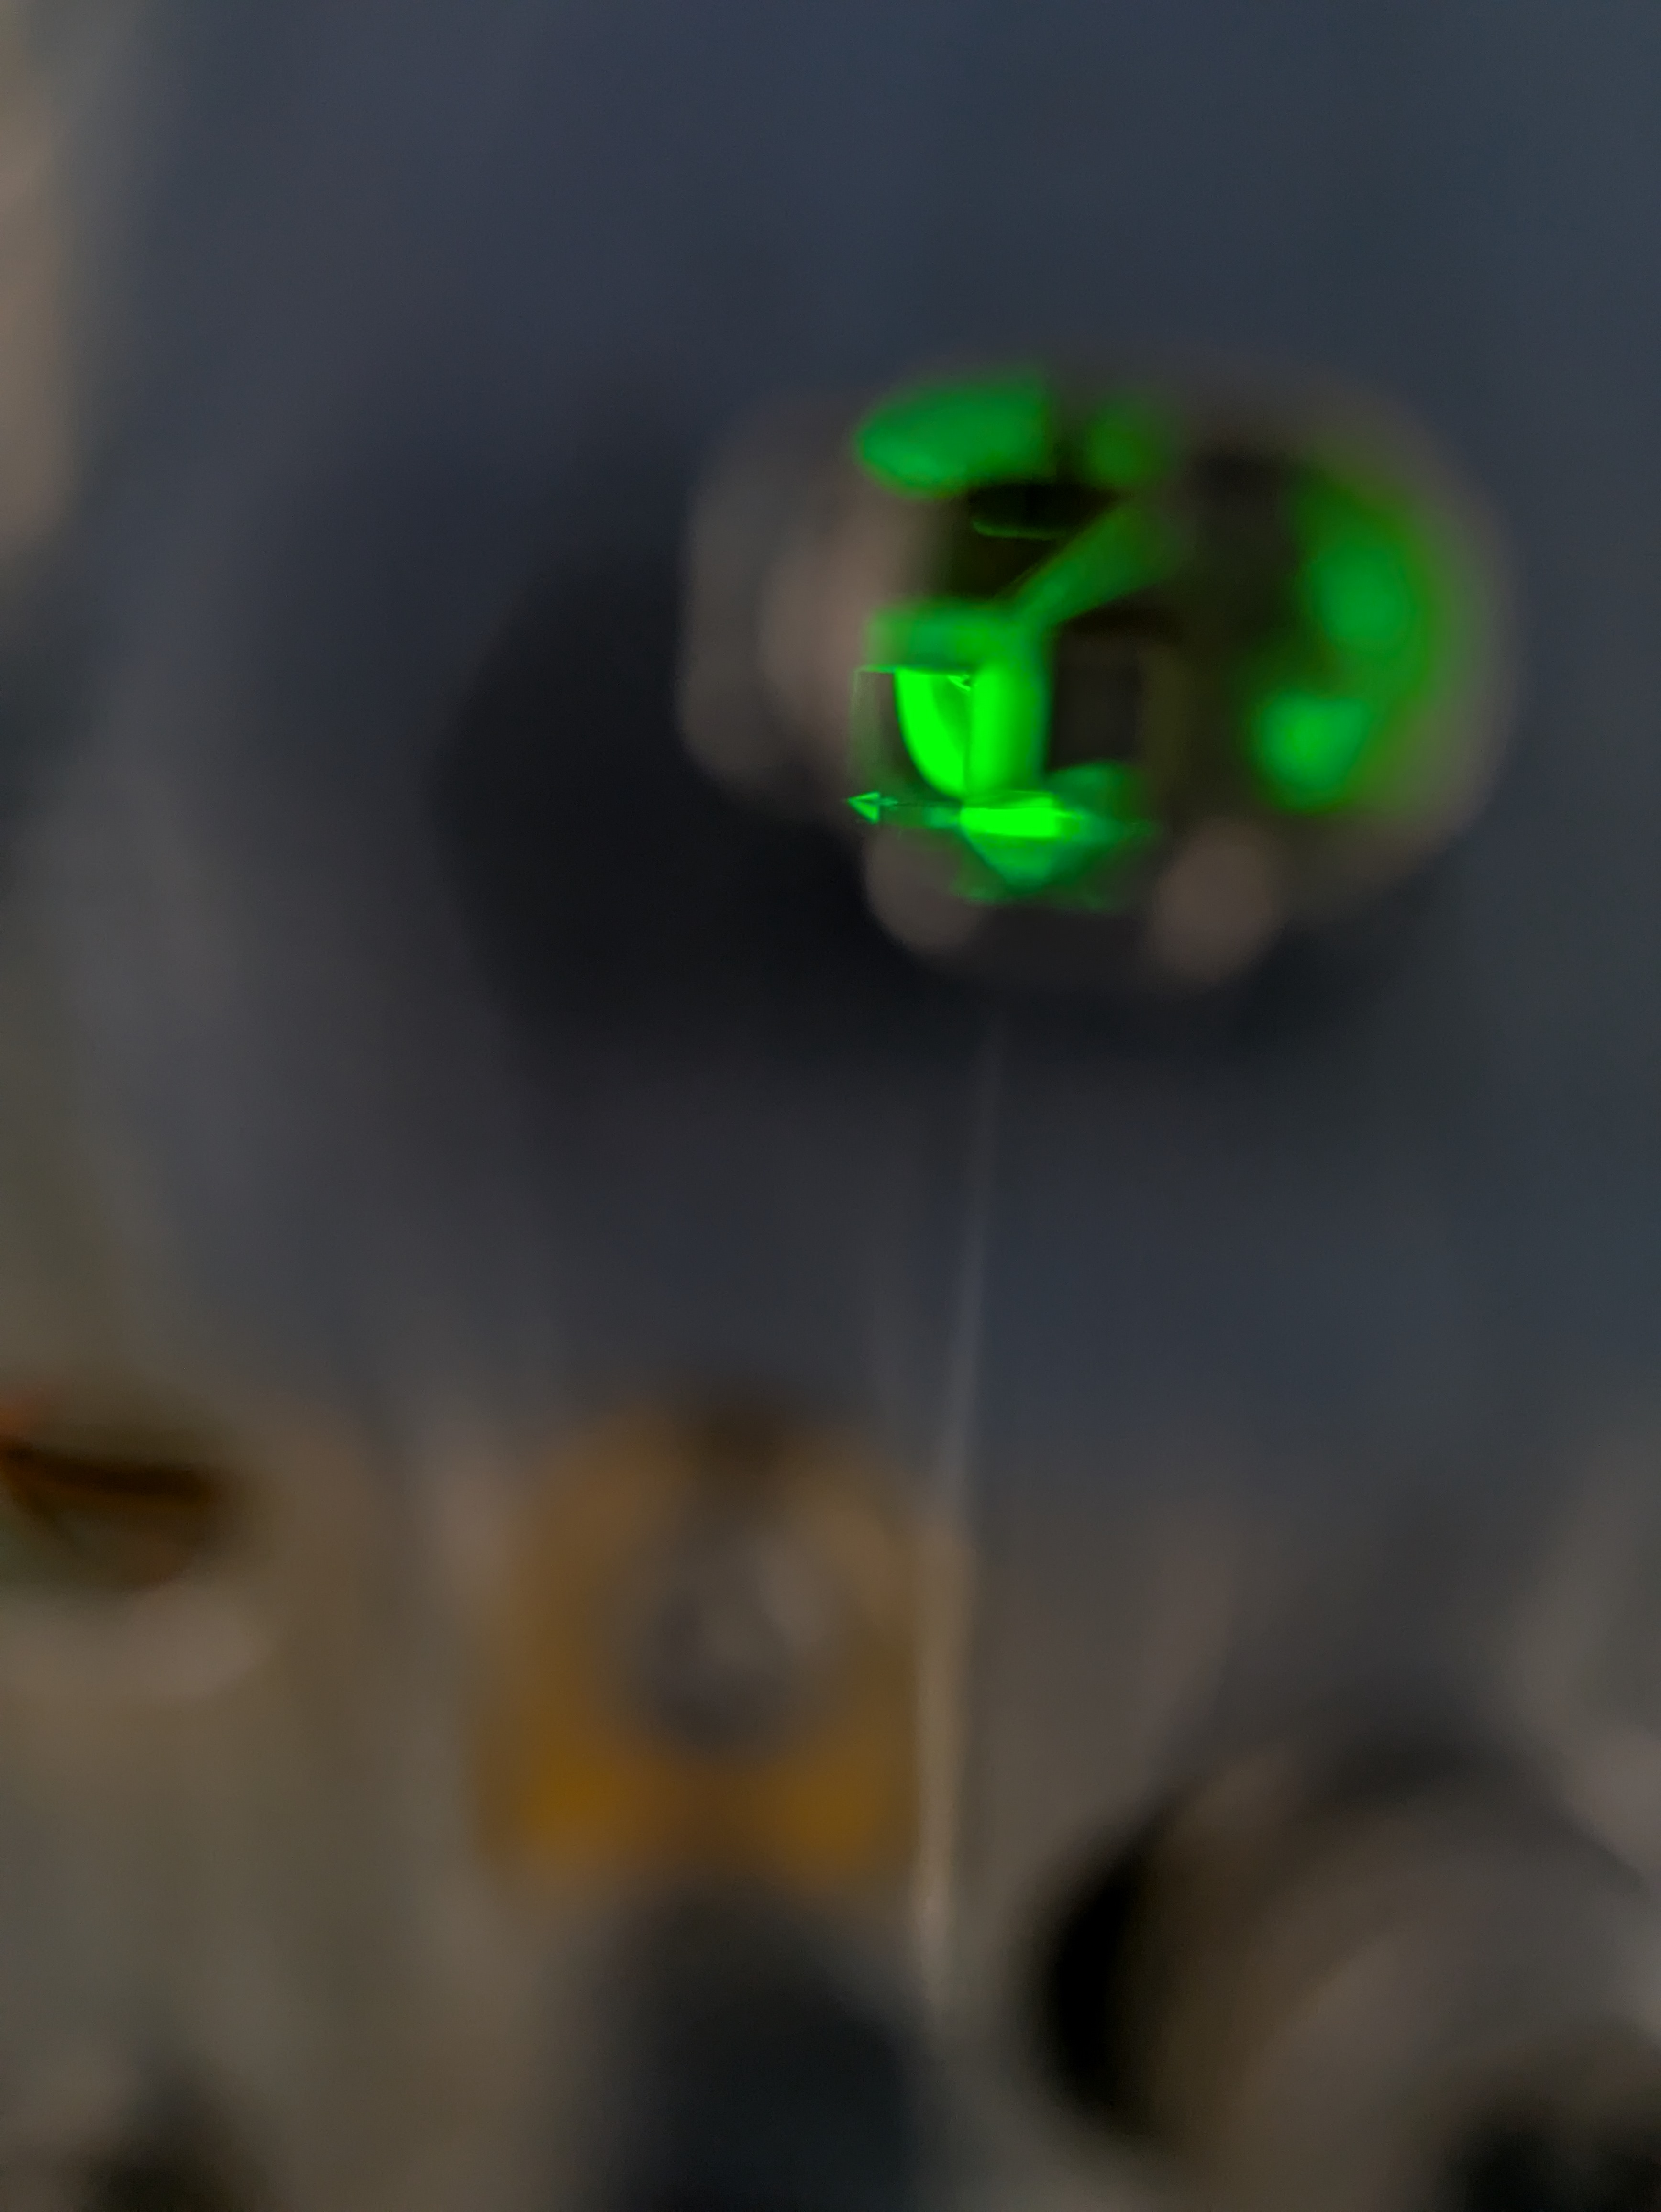
Before unmounting the old crystal, three set scews in the face plate were screwed in to contact the electrode board, and then very slightly backed off. After this, we lifted the board/side assy from the front plate to expose the crystal on top of the face plate, swapped the crystal (in our setup, the distance between the crystal edge and the front plate edge close to the output side was set to ~7.5mm due to 0.5mm shim washer we use between the front plate and the input side plate), and put the board/side assy on. This was much easier than before due to the aforementioned set screws. Elenna will post some pictures.
In the afternoon the EOM was tuned in the lab and put back into HAM1. We didn't bother to tap things around this time.
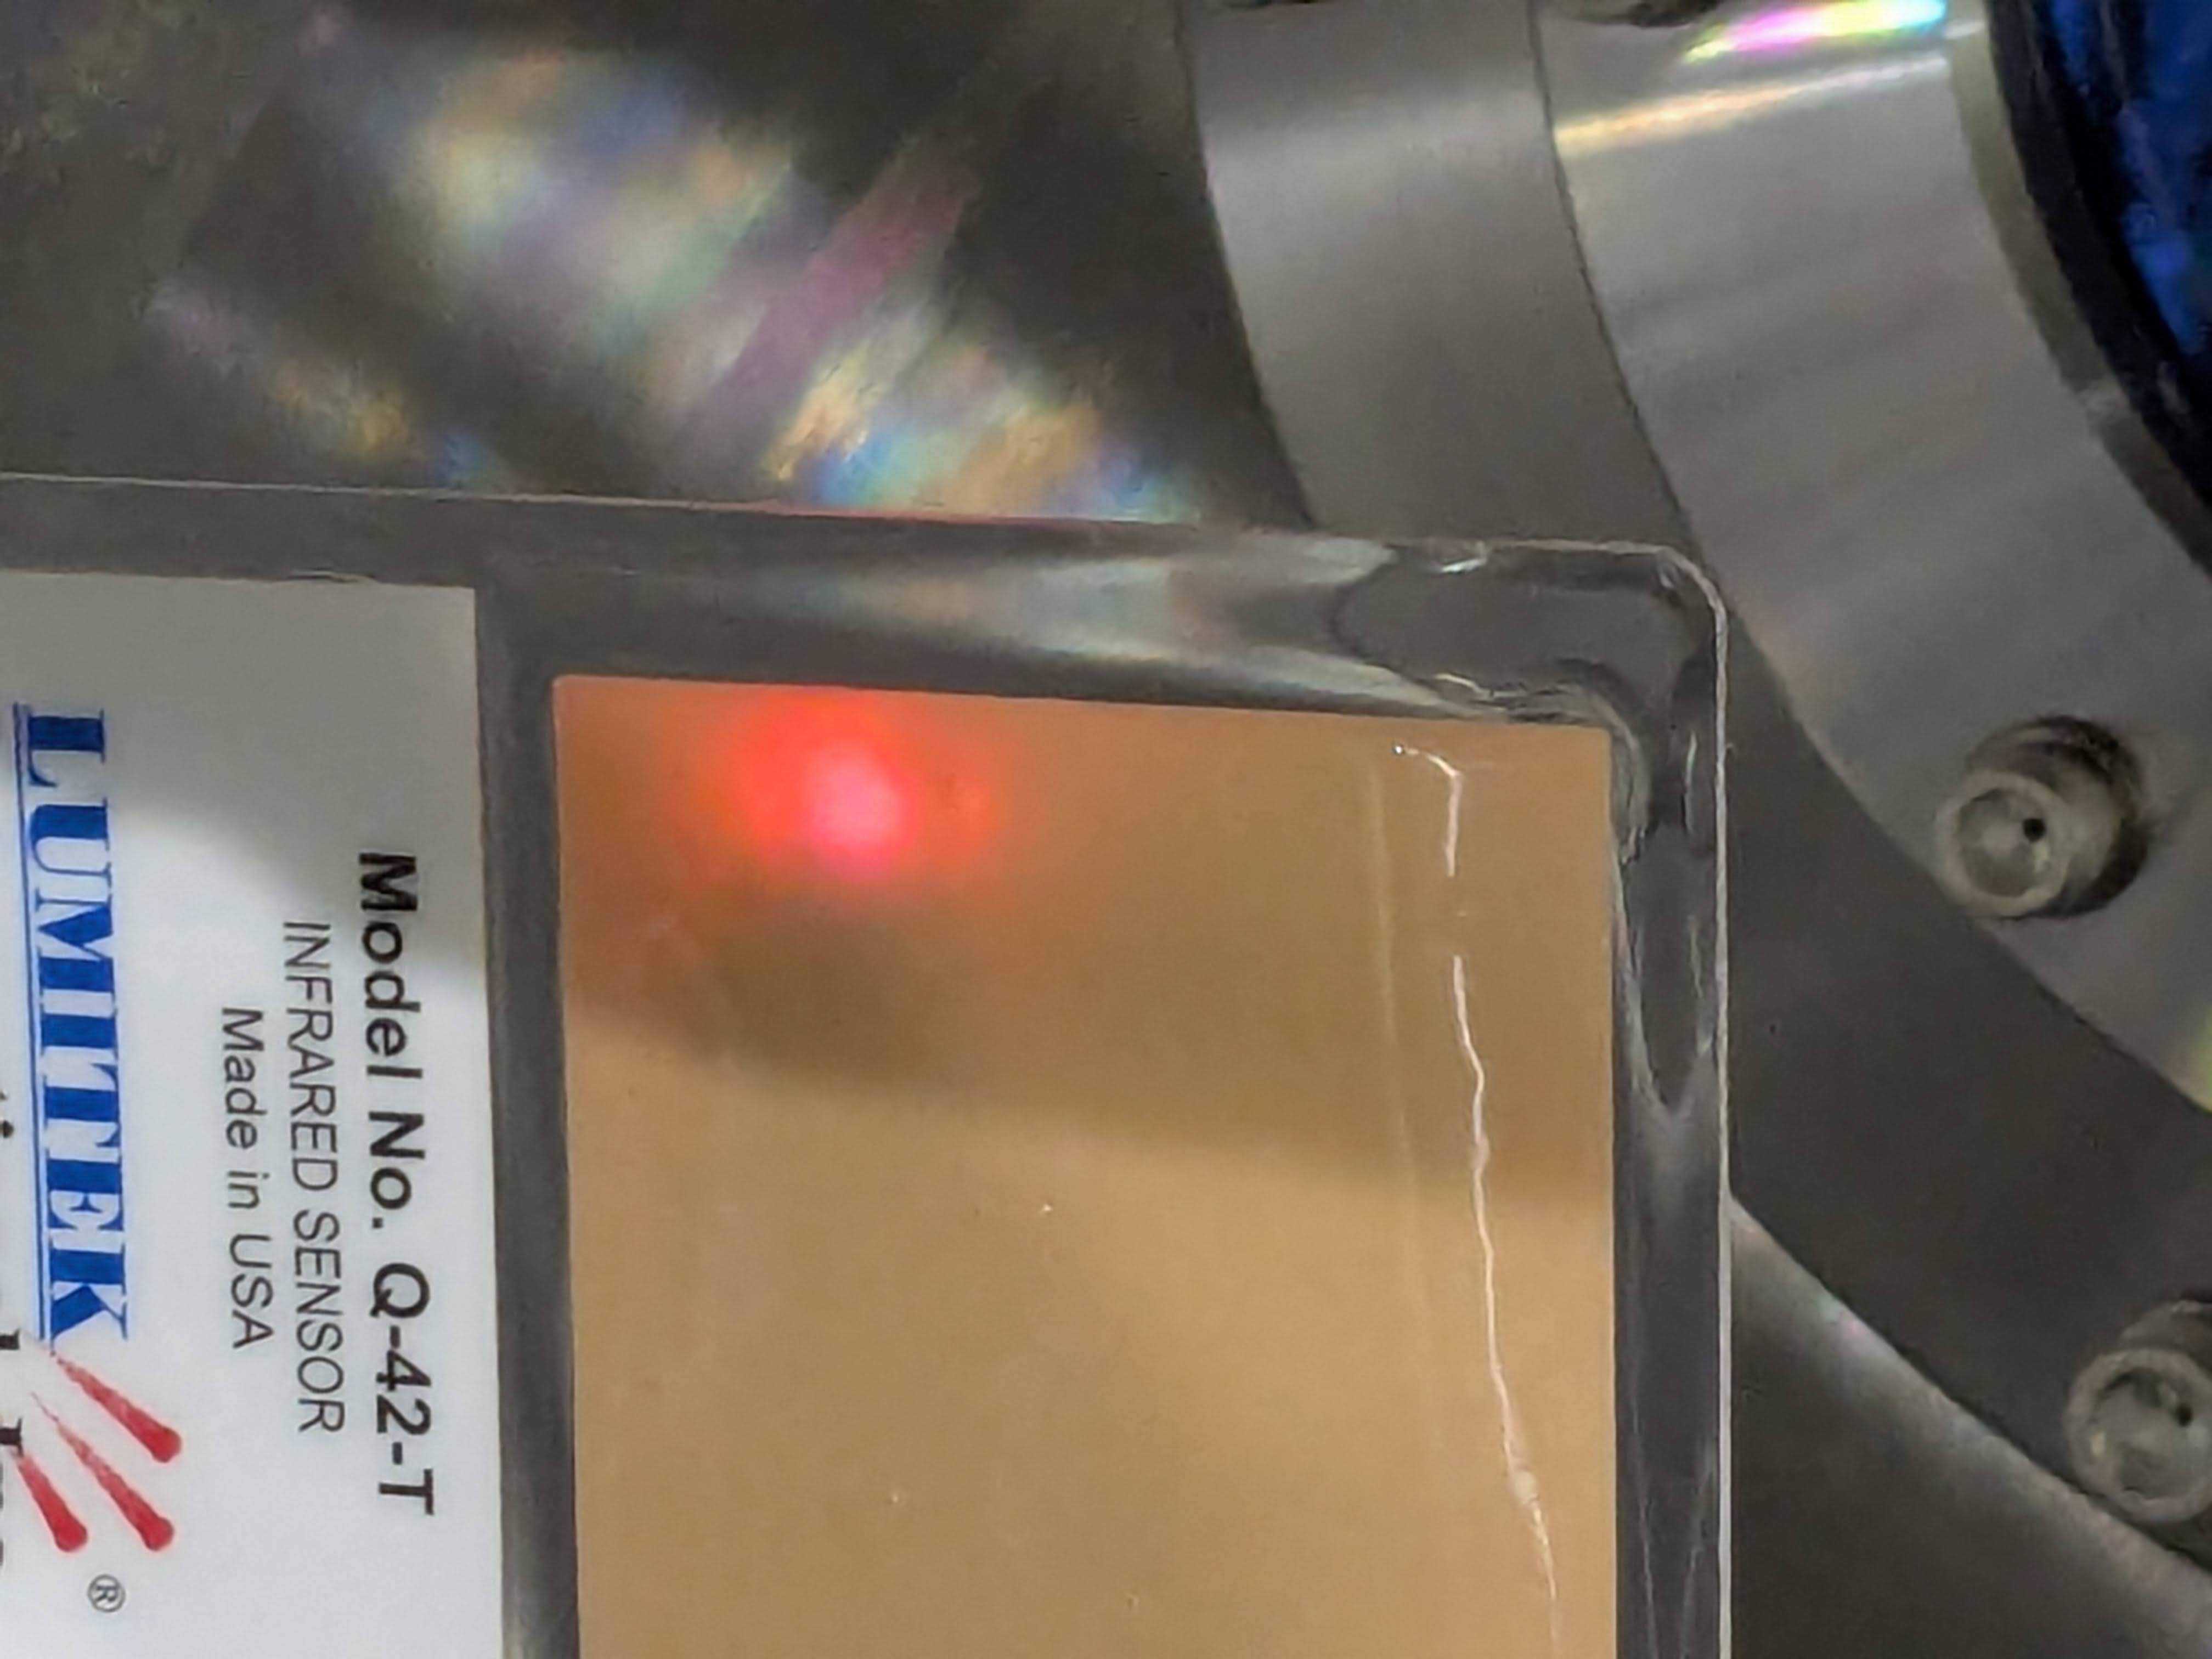
EOM was transferred to HAM1. Tuning measurement was repeated in chamber, no big change from the lab measurement and they're good (see pictures).
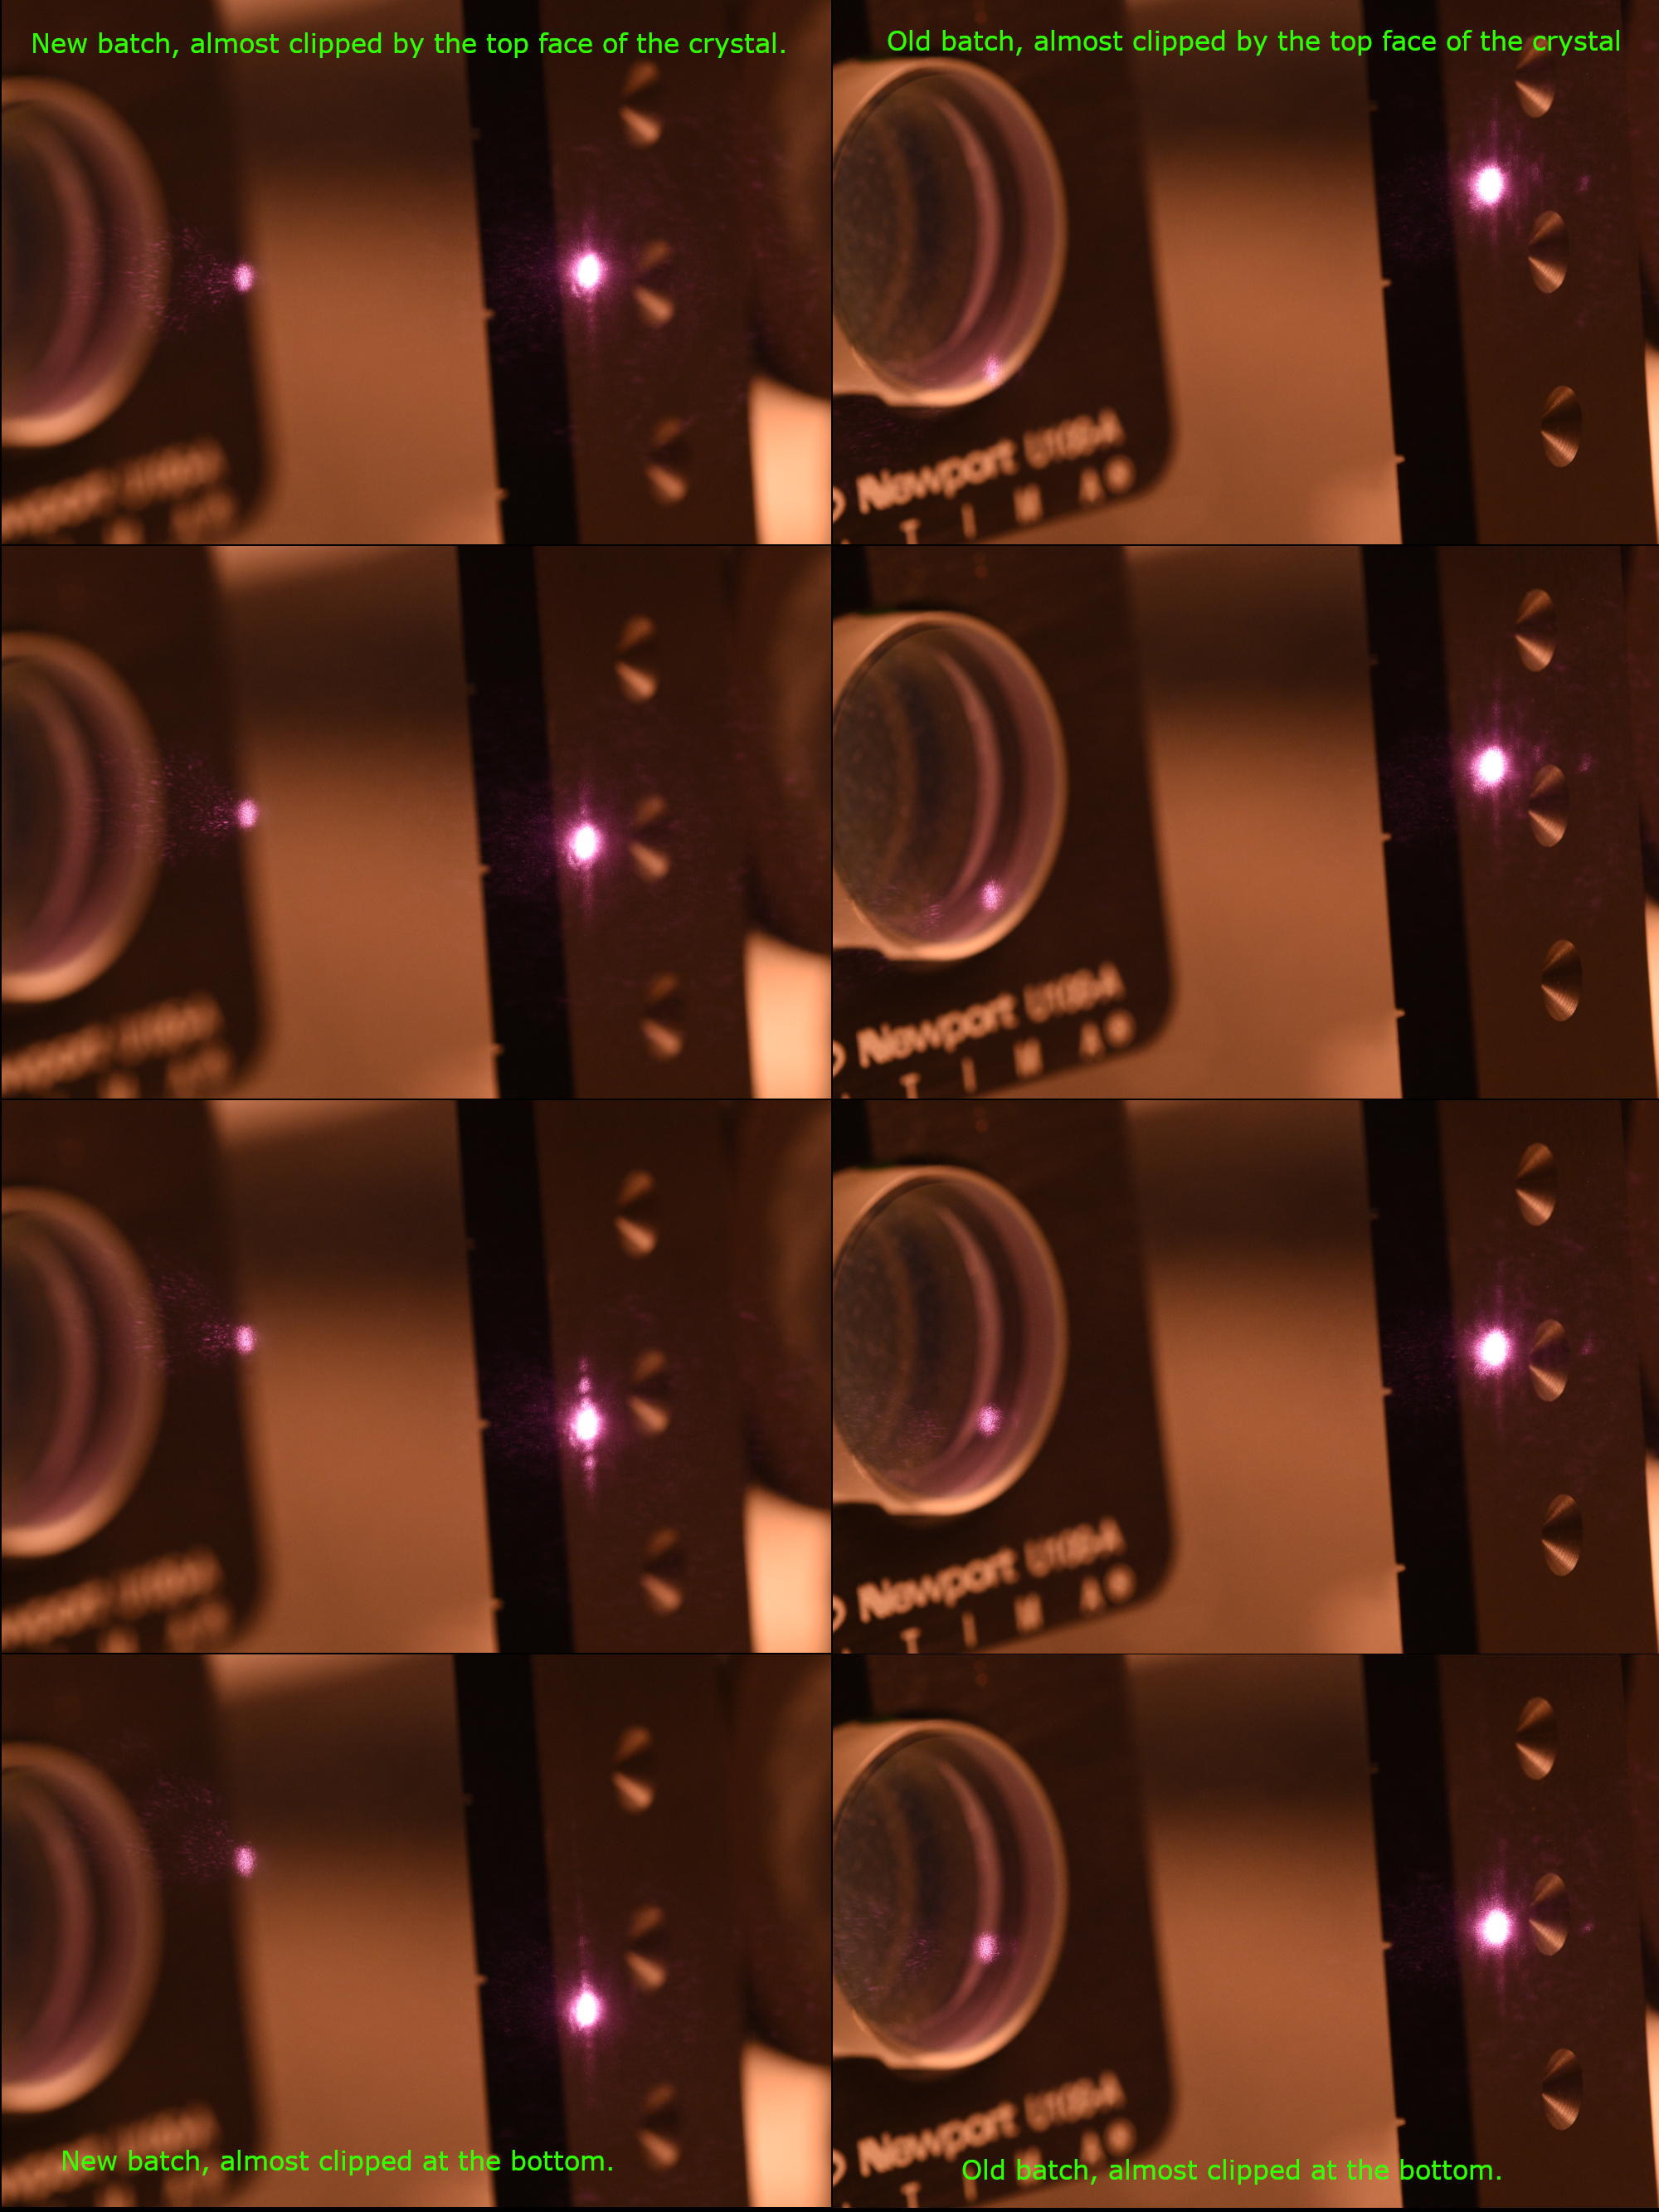
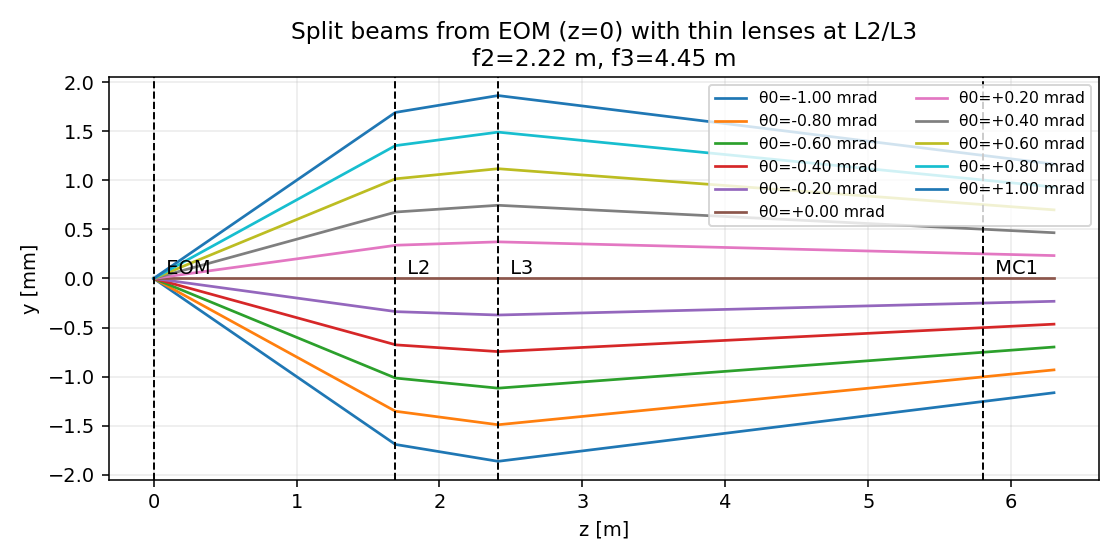
With EOM in place, we locked JAC and confirmed that the wedge orientation of the crystal was correct (because the beam was mostly deflected in YAW toward +Y direction). We also saw that the beam deflection was different from the old EOM in PIT as well as YAW (more difference in PIT according to Jason).
No fine alignment of the EOM was done for today, but we quickly raised the power to 1W and neither Jason nor I were able to find any clear ghost beams, unlike with the old crystal.
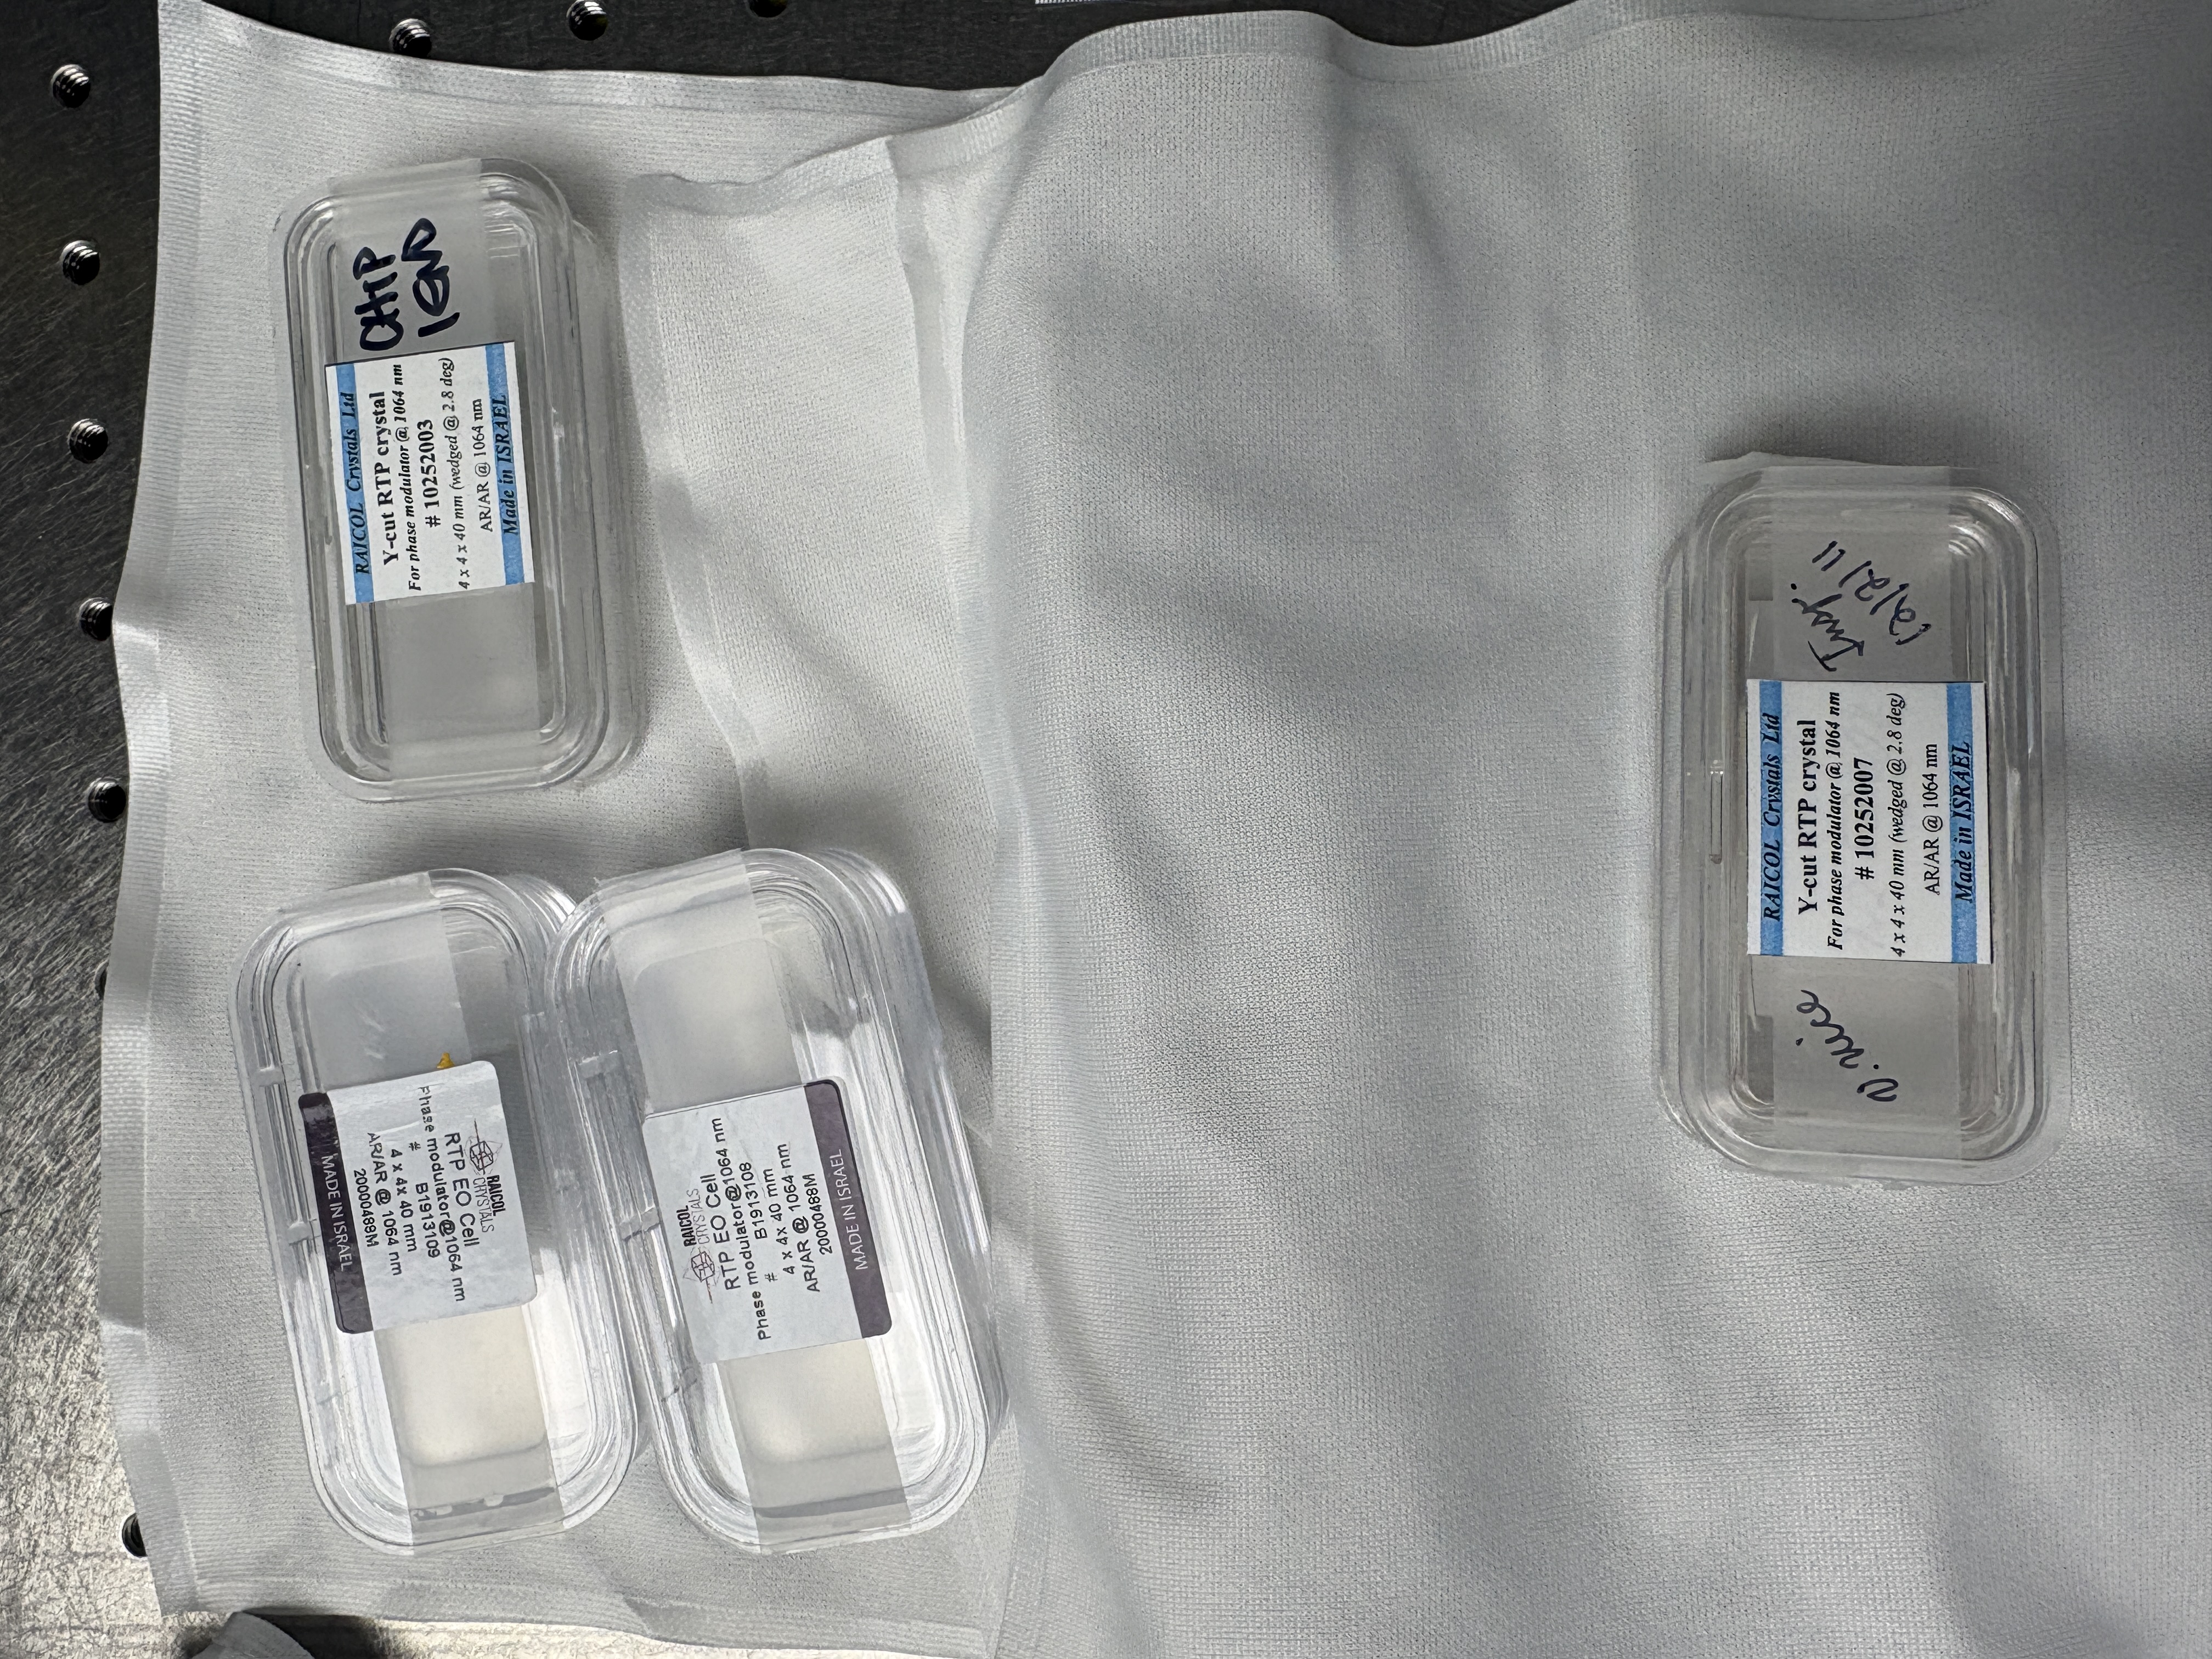
Below is a table of RTP crystals at LHO (see alog 89125, alog 89115).
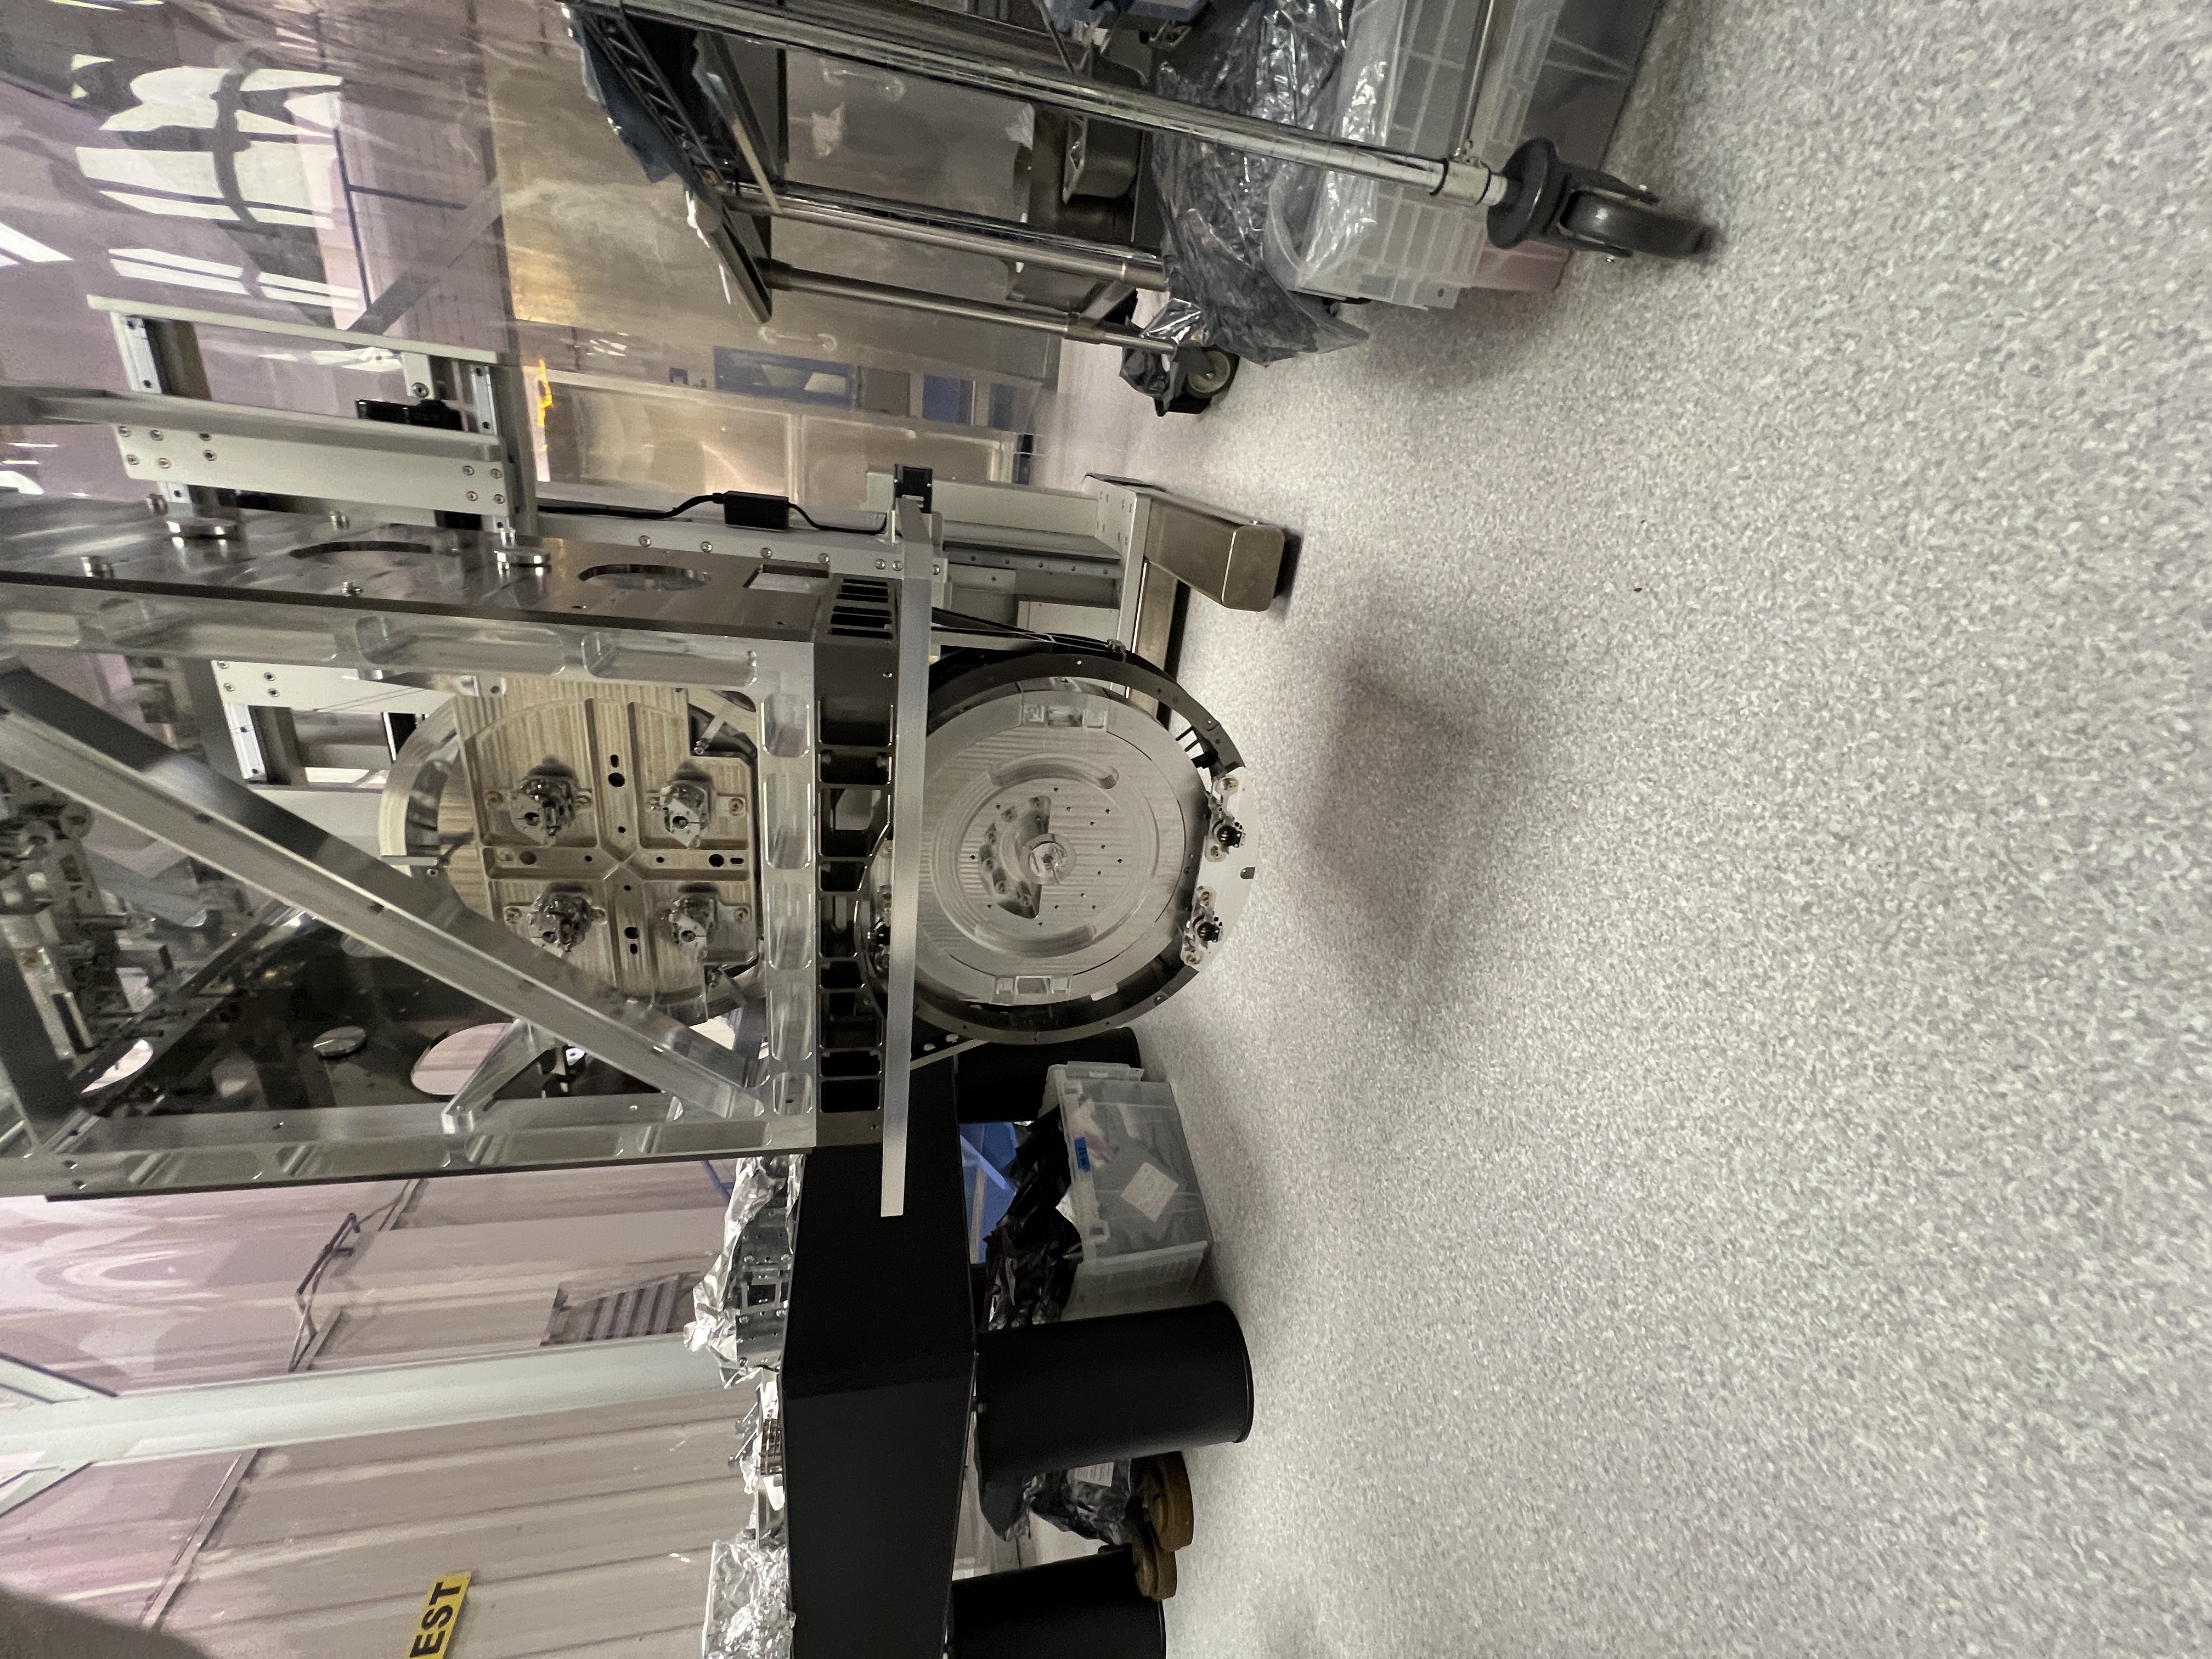
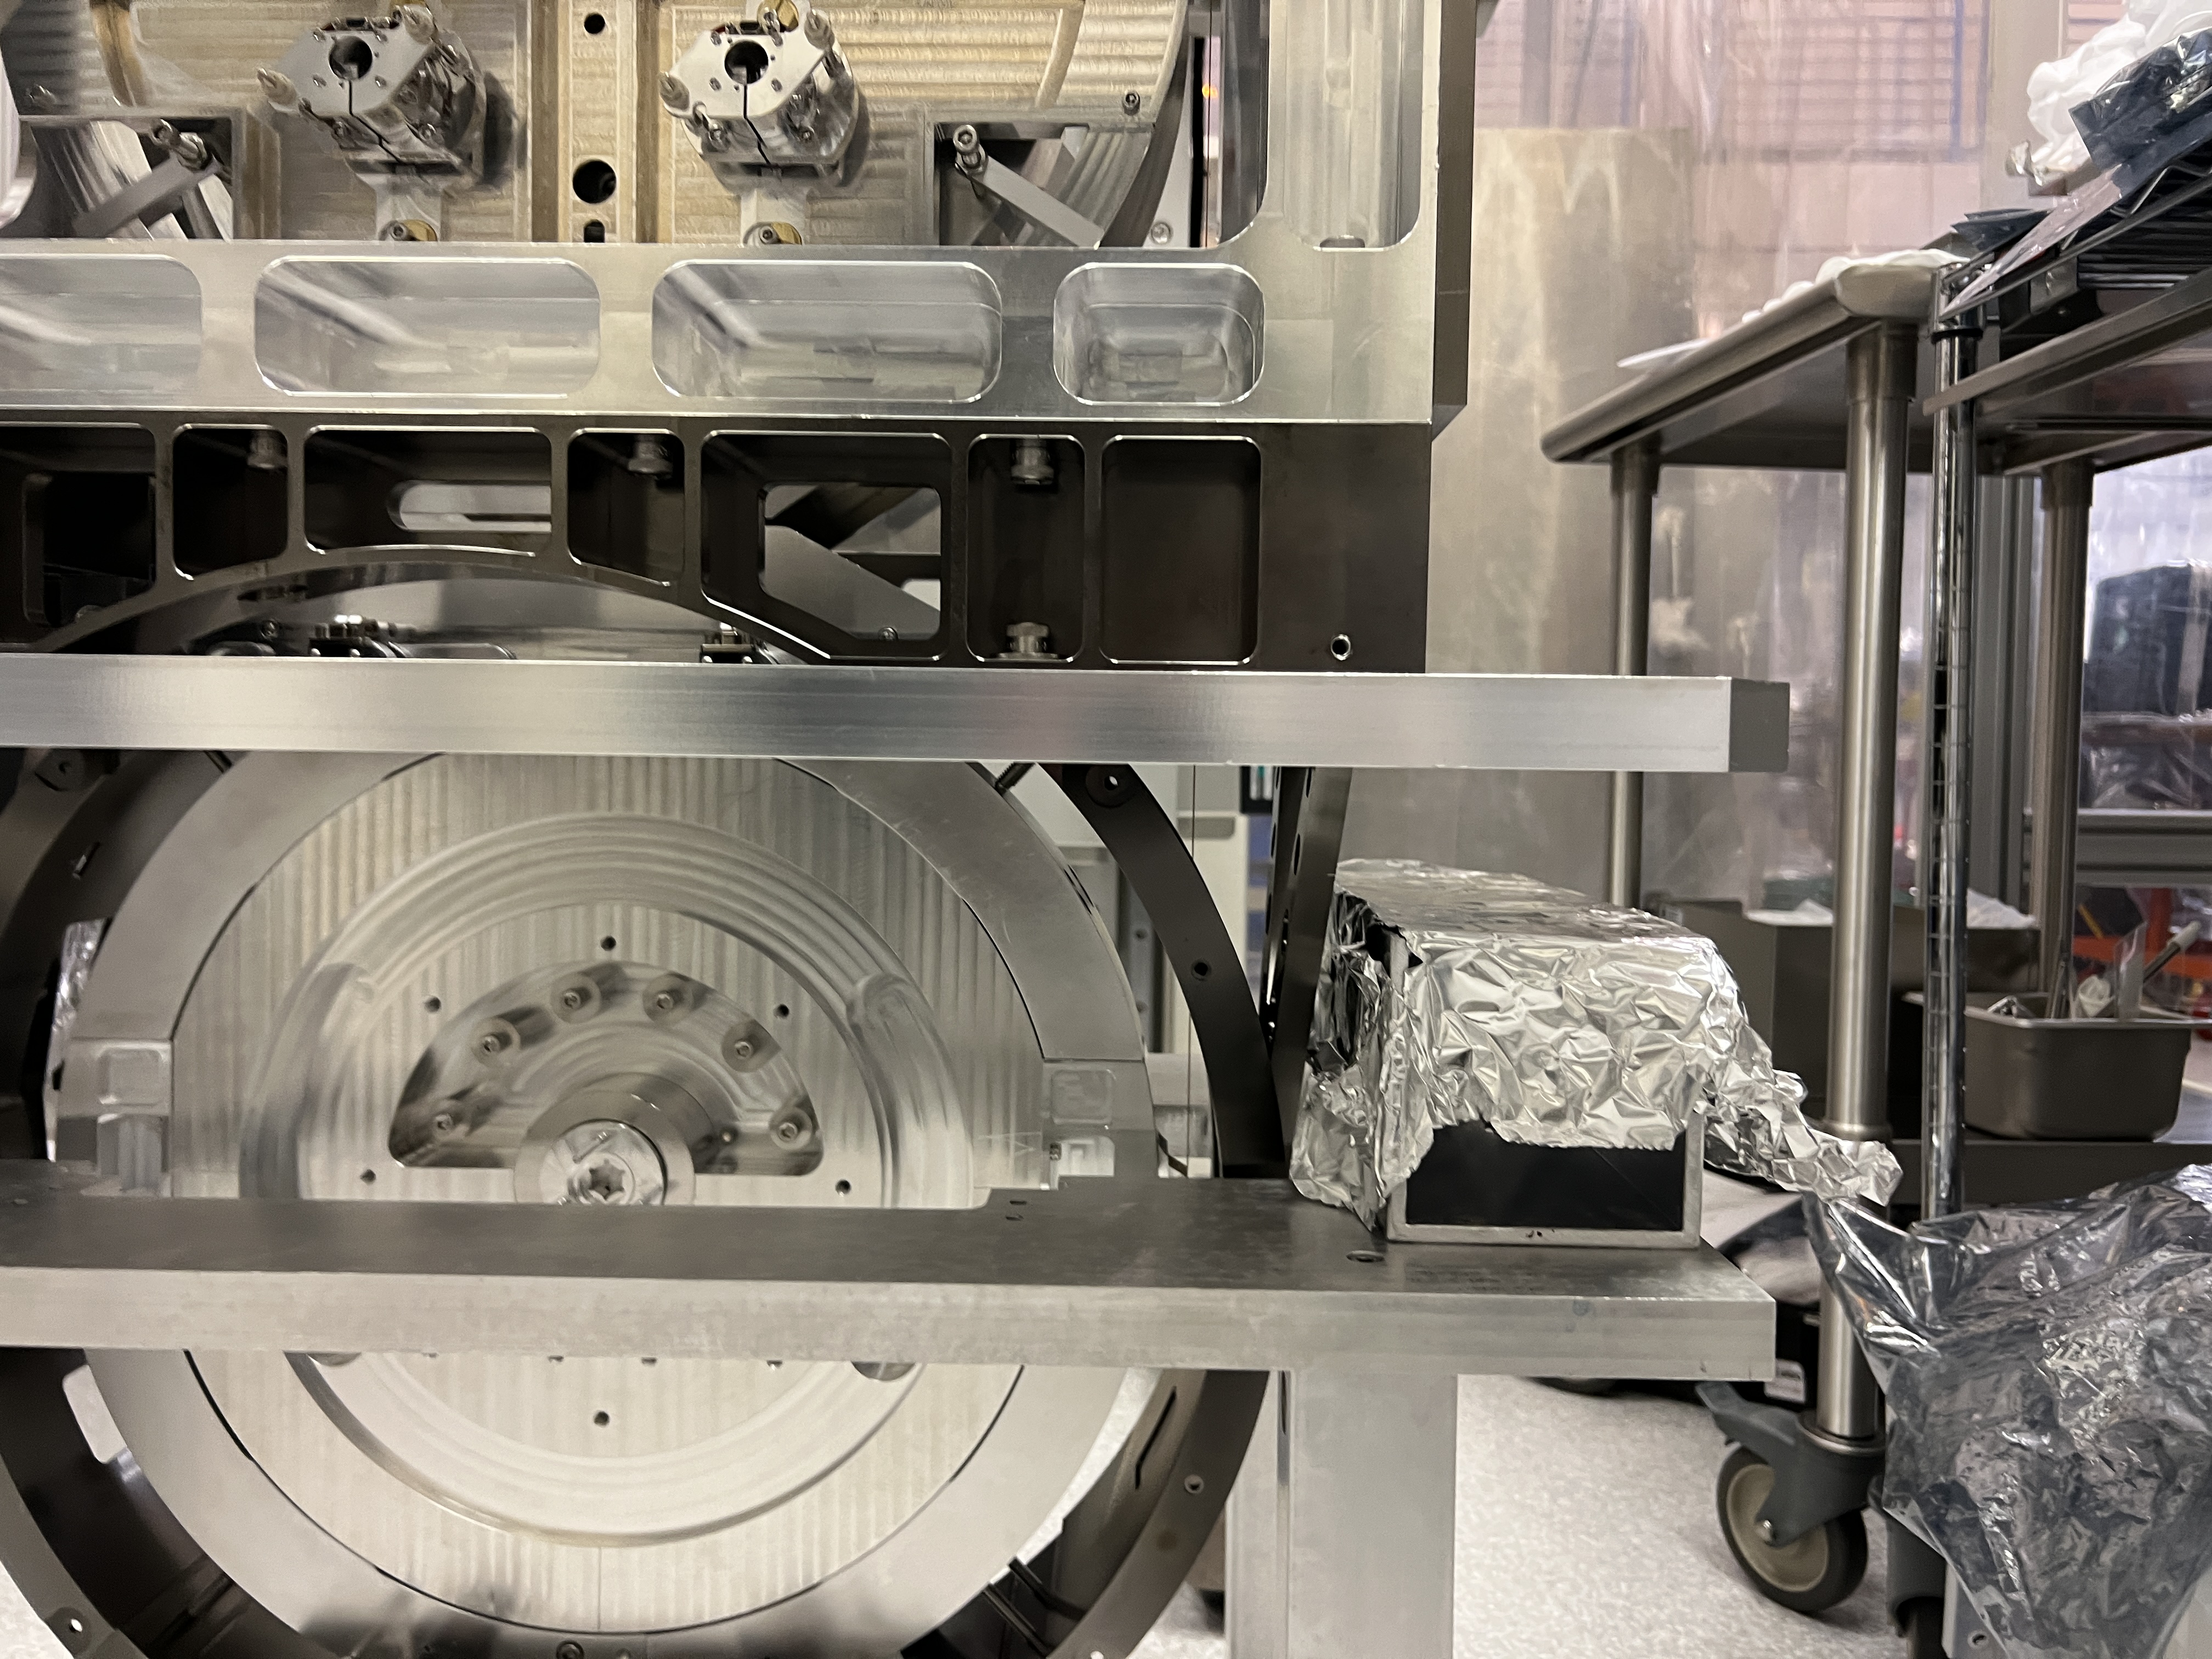
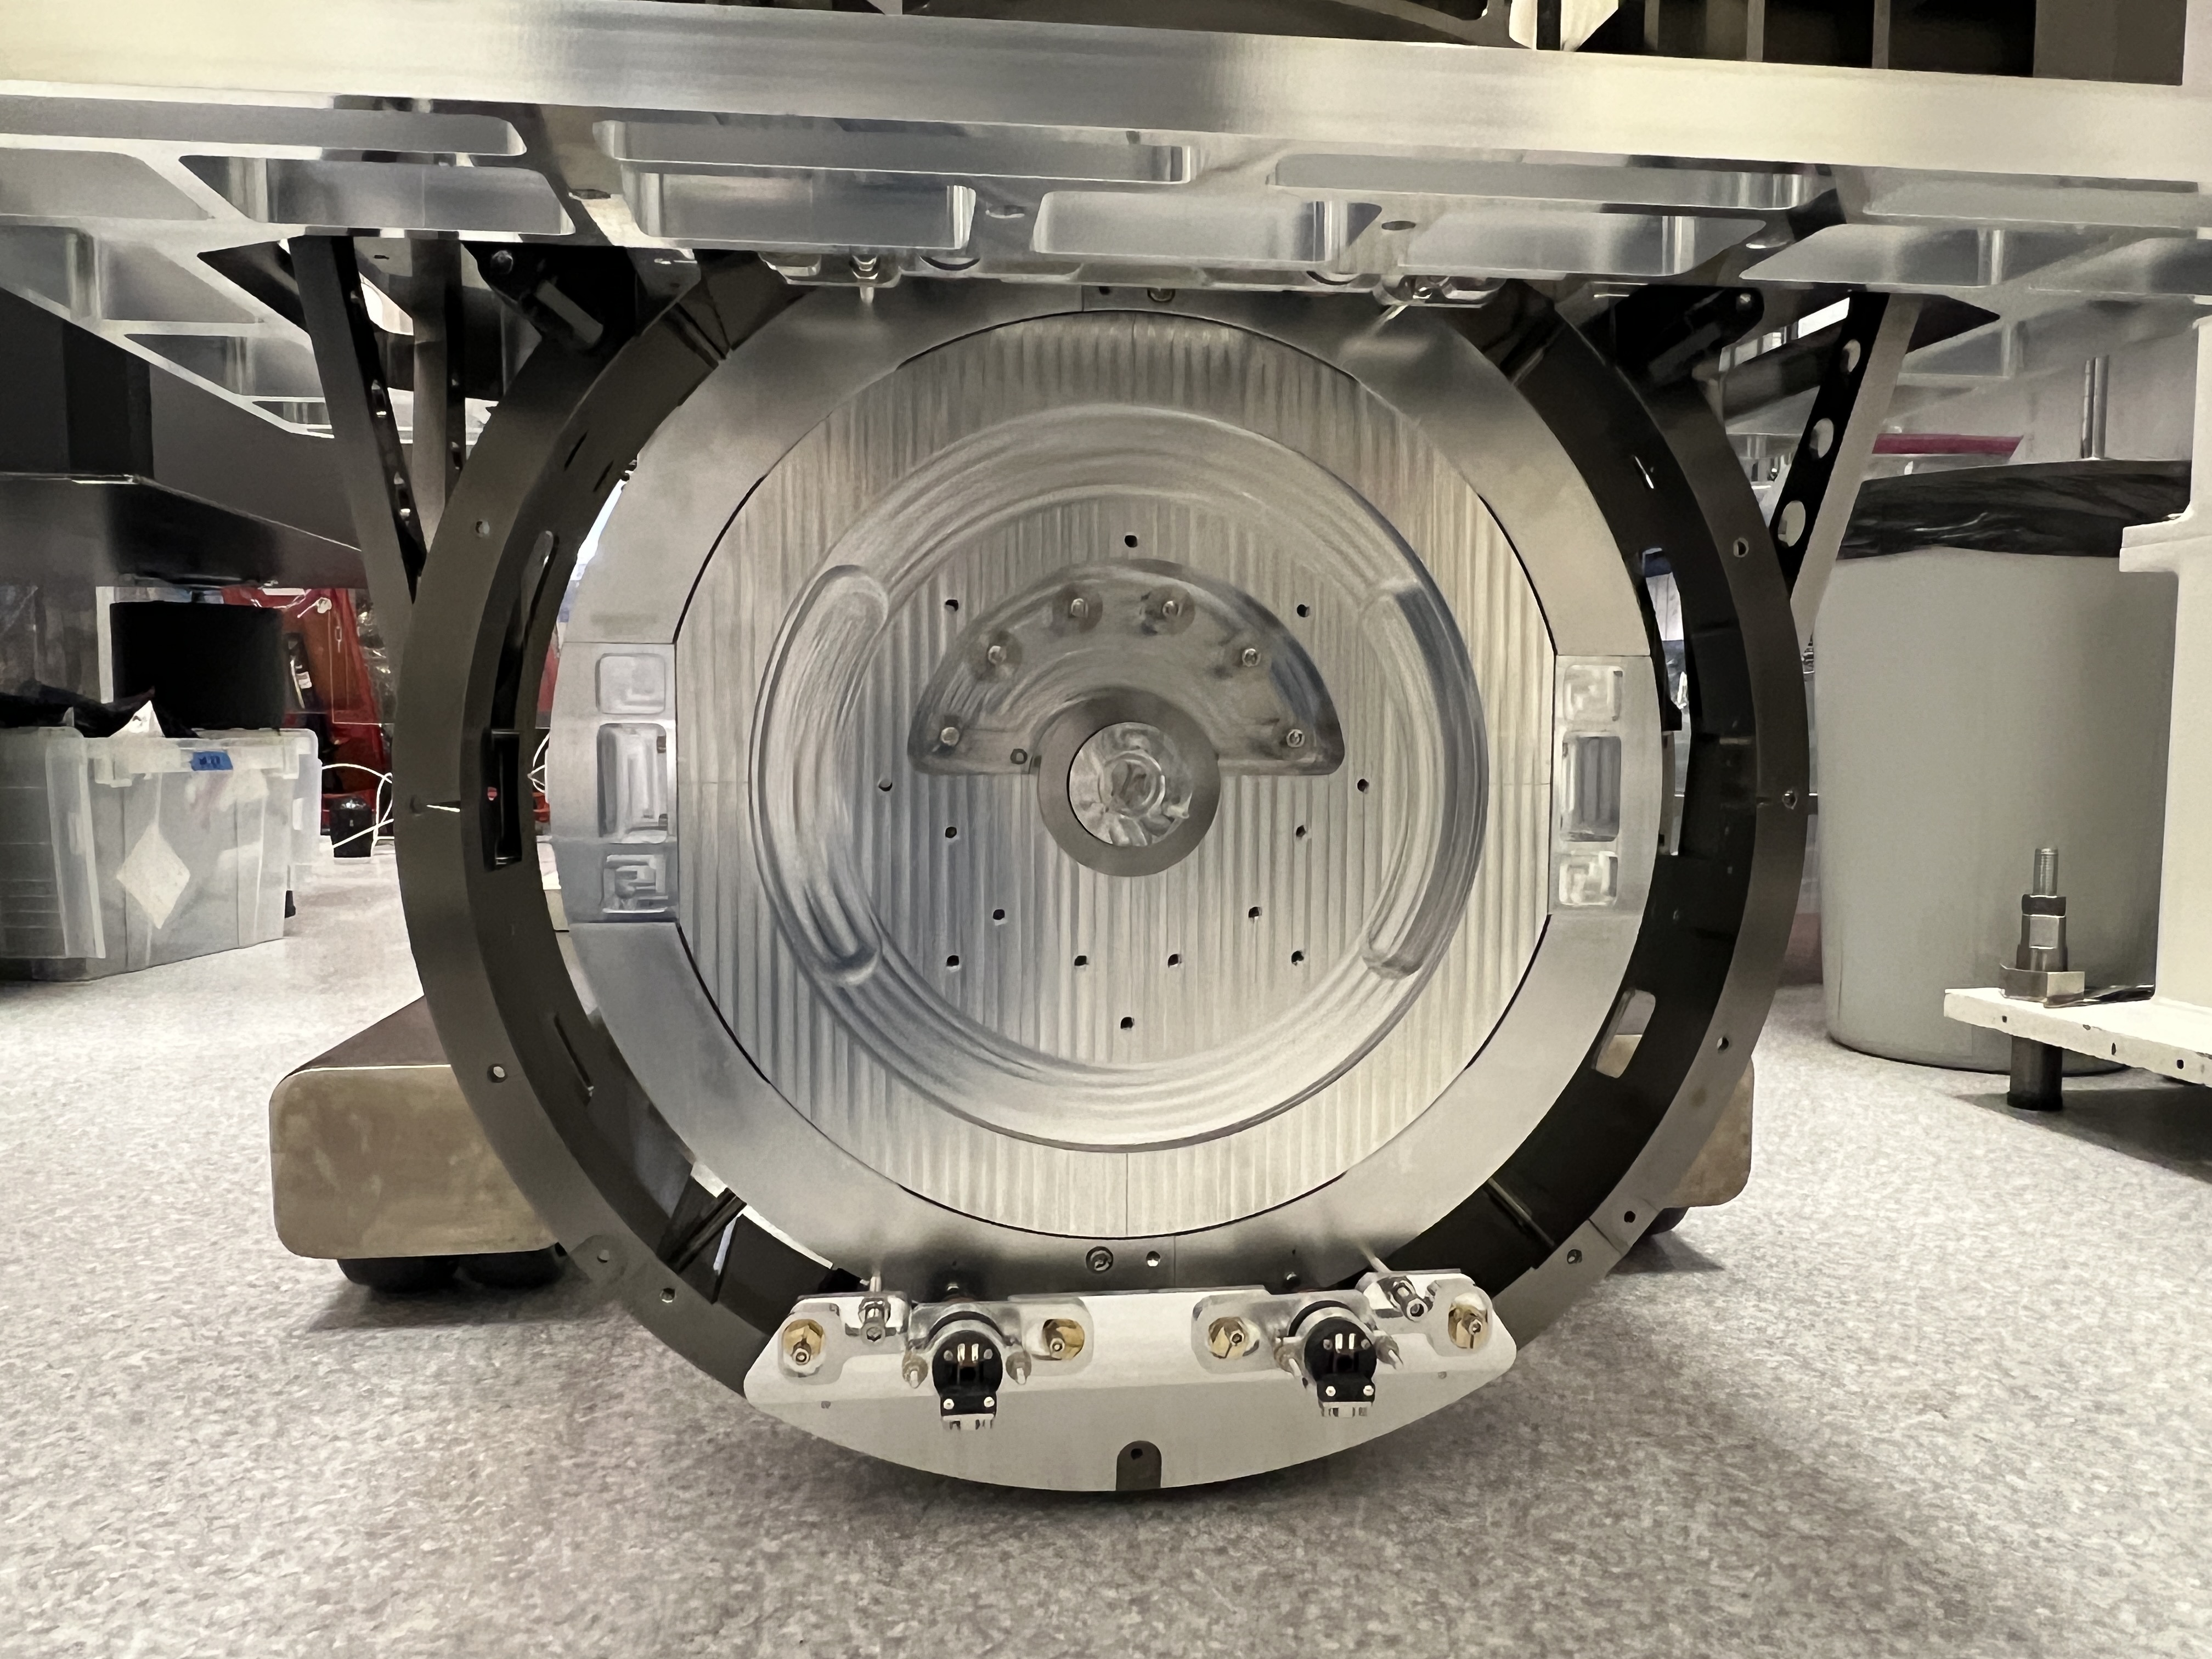
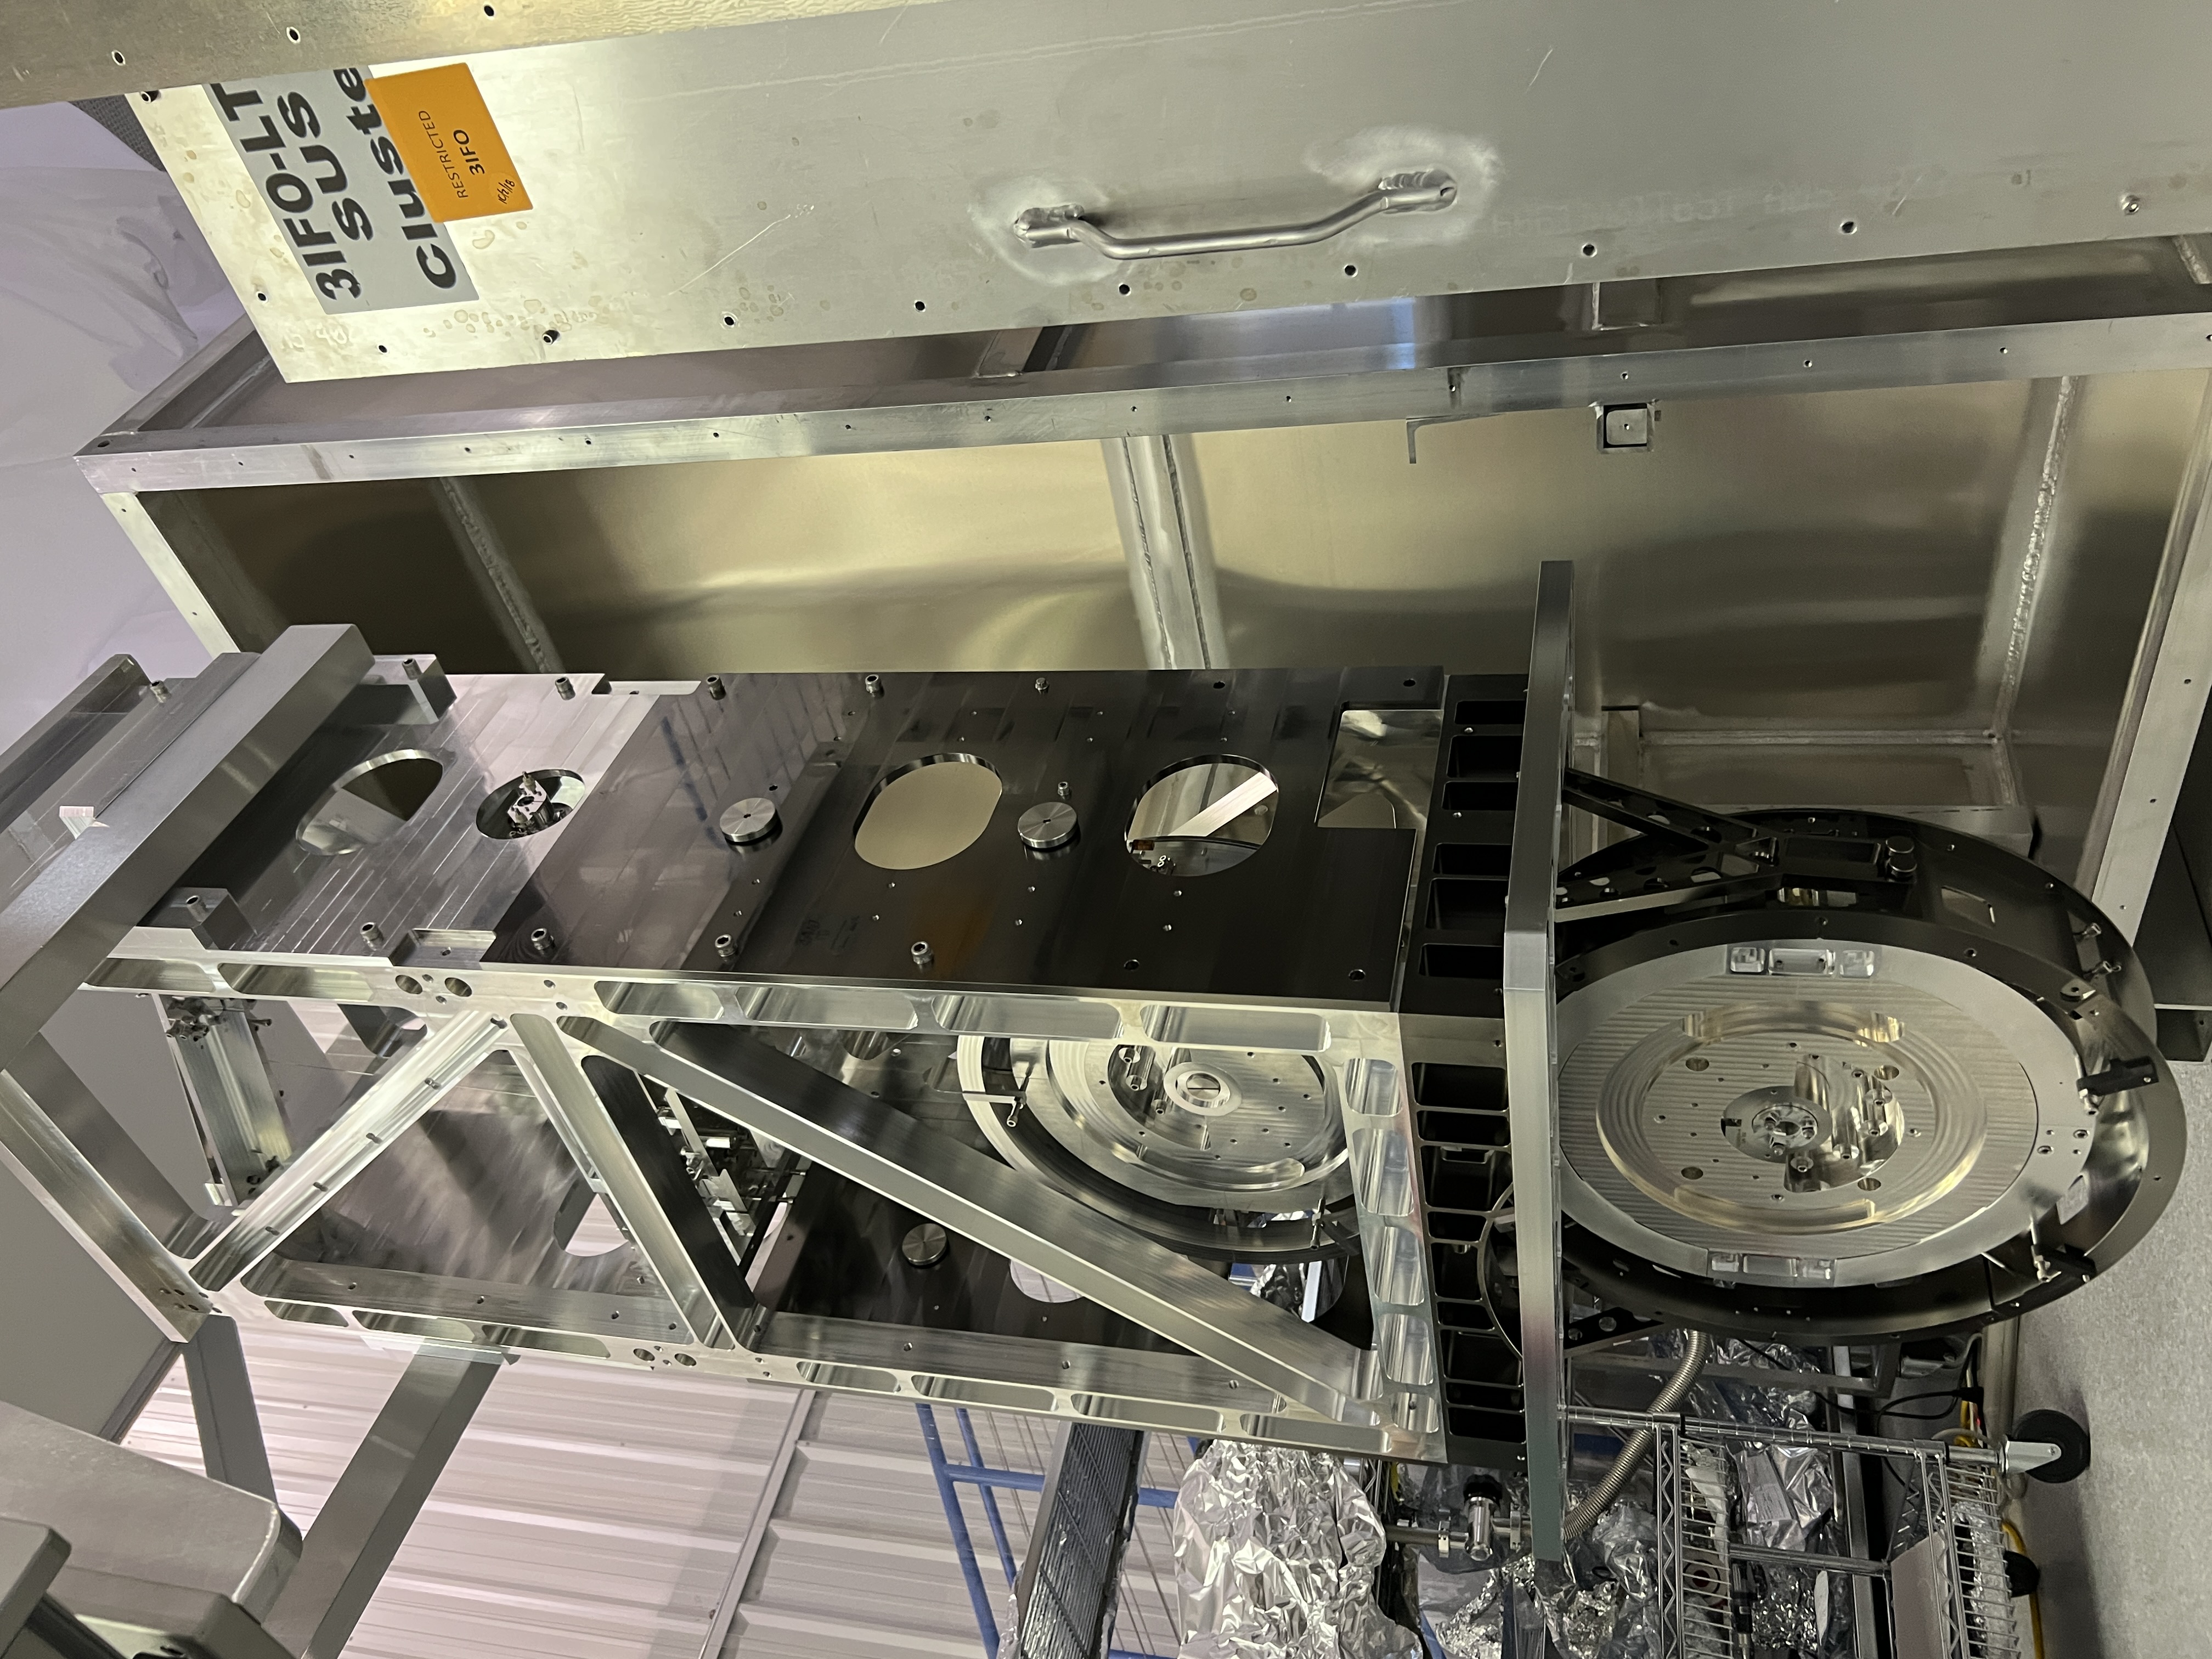
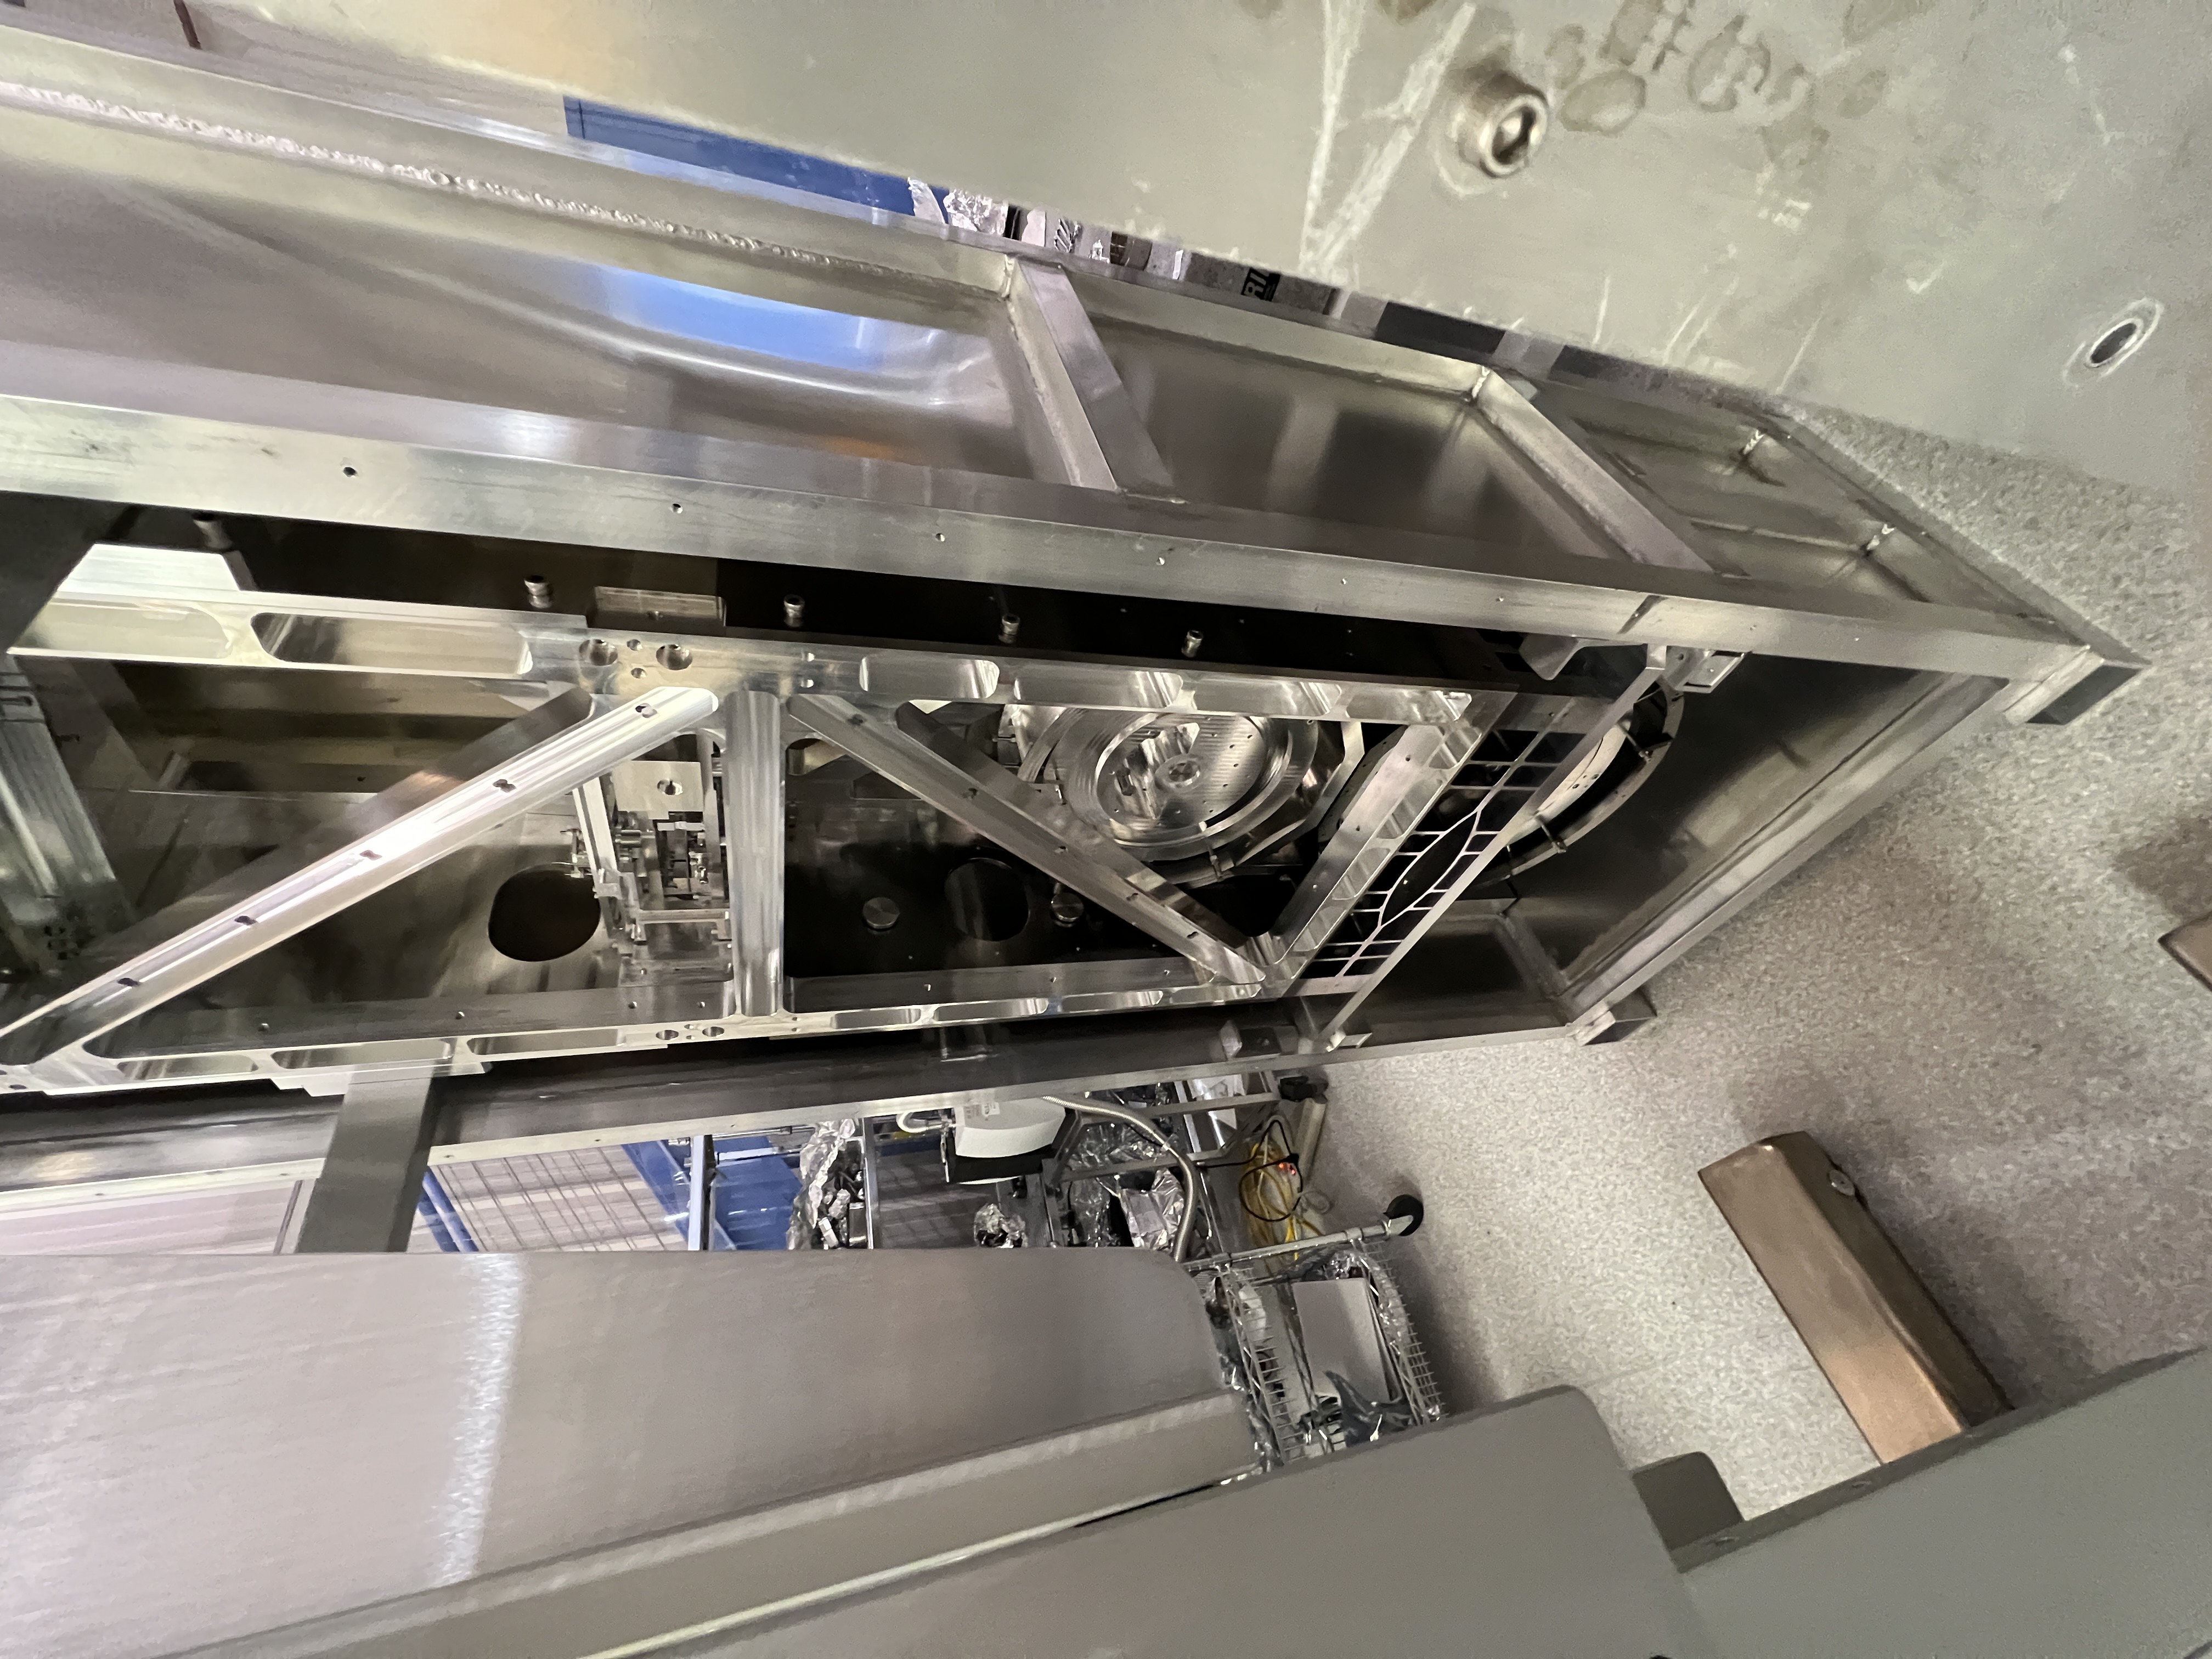
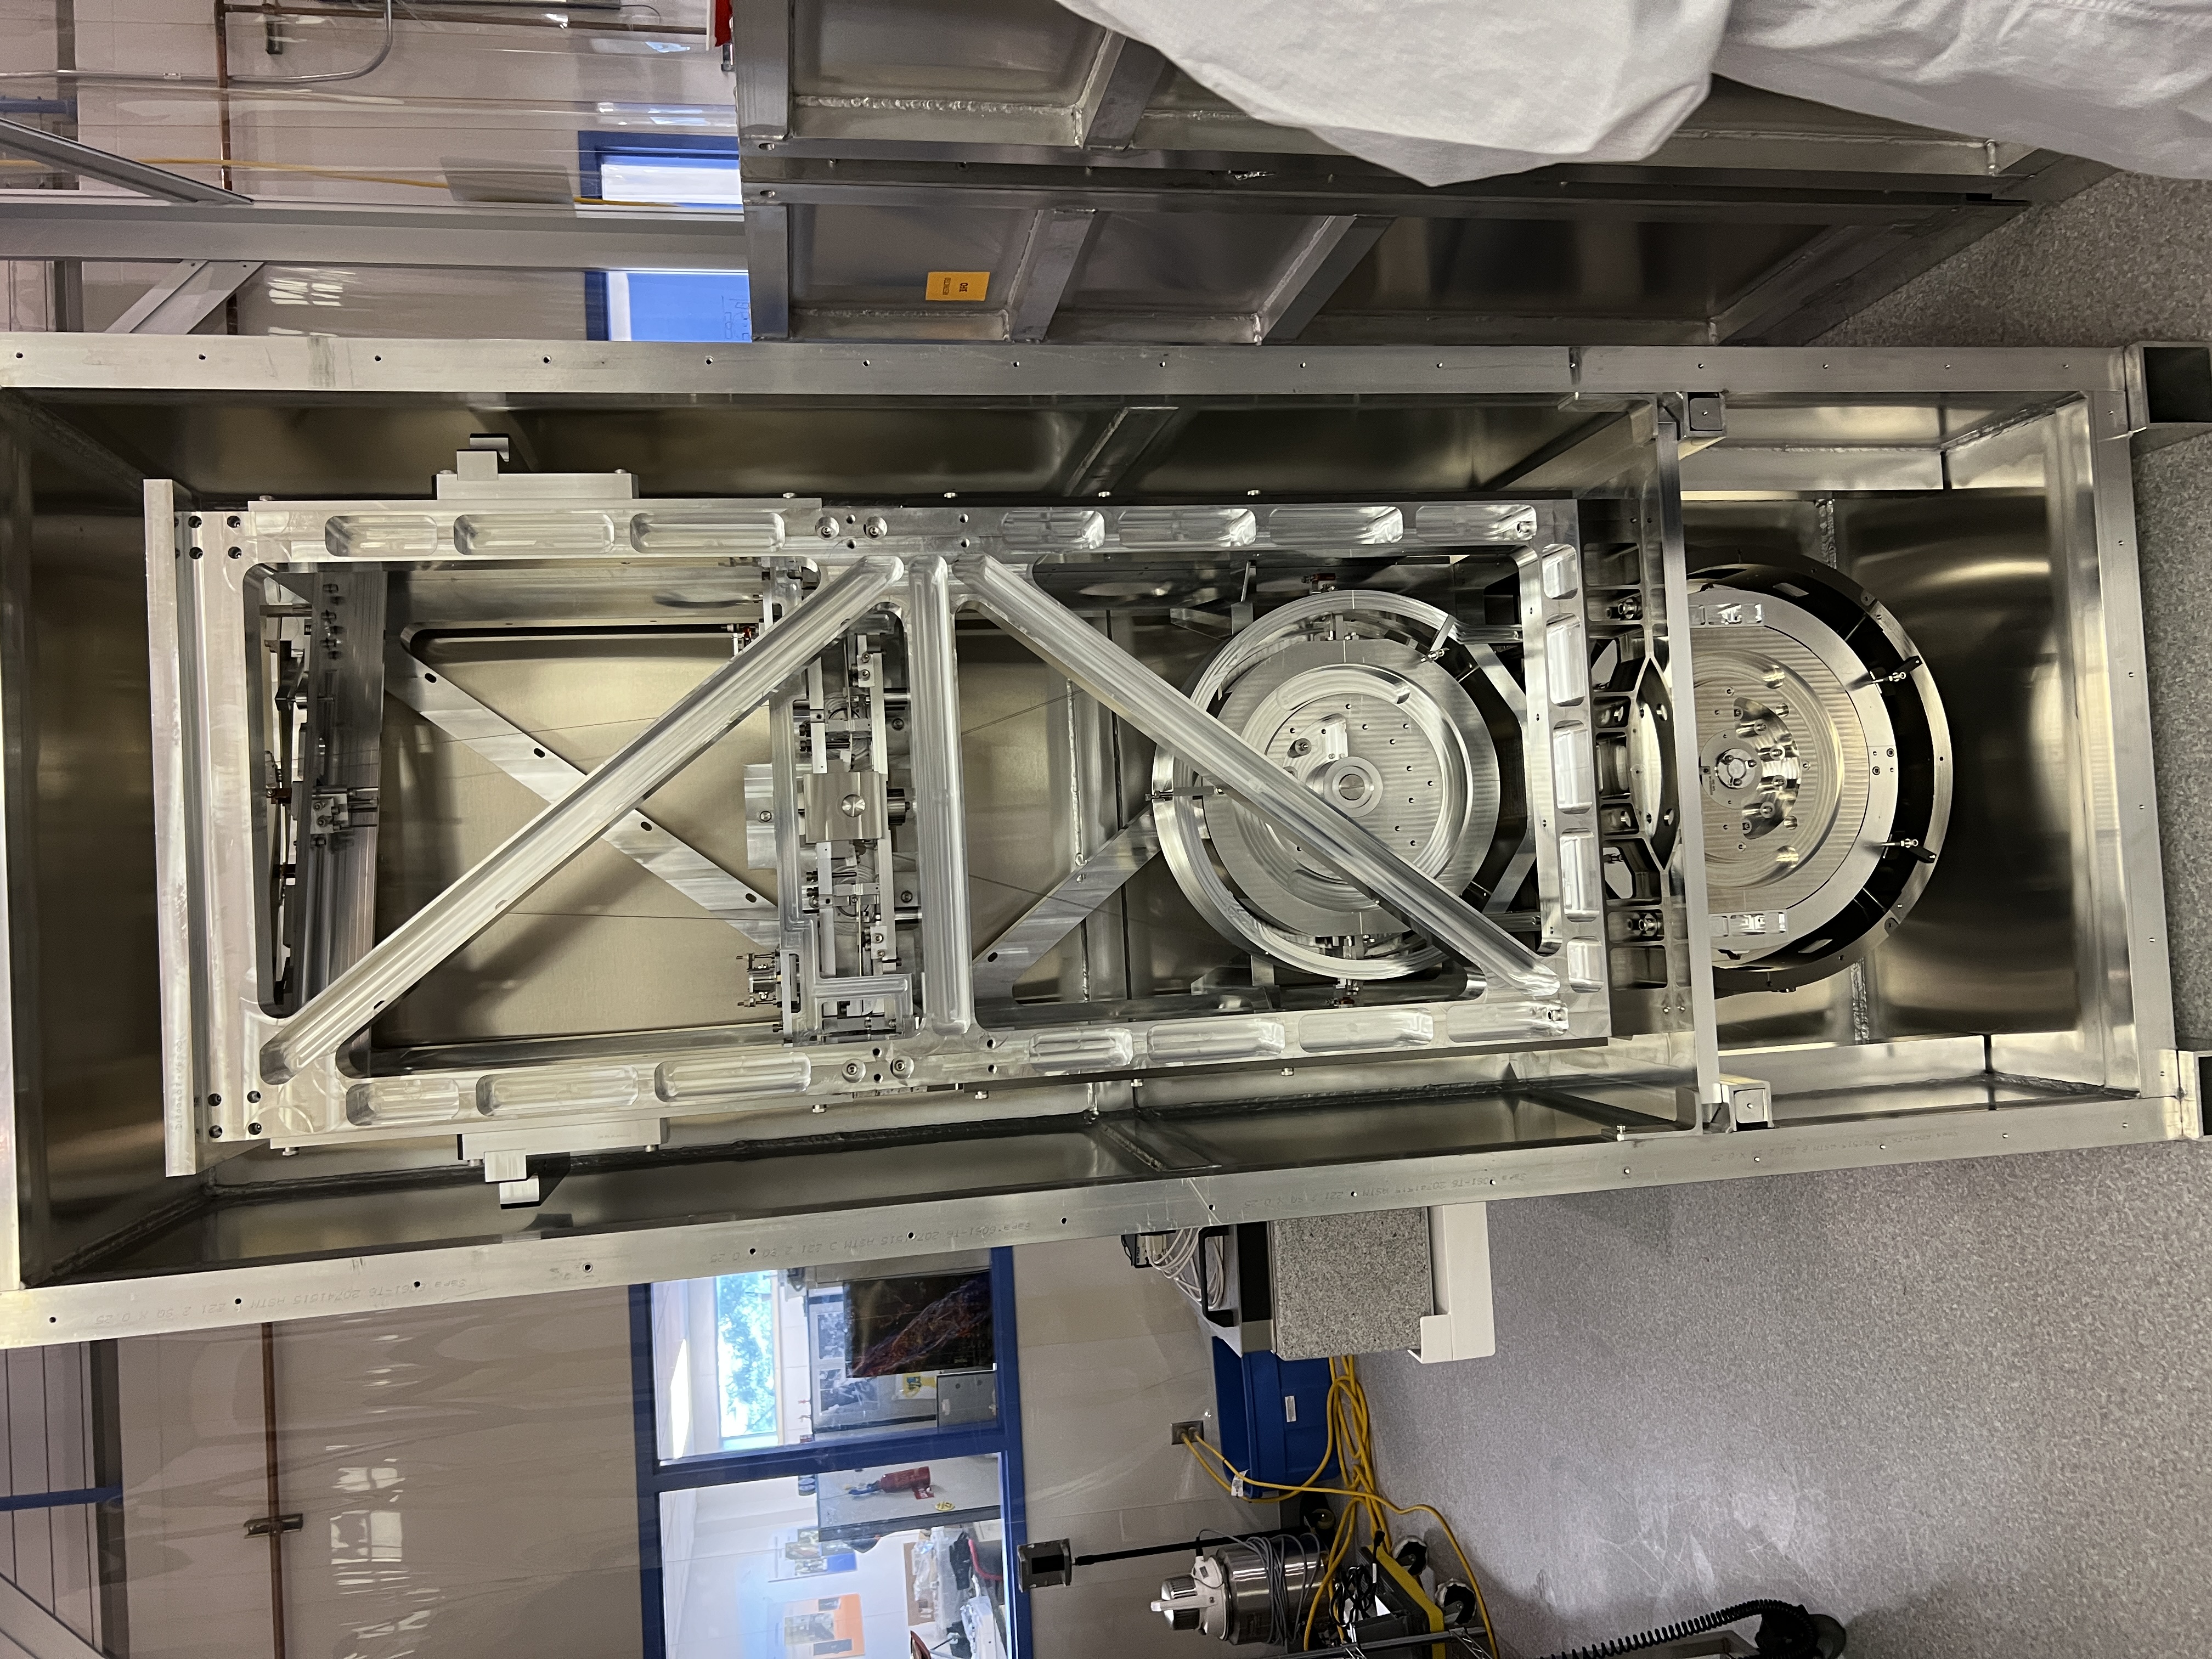
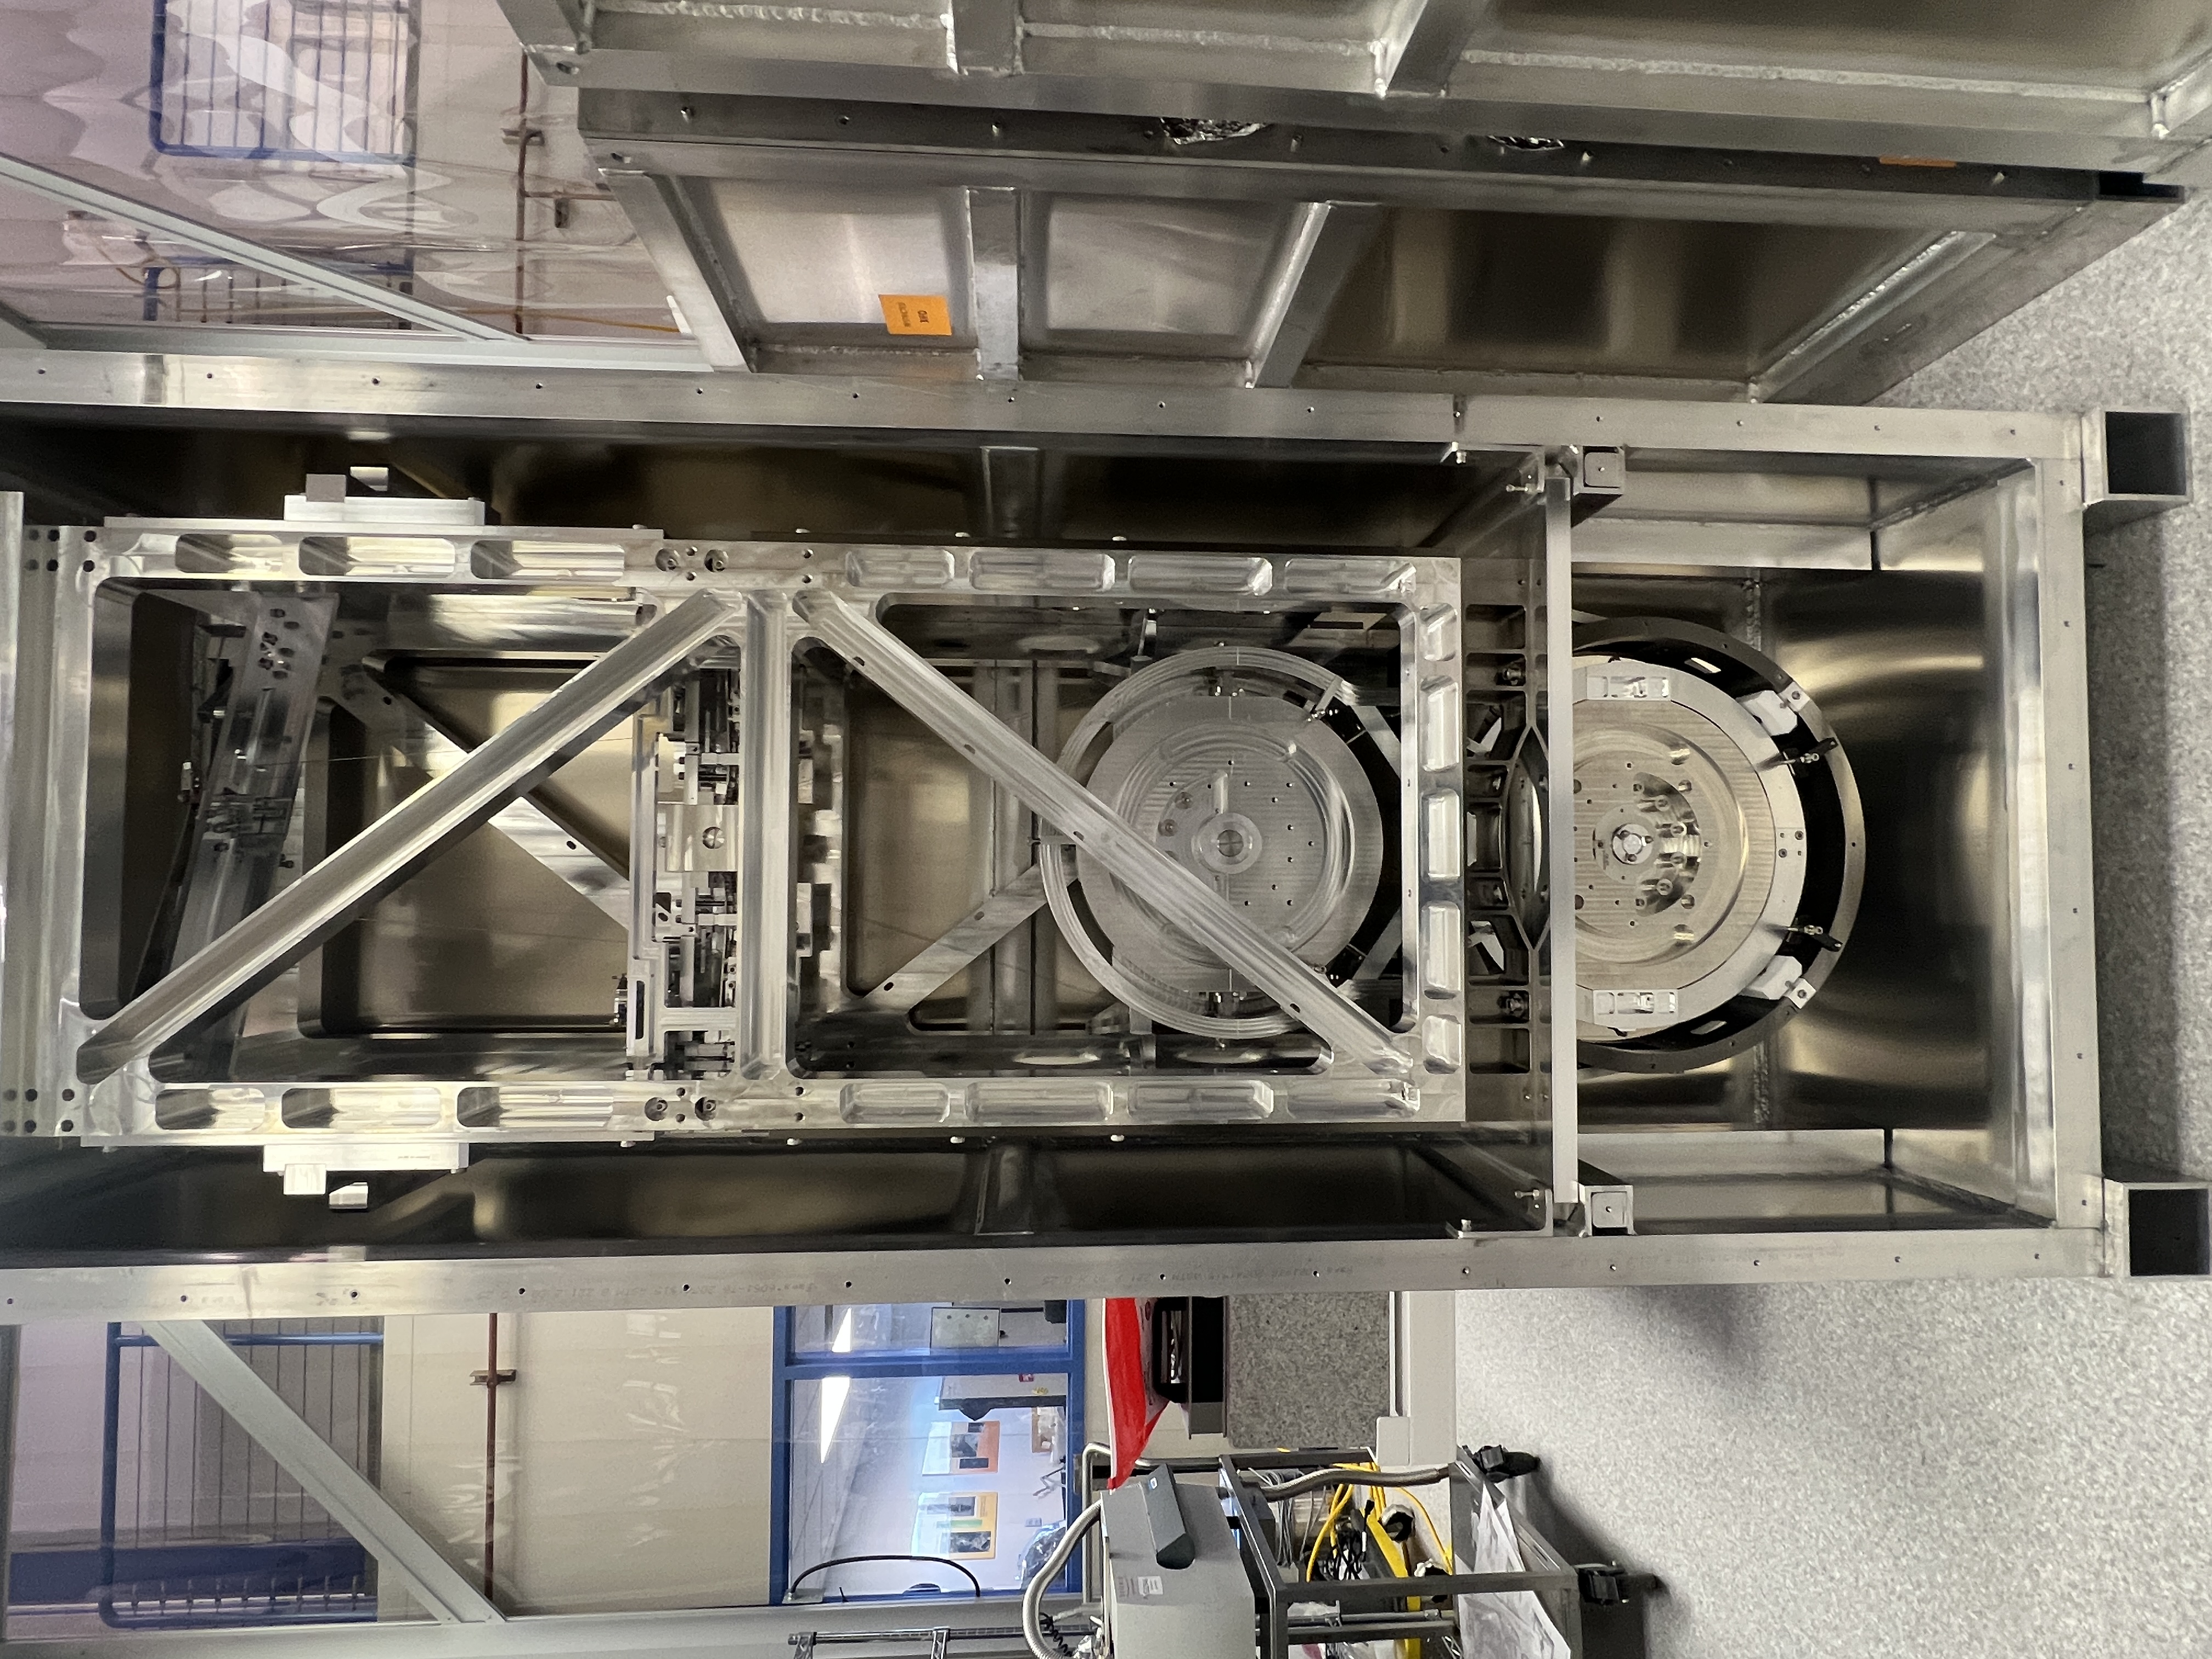
Here are some further notes and photos of the replacement work:
Tagging for EPO photos