TITLE: 02/06 Day Shift: 1530-0030 UTC (0730-1630 PST), all times posted in UTC
STATE of H1: Observing at 154Mpc
OUTGOING OPERATOR: Oli
CURRENT ENVIRONMENT:
SEI_ENV state: CALM
Wind: 16mph Gusts, 11mph 3min avg
Primary useism: 0.04 μm/s
Secondary useism: 0.28 μm/s
QUICK SUMMARY:
H1's been locked 5.75hrs. Ryan-C mentioned the issues with IY5 violin mode, but sounds like he has a setting that is slowly damping it down. If there is a lockloss, I need to do a LOAD of the VIOLIN DAMP guardian (so the IY5 damps with 0 gain) & then enter the settings which work for him.
Microseism has been trending down over the last 8-ish hours and winds look a little calmer compared to 24hrs ago.
TITLE: 02/05 Day Shift: 1530-0030 UTC (0730-1630 PST), all times posted in UTC
STATE of H1: Observing at 153Mpc
INCOMING OPERATOR: Corey
SHIFT SUMMARY: 1 lockloss with an easy relock, we've been locked for 6 hours.
LOG:
Start Time | System | Name | Location | Lazer_Haz | Task | Time End |
---|---|---|---|---|---|---|
17:16 | SAFETY | LASER SAFE ( \u2022_\u2022) | LVEA | SAFE! | LVEA SAFE!!! | 19:08 |
17:13 | PSL | Jason | CR | N | ISS loop adjustment | 17:15 |
17:15 | CAL | Tony | PCAL lab | Y | PS11 measurement | 17:40 |
18:03 | FAC | Kim | Receiving | N | Cardboard | 18:54 |
18:12 | VAC | Travis | LVEA | N | Quick part check near high bay | 18:16 |
19:31 | FIT | Matt | Xarm | N | Runnin' | 20:13 |
21:36 | ISC | Matt | Optics lab | N | Cheeta optics mounting | 22:28 |
21:40 | CAL | Tony | PCAL lab | Y | PCAL work | 22:28 |
17:10 UTC lockloss
18:34 UTC Observing
ITMY mode5/6s damping didn't seem to be going well today, I've been monitoring it on DTT after seeing the tall line on DARM and the DCPD min/max plot looking flat. I've found some new settings that seem to be bringing it down, based on the long & short monitors and DTT but more testing is needed to confirm. The new settings are FM5 + FM6 + FM10 G= -0.01, removing FM8. (Tagging SUS, OPS). I've set the gain to 0 in lscparams but I have not loaded the VIOLIN_DAMPING guardian.
21:52 UTC superevent S250205ee
00:00 - 00:03 UTC we dropped observing as the SUS_PI guardian fought (successfully) PI 24 in the new "XTREME_PI_DAMPING" state
Sheila, Camilla, follow on from 82640.
We made some more changes to SQZ_MANGER to hopefully simplify it:
Saved and added to svn but not loaded.
Once reloaded, as states have been changed, any open SQZ_MANAGER medm's should be closed and reopened.
I did load this today, there don't seem to have been any issues in this lock.
Sheila and I are continuing to check various PD calibrations (82260). Today we checked the POP A LF calibration.
Currently there is a filter labeled "to_uW" that is a gain of 4.015. After some searching, Sheila tracked this to an alog by Kiwamu, 13905, with [cnts/W] = 0.76 [A/W] x 200 [Ohm] x 216 / 40 [cnts/V]. Invert this number and multiply by 1e6 to get uW/ct.
Trusting our recalibration of IM4 trans, we have 56.6 W incident on PRM. We trust our PRG is about 50 at this time, so 2.83 kW are in the PRC. PR2 transmission is 229 ppm (see galaxy optics page). Then, the HAM1 splitter is 5.4% to POP (see logs like 63523, 63625). So we expect 34 mW on POP. At this time, there was about 30.5 mW measured on POP according to Kiwamu's calibration.
I have added another filter to the POP_A_LF bank called "to_W_PRC", that should calibrate the readout of this PD to Watts of power in the PRC.
POP_A_LF = T_PR2 * T_M12 * PRC_W, and T_PR2 is 229 ppm and T_M12 is 0.054. I also added a gain of 1e-6 since FM10 calibrates to uW of power on the PD.
Both FM9 (to_W_PRC) and FM10 (to_uW) should be engaged so that POP_A_LF_OUT reads out the power in the PRC.
I loaded the filter but did not engage it.
More thoughts about these calibrations!
I trended back to last Wednesday to get more exact numbers.
input power = 56.8 W
PRG = 51.3
POP A LF (Kiwamu calibration) = 30.7 mW
predicted POP A LF = 0.054 * 229 ppm * 56.8 W * 51.3 W/W = 36 mW
ratio = 30.7 mW / 36 mW = 0.852
If the above calibrations of PRG and input power are correct, we are missing about 15% of the power on POP.
Sheila, Mayank
We tried measuring the width of aperture of scrapper baffle in front of PR2.
The plan was to change the beam spot on PR2 mirror while simultaneosly monitoring the circulating power in X (ASC-X_PWR_CIRC_OUT) ( It is a caliberated channel derived from ASC-X_TR_A_SUM_OUT_16 and ASC-X_TR_B_SUM_OUT_16) . When the beam starts hitting the edge of aperture of scrapper baffle the circulating power in X will drop.
In oder to change the PR2 beam spot. We changed the PR3 yaw slider while activating PR2spotmove script (It adjust the slider values of PR2 and PRM and IM4 in such a way the the light going from PR3 to the the Interferometer remaines unchanged while the spot on PR2 moves.)
Steps we followed
A2L procedure
What we did
2. Perfomed A2L on the three mirrors PR2 PRM PR3 to estimate original position. The gains which minimized the three injection peaks were.
3.The PR3 Yaw slider was decreased to 75.2 the such that the TRX value dropped to 0.047 (6%)
Perfomed A2L on the three mirrors PR2 PRM PR3 to estimate one edge of the Baffle. The gains which minimized the three injection peaks were
4. The PR3 Yaw slider was increased to 103 such that the TRX value dropped to 0.047 (6%)
Perfomed A2L on the three mirrors PR2 PRM PR3 to estimate other edge of the Baffle. The gains which minimized the three injection peaks were
As expected the beam spot does not move on PR3 and PRM.
The PR2 beam spot moved by 1.612 mm.
Thoughts: Sheila suggested that this movement of 1.612 mm is too small to see the clipping at the baffle. Most likely the reduction in circulating power was due to something else. To probe this, we tried to go further on the PR3 Yaw sliders (greater than the 103 and less than 75.2) however the X arm was not locking. This was probably because we were not getting the required PDH signal for Xarm locking on the POP port due to misalignment. Sheila suggested that we can
Wed Feb 05 10:09:57 2025 INFO: Fill completed in 9min 54secs
Gerardo confirmed a good fill curbside. TCmins [-81C, -79C] OAT (0C, 32F) DeltaTempTime 10:09:58
The attached screenshot shows what's happened with out OMC ASC offsets over the laser two weeks.
On Jan 21st, Jennie W measured the OMC ASC offsets 82383, but there was a sign error in putting them in so kappa C decreased, the range was also lower during this time with the wrong offsets. During Monday's commissioning time we understood the error and went back to the settings before the change, and kappa C increased more than we expected it to. There was also some recovery of range which was probably because the squeezing improved with the fixed OMC alignment, but could also be becuse of Ibrahim improved A2L, then range is still not as good as it was 3 weeks ago.
Yesterday there was a problem where the ASC safe.snap file was overwritten with many wrong values, perhaps the observe settings were erroneously saved to the safe (Dave is investigating) 82637. This ended up blasting large numbers to the PUMs, and ringing up the violin modes, which cost us an hour of observing time and high violins over night, but it could have had worse consequences if we hadn't caught it quickly.
Dave helped us recover by reverting the safe.snap to a week old file, which had the wrong OMC QPD offsets in it. Then when Corey got to observe, he accepted the OMC offsets 82643, which meant that we had lower optical gain and worse squeezing overnight.
Now we have lost lock and I've edited the safe.snap to have the previous (better) offsets, this means that when we get to observe we should accept differences, and check that kappa c is 1.01 or 1.02 after we thermalize.
18:34 UTC Observing, ASC SDF diffs accepted.
WP12248 OMC0 double duotone frequency
Erik, EJ, Jonathan, Dave:
The duotone frequency generated by the LIGO Timing Card in h1omc0's IO Chassis was increased from (960, 961)Hz to (1920, 1921)Hz
The available frequencies are hard-coded in the FPGA code on the timing card. The IOP model can request one of these frequencies, configued by the following line in the CDS params block:
duotone_frequency=1920
All models on h1omc0 were restarted with the new iop model:
Tue04Feb2025
LOC TIME HOSTNAME MODEL/REBOOT
12:24:55 h1omc0 h1iopomc0
12:25:09 h1omc0 h1omc
12:25:23 h1omc0 h1omcpi
An identical change was made at LLO on l1lsc0's Timing Card.
TITLE: 02/05 Day Shift: 1530-0030 UTC (0730-1630 PST), all times posted in UTC
STATE of H1: Observing at 156Mpc
OUTGOING OPERATOR: Oli
CURRENT ENVIRONMENT:
SEI_ENV state: CALM
Wind: 10mph Gusts, 7mph 3min avg
Primary useism: 0.01 μm/s
Secondary useism: 0.36 μm/s
QUICK SUMMARY:
TITLE: 02/05 Eve Shift: 0030-0600 UTC (1630-2200 PST), all times posted in UTC
STATE of H1: Preventive Maintenance
INCOMING OPERATOR: Oli
SHIFT SUMMARY:
H1 made it back to Observing about an hour into the shift---mainly held up by rung up violin modes which took almost an hour to damp down. The violins are still high, but slowly coming down.
Range does look about 4-6Mpc lower for this lock. Ran the Range Comparison Check measurement between current lock and about 24hrs ago during the long 20hr lock. See attached plots run via ( python3 range_compare.py 1422710713 1422768313 ).
LOG:
Attached are ASC SDF Diffs which were ACCEPTED to get H1 to OBSERVING.
As per WP 12314 we did work towards installing new digital video controller computers. In the morning Jonathan Hanks and Austin Farias installed a new switch (sw-msr-video1) in the video rack. This switch is a 10g fiber switch and will be used to carry the camera lan traffic to the new h1digivideo computers. In the afternoon Dave removed some of the old conlog computers to make room for h1digivideo4. In the afternoon Dave/Jonathan/Patrick installed h1digivideo4, ran fiber from it to sw-msr-video1. Then we installed the OS via a PXE boot and preseed. H1digivideo has been added to puppet to get the config in place. Jonathan and Patrick installed a test camera in the MSR (cam-msr-test) on the camera vlan in order to do testing of h1digivideo4 prior to moving it fully into production. We are leaving the work permit open as Dave will be removing more of the old conlog machines tomorrow. At this point we have not removed analog video equipment. Dave has been making sure we have good drawings of the current setup before we dismantle anything on the analog side.
Today Francisco Llamas and I took PS4 down the EndY to do a run of the mill End station measurement following the instructions outlined on the T1500062 PCAL End Station Power Sensor Responsivity Ratio Measuremets: Procedures and Log .
Running the following command from a cds directory /ligo/gitcommon/Calibration/pcal/O4/ES/scripts/pcalEndstationPy
python generate_measurement_data.py --WS "PS4" --date '2024-12-10'
Reading in config file from python file in scripts
../../../Common/O4PSparams.yaml
PS4 rho, kappa, u_rel on 2024-12-10 corrected to ES temperature 298.5 K :
-4.7042776679256315 -0.0002694340454223 4.3277259408925024e-05
Copying the scripts into tD directory...
Connected to nds.ligo-wa.caltech.edu
martel run
reading data at start_time: 1422728370
reading data at start_time: 1422728815
reading data at start_time: 1422729150
reading data at start_time: 1422729720
reading data at start_time: 1422730125
reading data at start_time: 1422730470
reading data at start_time: 1422730600
reading data at start_time: 1422731280
reading data at start_time: 1422731630
Ratios: -0.5336711312890802 -0.5439438081494363
writing nds2 data to files
finishing writing
Background Values:
bg1 = 18.798280; Background of TX when WS is at TX
bg2 = 5.347941; Background of WS when WS is at TX
bg3 = 18.777599; Background of TX when WS is at RX
bg4 = 5.320714; Background of WS when WS is at RX
bg5 = 18.859360; Background of TX
bg6 = 0.059221; Background of RX
The uncertainty reported below are Relative Standard Deviation in percent
Intermediate Ratios
RatioWS_TX_it = -0.533671;
RatioWS_TX_ot = -0.543944;
RatioWS_TX_ir = -0.526984;
RatioWS_TX_or = -0.536057;
RatioWS_TX_it_unc = 0.052568;
RatioWS_TX_ot_unc = 0.055834;
RatioWS_TX_ir_unc = 0.056378;
RatioWS_TX_or_unc = 0.059744;
Optical Efficiency
OE_Inner_beam = 0.987336;
OE_Outer_beam = 0.985232;
Weighted_Optical_Efficiency = 0.986284;
OE_Inner_beam_unc = 0.041823;
OE_Outer_beam_unc = 0.044559;
Weighted_Optical_Efficiency_unc = 0.061112;
Martel Voltage fit:
Gradient = 1637.895833;
Intercept = 0.036157;
Power Imbalance = 0.981114;
Endstation Power sensors to WS ratios::
Ratio_WS_TX = -0.927975;
Ratio_WS_RX = -1.384608;
Ratio_WS_TX_unc = 0.044554;
Ratio_WS_RX_unc = 0.037548;
=============================================================
============= Values for Force Coefficients =================
=============================================================
Key Pcal Values :
GS = -5.135100; Gold Standard Value in (V/W)
WS = -4.704278; Working Standard Value
costheta = 0.988362; Angle of incidence
c = 299792458.000000; Speed of Light
End Station Values :
TXWS = -0.927975; Tx to WS Rel responsivity (V/V)
sigma_TXWS = 0.000413; Uncertainity of Tx to WS Rel responsivity (V/V)
RXWS = -1.384608; Rx to WS Rel responsivity (V/V)
sigma_RXWS = 0.000520; Uncertainity of Rx to WS Rel responsivity (V/V)
e = 0.986284; Optical Efficiency
sigma_e = 0.000603; Uncertainity in Optical Efficiency
Martel Voltage fit :
Martel_gradient = 1637.895833; Martel to output channel (C/V)
Martel_intercept = 0.036157; Intercept of fit of Martel to output (C/V)
Power Loss Apportion :
beta = 0.998844; Ratio between input and output (Beta)
E_T = 0.992544; TX Optical efficiency
sigma_E_T = 0.000303; Uncertainity in TX Optical efficiency
E_R = 0.993693; RX Optical Efficiency
sigma_E_R = 0.000304; Uncertainity in RX Optical efficiency
Force Coefficients :
FC_TxPD = 9.152911e-13; TxPD Force Coefficient
FC_RxPD = 6.219661e-13; RxPD Force Coefficient
sigma_FC_TxPD = 4.976837e-16; TxPD Force Coefficient
sigma_FC_RxPD = 3.035146e-16; RxPD Force Coefficient
data written to /ligo/gitcommon/Calibration/pcal/O4/ES/measurements/LHO_EndY/tD20250204
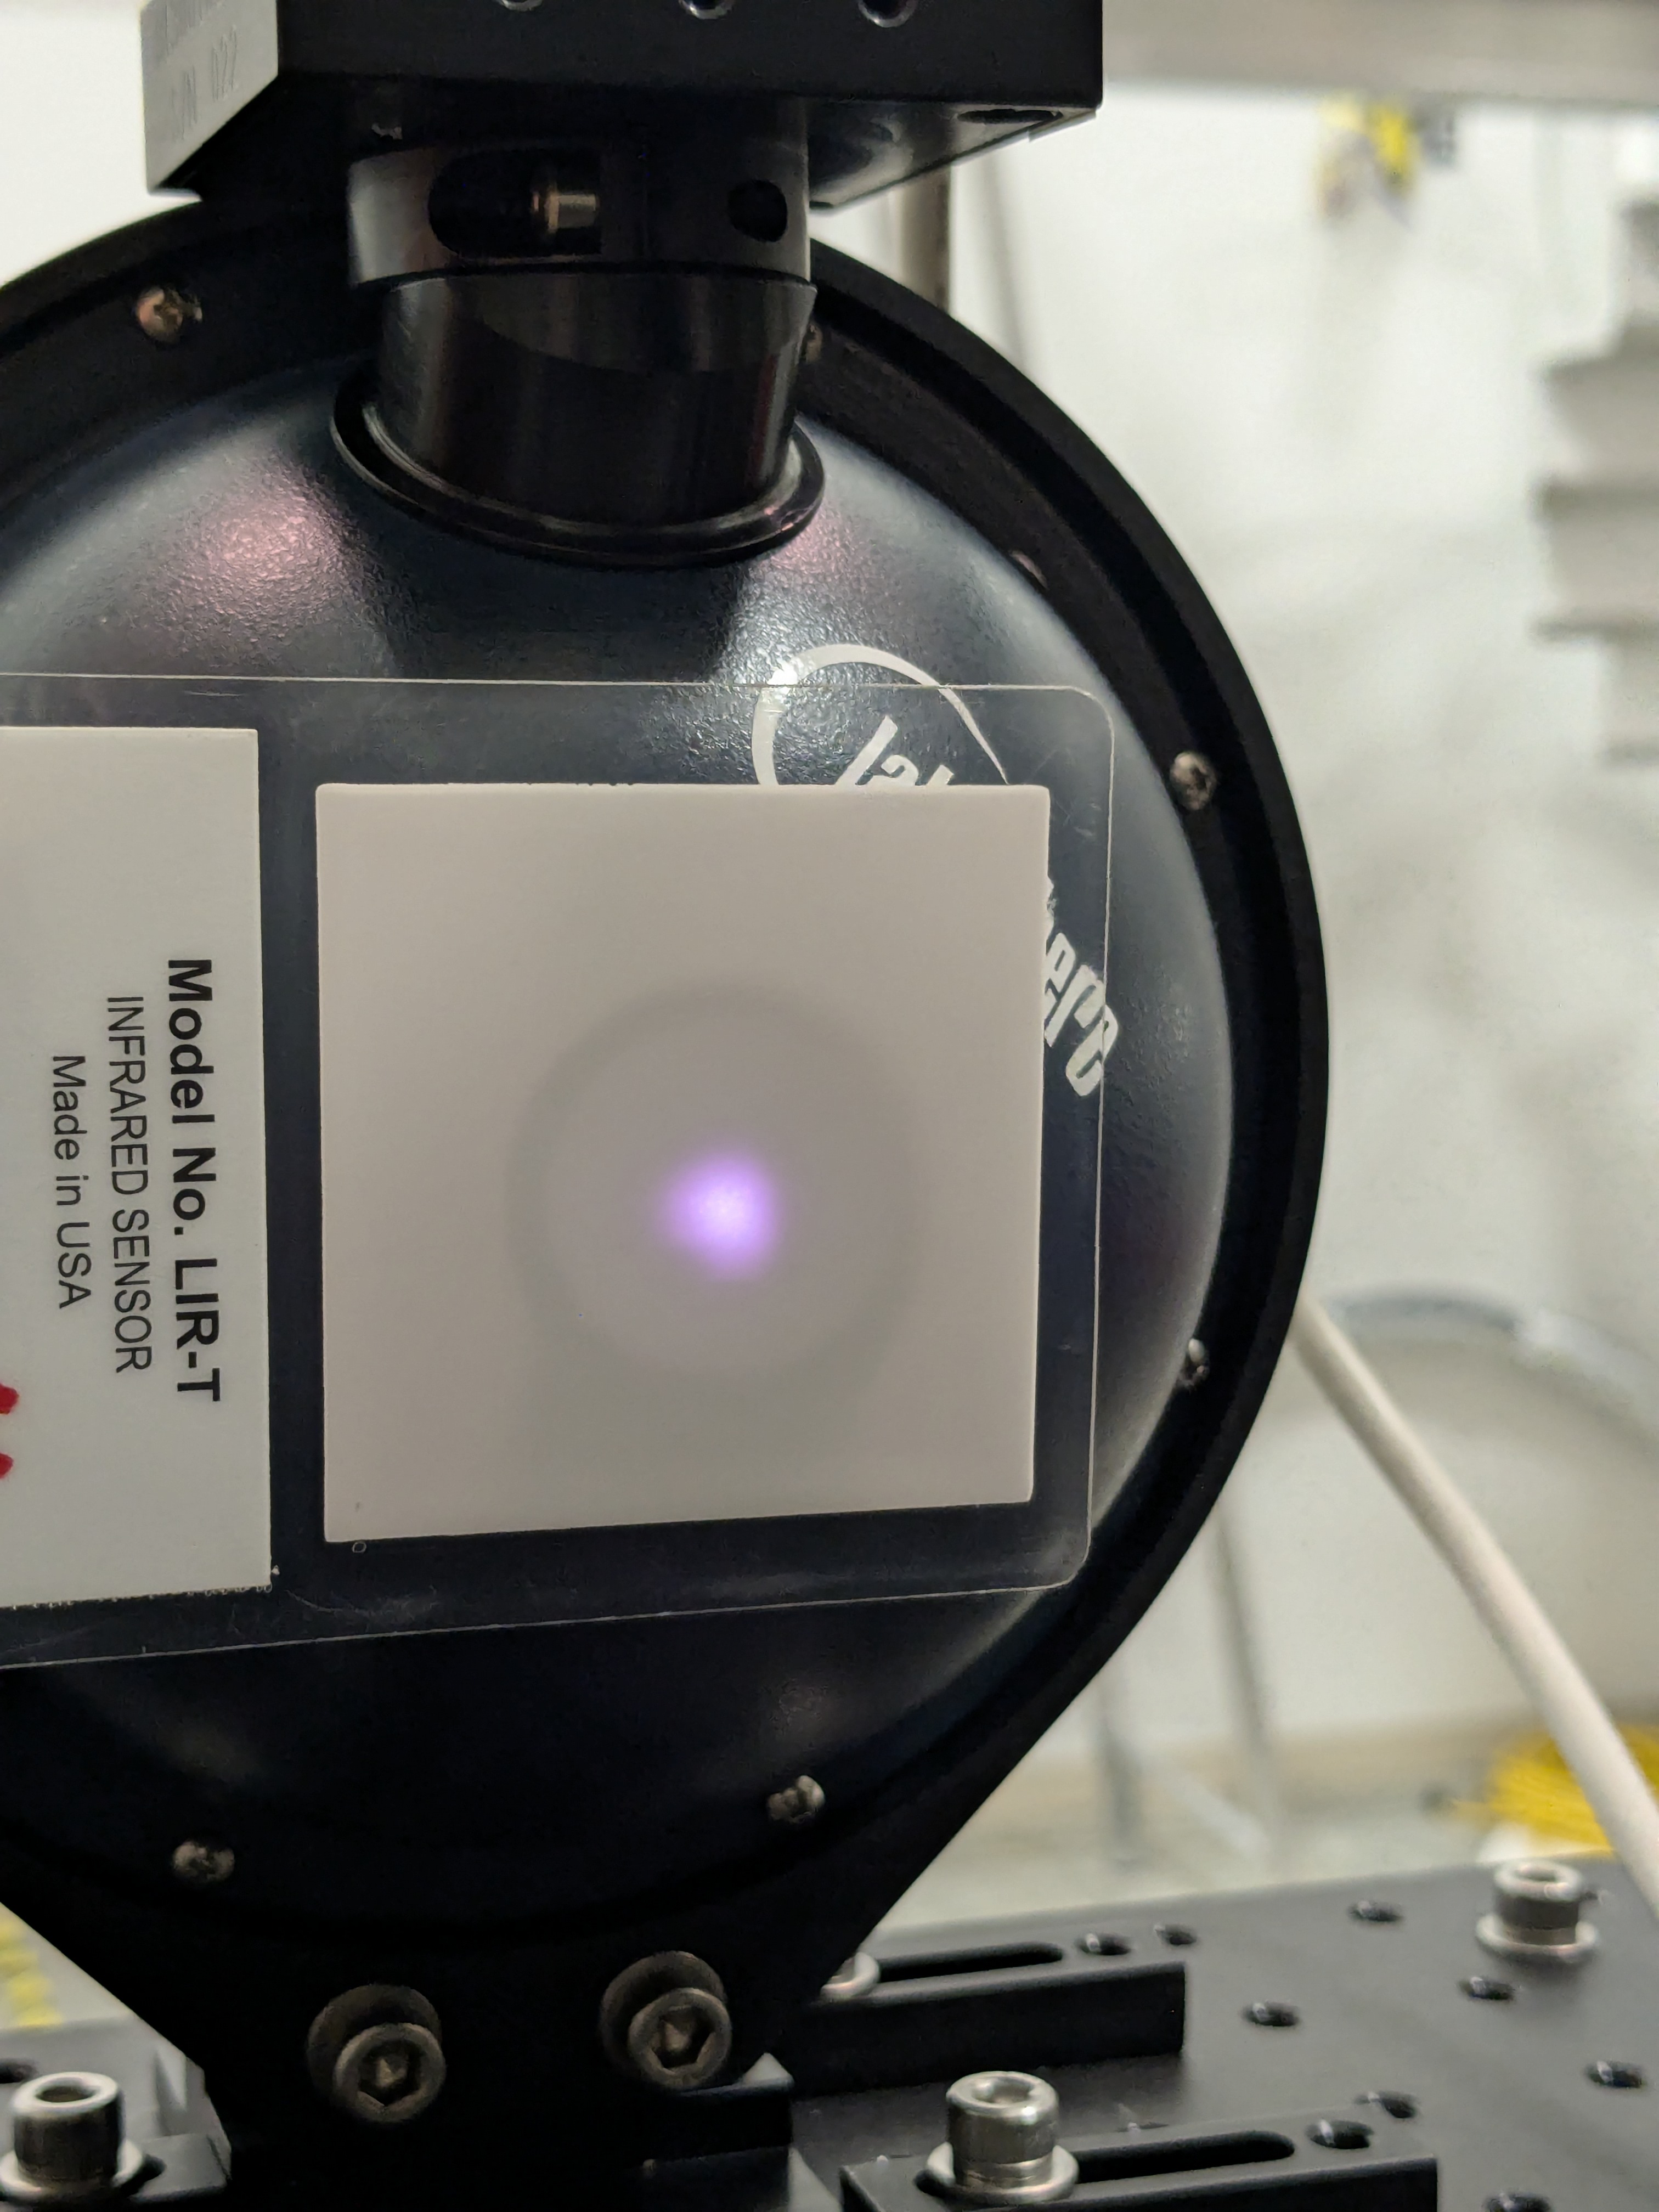
Beam spot picture
Martel_Voltage_test.png
WS_at_TX.png
WS_at_RX.png
WS_at_RX_BOTH_BEAMS.png
LHO_EndY_PD_ReportV5.pdf
Sheila, Camilla
SQZ_MANAGER had go overcrowded so we removed some of the unused states to make the graph simpler to understand and remove the number of states that could be accidently mis-clicked and cause issues. Original graph and new graph attached.
Changes:
Still want to do a larger deep dive into what SQZ_MANGER and each of it's subordinates are doing so that the log is easier for the operators to read and troubleshoot from. Also we expect we can change "OFFLOAD_SQZ_ASC" to be a "manual to" state that can be completed independently of if we're in SQZ or no sqz. Anyone with SQZ_MANGER open should close and reopen.
[M. Todd, C. Compton, G. Vajente, S. Dwyer]
To understand the effect of the Relative Intensity Noise (RIN) of the CO2 laser (Access 5W L5L) proposed for CHETA on the DARM loop, we've done a brief study to check whether the addition of the RIN as displacement noise in deltaL will cause saturation at several key points in the DARM loop such as the ESD driver and DCPDs. The estimates we've made on the RIN at these points are calibrated with the DARM model in pydarm, which models the DARM loop during Nominal Low Noise; however, appropriate checks have been made that these estimates are accurate or at least over-estimating of the effects during lower power stages (when the CHETA laser will be on).
This estimate is done by propagating displacement noise in deltaL (how CHETA RIN is modeled, m/rtHz) to counts RMS of the ESD DAC. The RMS value of this should stay below 25% or so of the saturation level of the DAC, which is 2**19. To do this, we multiply the loop suppressed CHETA RIN (calibrated into DARM) by the transfer functions mapping deltaL to ESD counts (all are calculated at NLN using pydarm).
The CHETA RIN in ESD cts RMS is 0.161% of the saturation level, and in L2 coil cts RMS is 1.098%, and in L3 coil cts RMS is 0.015%. It is worth noting that the CHETA RIN RMS at these points is around 10x higher than that which we expect with just DARM during NLN.
We also checked to make sure that the ESD cts RMS during power-up states is not higher than that during NLN, meaning the calibration using NLN values gives us a worst case scenario of the CHETA RIN impact on ESD cts RMS.
List of Figures:
1) Loop Model Diagram with labeled nodes
2) CHETA RIN in ESD cts RMS
3) CHETA RIN in L2coil cts RMS
4) CHETA RIN in L1coil cts RMS
5) DARM Open Loop Gain - pydarm
6) DARM Sensing Function - pydarm
7) DARM Control Function (Digitals) - pydarm
8) Transfer Function: L3DAC / DARM_CTRL - pydarm
9) Transfer Function: L2DAC / DARM_CTRL - pydarm
10) Transfer Function: L1DAC / DARM_CTRL - pydarm
11) ASD/RMS ESD cts during power-up states - diaggui H1:SUS-ETMX-L3_MASTER_OUT_UL_DQ
12) CHETA RIN ASD (raw)
This estimate is done by propagating displacement noise in deltaL (how CHETA RIN is modeled, m/rtHz) to counts RMS of the DCPD ADC. The RMS value of this should stay below 25% or so of the saturation level of the DAC, which is 2**15. To do this, we multiply the loop suppressed CHETA RIN (calibrated into DARM) by the transfer functions mapping deltaL to DCPD ADC counts, using the filters in Foton files. This gives us the whitened ADC counts, so by multiplying by the anti-whitening filter we get the unwhitened DCPD ADC cts RMS, which is what is at risk of saturation.
The CHETA RIN in DCPD cts RMS is 3.651% of the saturation level. Again, it is worth noting that the CHETA RIN RMS at this point is around 10x higher than that which we expect with just DARM during NLN.
We also checked to make sure that the DCPD-A ADC channel is coherent with DARM_ERR. In short, it is up to 300Hz, where controls noise dominates our signal -- after 300Hz shot noise becomes the dominant noise source and reduces our coherence.
List of Figures:
1) Loop Model Diagram with labeled nodes
2) CHETA RIN in DCPD ADC cts RMS
3) Transfer Function: DCPD-ADC / DELTAL_CTRL
4) Coherence: DCPD-A / DARM_ERR
Calibrating CHETA RIN to ESD cts RMS
Calibrating CHETA RIN to DCPD ADC cts RMS
Previous related alogs:
1) alog 82456
Is the propagation of RIN into displacement consistent with the photothermal calculations done by Braginsky and Cerdonio? One can use Eq. 8 of Braginsky (1999) except with the replacement of the absorbed shot noise power 2 hbar omega_0 Wabs with the absorbed classical laser power. Then using
alpha = 0.6 ppm/K
sigma = 0.17
rho = 2200 kg/m^3
C = 700 J/(kg K)
r0 = 53 mm / sqrt(2)
I find sqrt(Sxx) = 1.6e-18 m/rtHz as the displacement from a single test mass assuming a CHETA RIN of 1e-5/rtHz and an absorbed power of 1 W.
[M. Todd, E. Hall]
Indeed the propagation of RIN int DARM laid out in T050064 is consistent with the work done by Braginsky and Cerdonio. The calibration follows the form in Figure 1.
Attached is a comparison plot of the two propagtions, using the parameters set above in Evan's comment.
Updating this post with some busier plots that show how other CO2 laser noise is projected into the various stages. As well as adding flat RIN curve propagations to give an intuition as to what RINs we do not need to even worry about in NLN.
I've also reattached the codes used because of a correction to the way the ASD integration was being done.
The plots also extend to lower frequency to show the behavior of the RIN propagation to each channel (mostly falling off below 10Hz). This is why we take the "RMS" value to be the integrated value of the ASD at 10Hz, and compare that to the saturation limit. It also gives a better display of the RMS from DARM in NLN at propagated to the above channels, showing that overall the RIN should have a small effect on these drives and ADCs.