I can't find the right alog for directions, so here is an easily searchable set of directions for HAM1 FF.
There is a master switch for the HAM1 feedforward, but it can sometimes cause problems to slam it on and off that way. Instead, you can ramp the input to the feedforward down to zero. From sitemap:
SEI > ISI Sensor Config > [middle of the screen, see attachment] HAM1 ASC FF > L4CINF
This opens a filter bank page with four filter banks. They each have a gain of 1 and a ramp time of 20 seconds. Set all of these gains to zero to turn off the input to the feedforward. Ramp them back to 1 to engage.
I put cli instructions in this alog : https://alog.ligo-wa.caltech.edu/aLOG/index.php?callRep=79033.
caput H1:HPI-HAM1_TTL4C_FF_INF_RX_GAIN 0 & caput H1:HPI-HAM1_TTL4C_FF_INF_RY_GAIN 0 & caput H1:HPI-HAM1_TTL4C_FF_INF_X_GAIN 0 & caput H1:HPI-HAM1_TTL4C_FF_INF_Z_GAIN 0 &
This should turn the HAM1 asc ff off in a safe way.
As several of us just talked about in the control room, if The Noise is happening when folks are on site and there's a plan of a thing to try, please feel free to drop Observing to check. I think we'll keep the list of things to try elsewhere more dynamic than the alog (probably the LHO commissioning google doc). Some examples of things that we're thinking of right now are (a) turning off the HAM1 FF, or (b) walking (gently) around electronics racks (CER, EX ESD driver area) to see if we can hear any electronics 'whining' or otherwise going bad.
Please do send me a mattermost message, which should audibly ping my phone, but this is causing such problems for our data quality that there is no need to wait for a response from me before trying something.
TITLE: 12/12 Eve Shift: 0030-0600 UTC (1630-2200 PST), all times posted in UTC
STATE of H1: Observing at 155Mpc
OUTGOING OPERATOR: Ryan C
CURRENT ENVIRONMENT:
SEI_ENV state: CALM
Wind: 4mph Gusts, 2mph 3min avg
Primary useism: 0.03 μm/s
Secondary useism: 0.28 μm/s
QUICK SUMMARY: H1 has been observing for 23 hours. The vac prep lab dust monitor is reporting as disconnected.
This alog presents the first steps I am taking into answering the question: "what is the calibrated residual test mass motion from the ASC?"
As a reminder, the arm alignment control is run in the common/differential, hard/soft basis, so we have eight total loops governing the angular motion of the test masses: pitch and yaw for differential hard/soft and common hard/soft. These degrees of freedom are diagonalized in actuation via the ASC drive matrix. The signals from each of these ASC degrees of freedom are then sent to each of the four test masses, where the signal is fed "up" from the input of the TST ISC filter banks through the PUM/UIM/TOP locking filters banks (I annotated this screenshot of the ITM suspension medm for visualization). No pitch or yaw actuation is sent to the TST or UIM stages at Hanford. The ASC drive to the pum is filtered through some notches/bandstops for various suspension modes. The ASC drive to the TOP acquires all of these notches and bandstops and an additional integrator and low pass filter, meaning that the top mass actuates in angle at very low frequency only (sub 0.5 Hz).
Taking this all into account involves a lot of work, so to just get something off the ground, I am only thinking about ASC drive to the PUM in this post. With a little more time, I can incorporate the drive to the top mass stage as well. Thinking only about the PUM makes this a "simple" problem:
I have done just this to achieve the four plots I have attached to this alog. These plots show the ITM and ETM test mass motion in rad/rtHz from each degree of freedom and the overall radian RMS value. That is, each trace is showing you exactly how much radians of motion each ASC degree of freedom is sending to the test mass through the PUM drive. The drive matrix value is the same in magnitude for each ITM and each ETM, meaning that the "ITM" plot is true for both ITMX and ITMY (the drives might differ by an overall sign though).
Since I am just looking at the PUM, I also didn't include the drive notches. Once I add in the top mass drive, I will make sure I capture the various drive filters properly.
Some commentary: These plots make it very evident how different the drive is from each ASC degree of freedom. This is confusing because in principle we know that the "HARD" and "SOFT" plants are the same for common and differential, and could use the same control design. However, we know that the sensor noise at the REFL WFS, which controls CHARD, is different than the sensor noise at the AS WFS that control DHARD, so even with exact same controller, we would see different overall drives. We also know that we don't use the same control design for each DOF, due to the sensor noise limitations and also the randomness of commissioning that has us updating each ASC controller at different times for different reasons. For example, the soft loops both run on the TMS QPDs, but still have different drive levels.
Some action items: besides continuing the process of getting all the drives from all stages properly calibrated, we can start thinking again about our ASC design and how to improve it. I think two standout items are the SOFT P and CHARD Y noise above 10 Hz on these plots. Also, the fact that the overall RMS from each loop varies is something that warrants more investigation. I think this is probably related to the differing control designs, sensor noise, and noise from things like HAM1 motion or PR3 bosems. So, one thing I can do is project the PR3 damping noise that we think dominates the REFL WFS RMS into test mass motion.
I have just realized I mixed up the DACs and ADCs (again) and the correct count-to-torque calibration should be:
So these plots are wrong by a factor of 2. I will correct this in my code and post the corrected plots shortly.
The attached plots are corrected by the erroneous factor of two mentioned above, which has an overall effect of reducing the motion by 2.
As part of a different investigation (still trying to understand why our range goes bad sometimes), I incidentally may have found a source for some glitches / range drops.
I'm not going to look further into this, but instead tag detchar-request in hopes that someone else has some time to think about it. I'll also directly send messages to Jim and Elenna, who manage this feedforward system.
In the attached screenshot there are a few channels that include 'TTL4C' - those are the tabletop L4C seismic sensors on HAM1. There are also 'FFHAM1' channels that take a channel derived from those L4Cs, and feed it forward to the error signal of the ASC loop that is referred to in the name. A moment or so after there is a glitch in those channels, there is a range drop in DARM.
I will say that when I zoom in, it looks like the glitch appears in the FFHAM1 channel before it appears in the TTL4C channel, but based on my understanding of the signal flow, I'm not entirely sure how that's possible. I'm hoping that Elenna (who knows much more than I do) can help think this through.
The broadband glitching that was present in the early hours of Dec 11 (UTC) appears to have suddenly and entirely stopped at 10:36:30 UTC - this sharp feature can be seen in the daily range plot. I completed a series of LASSO investigations around this time in the hopes that such a sharp feature would make it easier for LASSO to identify correlations. I find a number of trend channels that have drastic changes at the same time as this turn-off point related to TCS-ITMY_CO2, ALS-Y_WFS, and SUS-MC3_M1.
The runs I completed are linked here:
Run #1 was a generic run of LASSO in the hopes of identifying a correlation. While no channel was highlighted as strongly correlated to the entire time period, this run does identify H1:TCS-ITMY_CO2_QPD_B_SEG2_OUTPUT (rank 11) and H1:TCS-ITMY_CO2_QPD_B_SEG2_INMON (rank 15) as having a drastic feature at the turn-off point (example figure). Based on this information, I launched targeted runs #2 and #3.
Run #2 is a run of LASSO using H1:TCS-ITMY_CO2_QPD_B_SEG2_OUTPUT as the primary channel to correlate against. This was designed to identify any additional channels that may show a drastic change in behavior at the same time. Channels of interest from this run include H1:ALS-Y_WFS_B_DC_SEG3_OUT16 (example figure) and H1:ALS-Y_WFS_B_DC_MTRX_Y_OUTMON (example figure). SEISMON channels were also found to be correlated, but this is likely a coincidence.
Run #3 targets the same turn-on point, but with the standard sensemon range as the primary channel. This run revealed an additional channel with a change in behavior at the time of interest, H1:SUS-MC3_M1_DAMP_P_INMON (example figure).
Based on these runs, the TCS-IMTY_CO2 and ALS-Y_WFS channels are the best leads for additional investigations into the source of this glitching.
TITLE: 12/11 Day Shift: 1530-0030 UTC (0730-1630 PST), all times posted in UTC
STATE of H1: Observing at 156Mpc
OUTGOING OPERATOR: TJ
CURRENT ENVIRONMENT:
SEI_ENV state: CALM
Wind: 5mph Gusts, 3mph 3min avg
Primary useism: 0.03 μm/s
Secondary useism: 0.32 μm/s
QUICK SUMMARY:
I ran the lowrange coherence check for a good and bad range time during this current lock.
I looked through the suspension driftmon scopes from the medm IFO_ALIGN_COMPACTEST and most looked normal compared to other locks. The main thing I saw that looked strange was a small step in MC3_P at the same time as the range gets better, I didn't see this behaviour in previous locks with bad range stretches though.
I looked at the OPLEV BLRMS as well, the main thing I saw on these scopes was that the BSs BLRM increased, largely in yaw, during the bad range times of this current lock. I don't see as obvious of a jump in other lock stretches.
Jenne suggested that we look at top mass Vertical osems to check for sagging that is causing touching. I check the quads, BS and output arm and see no drifts that correlate with the low range periods.
I looked at verticals for MC{1,2,3}, PR{M,2,3}, and FC{1,2} and the only thing I odd I noticed is that FC2 vertical seems to move more during the bad range times than the good range. Most of them see a seasonal small downward sag over the past 40 days.
I've looked at spectra (using 64 sec of data split into 16 second chunks with 50% overlap) of the top mass osems for all suspensions, comparing between start times of 1417933576 (bad time) and 1417950319 (a little while after the sharp improvement). None of the spectra have any of the classic 'we're rubbing' peaks. I've noted a few that I want to re-plot and zoom in (RM1 L, RM2 L, OMC L P V, FC1 P Y R T). I'll also re-look at MC3, since that one is one of our most 'suspicious' optics right now.
I attach the spectra that I made, of these potentially suspicious optics. The main conclusion here is that none of these are actually very suspicious, so since these are my *most* suspicious, probably we are not rubbing. But, I'll make a few more plots of these suspensions. In all of these plots the blue 'reference time' is when the IFO is locked with good sensitivity, and the orange 'check time' is when the IFO is locked with poor sensitivity.
I replotted the 'suspicious' top mass spectra using DTT. I don't find anything suspicious or interesting on FC1 or MC3.
OMC is a little strange, in that it has a set of peaks that all change frequency in the same way (first attachment). I'm not sure that this is meaningful for today's investigation though.
RM1 and RM2 are both quite strange looking in the 5-9 Hz range. They both pick up a forest of peaks in Length (and a little bit in Pit, and maybe a teeny bit in Yaw). Second attachment. Going to look further into these, maybe at other times as well. Robert said that these both saw some motion on the summary page, but their motion didn't seem to correlate with the reduction in range.
TITLE: 12/11 Eve Shift: 0030-0600 UTC (1630-2200 PST), all times posted in UTC
STATE of H1: Observing at 102Mpc
INCOMING OPERATOR: TJ
SHIFT SUMMARY: Currently Observing and have been Locked for almost 5 hours. Our range is still all over the place unfortunately. I jumped in and out of Observing a few times by turning squeezing on and off to check for differences with the range (81753), but didn't find anything.
LOG:
00:30 Relocking
01:08 NOMINAL_LOW_NOISE
01:14 Observing
02:57 Went out of Observing and turned off SQZ to see if that fixes the mystery noise
03:09 Back to FDS
03:19 Turned off SQZ
03:33 Back to FDS and back to Observing
Attached plot shows that the low range glitchy behavior happens independent of whether we have SQZ injected or not. Traces show the SQZ/NO SQZ times Oli noted in green/yellow with comparisons of good SQZ and NO SQZ times in blue and red.
Yesterday, in 81724 it seemed like the behavior stopped before we took the no SQZ time. Each trace is: 0.1Hz 50% overlap 100 averages = 500 seconds ~10 minutes. /ligo/home/camilla.compton/Documents/H1_DARM_FOM_s_glitchy.xml
Conclusions:
I ran BRUCOs on the bad (1417932916: 2024/12/11 06:14UTC) and good (1417949016: 2024/12/11 10:43UTC) times in the attached plot.
Main differences in 20-100Hz region:
[Jason, Masayuki]
The PMC heater calibration was performed last week (Tuesday). The calibration involved adjusting the temperature loop set point and monitoring the corresponding changes in PMC temperature and length. The results were validated using previous measurements and compared to similar evaluations at LLO. Additionally, the necessity of the heater for JAC operations was assessed, highlighting it would be needed for long term operation.
0.30 μm / 0.023 K = 13 μm/KThis result is consistent with the thermal expansion coefficient of aluminum, 22e-6/K, and the approximate PMC length of 0.5 m.
13 μm/K × 0.67 K/V = 8.7 μm/V
The PZT can be railed in a day from this measurement, so we would need the heater for JAC operation.
Spikes observed at LHO caused glitches in transmitted power, as shown in the attached plot, and may require resolution. Redesigning the filters could potentially mitigate these anomalies.
Just went out of Observing and took SQZ manager to no squeezing to check if the noise issues are related to squeezing. We'll be doing no squeezing for 10mins, SQZ for 10, no sqz for 10, and then back to sqzing and Observing
Back to just Observing as of 03:33 UTC
Looks like the range is still changing a decent amount when squeezing was off (ndscope), which lines up with previous observations that we were also seeing this noise during the lock stretches a few nights ago where we weren't squeezing for multiple hours.
PCAL team went to End Y today with PS4 to do a regular measurement and a "long measurement consisting of 15 minutes of time in each position instead of 240 seconds".
PS4 rho, kappa, u_rel on 2024-10-25 corrected to ES temperature 299.3 K : -4.71053733727373 -0.0002694340454223 4.653616030093759e-05
Copying the scripts into tD directory...
Connected to nds.ligo-wa.caltech.edu
martel run
reading data at start_time: 1417885234
reading data at start_time: 1417885750
reading data at start_time: 1417886151
reading data at start_time: 1417886600
reading data at start_time: 1417886970
reading data at start_time: 1417887305
reading data at start_time: 1417887420
reading data at start_time: 1417888020
reading data at start_time: 1417888356
Ratios: -0.5346804302935332 -0.543306389094602
writing nds2 data to files
finishing writing
Background Values:
bg1 = 18.604505; Background of TX when WS is at TX
bg2 = 5.391990; Background of WS when WS is at TX
bg3 = 18.556794; Background of TX when WS is at RX
bg4 = 5.396890; Background of WS when WS is at RX
bg5 = 18.642247; Background of TX
bg6 = -0.202112; Background of RX
The uncertainty reported below are Relative Standard Deviation in percent
Intermediate Ratios RatioWS_TX_it = -0.534680;
RatioWS_TX_ot = -0.543306;
RatioWS_TX_ir = -0.527163;
RatioWS_TX_or = -0.534899;
RatioWS_TX_it_unc = 0.055923;
RatioWS_TX_ot_unc = 0.051445;
RatioWS_TX_ir_unc = 0.062749;
RatioWS_TX_or_unc = 0.054710;
Optical Efficiency
OE_Inner_beam = 0.986010;
OE_Outer_beam = 0.984479;
Weighted_Optical_Efficiency = 0.985245;
OE_Inner_beam_unc = 0.044504;
OE_Outer_beam_unc = 0.041112;
Weighted_Optical_Efficiency_unc = 0.060587;
Martel Voltage fit:
Gradient = 1637.914766;
Intercept = 0.150812;
Power Imbalance = 0.984123;
Endstation Power sensors to WS ratios::
Ratio_WS_TX = -0.927655;
Ratio_WS_RX = -1.384163;
Ratio_WS_TX_unc = 0.044122;
Ratio_WS_RX_unc = 0.042178;
=============================================================
============= Values for Force Coefficients =================
=============================================================
Key Pcal Values : GS = -5.135100; Gold Standard Value in (V/W)
WS = -4.710537; Working Standard Value
costheta = 0.988362; Angle of incidence
c = 299792458.000000; Speed of Light
End Station Values : /ligo/gitcommon/Calibration/pcal
TXWS = -0.927655; Tx to WS Rel responsivity (V/V)
sigma_TXWS = 0.000409; Uncertainity of Tx to WS Rel responsivity (V/V)
RXWS = -1.384163; Rx to WS Rel responsivity (V/V)
sigma_RXWS = 0.000584; Uncertainity of Rx to WS Rel responsivity (V/V)
e = 0.985245; Optical Efficiency sigma_e = 0.000597; Uncertainity in Optical Efficiency
Martel Voltage fit :
Martel_gradient = 1637.914766;
Martel to output channel (C/V)
Martel_intercept = 0.150812;
Intercept of fit of Martel to output (C/V)
Power Loss Apportion : beta = 0.998844; Ratio between input and output (Beta)
E_T = 0.992021; TX Optical efficiency
sigma_E_T = 0.000301; Uncertainity in TX Optical efficiency
E_R = 0.993169; RX Optical Efficiency
sigma_E_R = 0.000301; Uncertainity in RX Optical efficiency
Force Coefficients :
FC_TxPD = 9.138978e-13; TxPD Force Coefficient
FC_RxPD = 6.216600e-13; RxPD Force Coefficient
sigma_FC_TxPD = 4.923605e-16; TxPD Force Coefficient
sigma_FC_RxPD = 3.250921e-16; RxPD Force Coefficient
data written to ../../measurements/LHO_EndY/tD20241210/
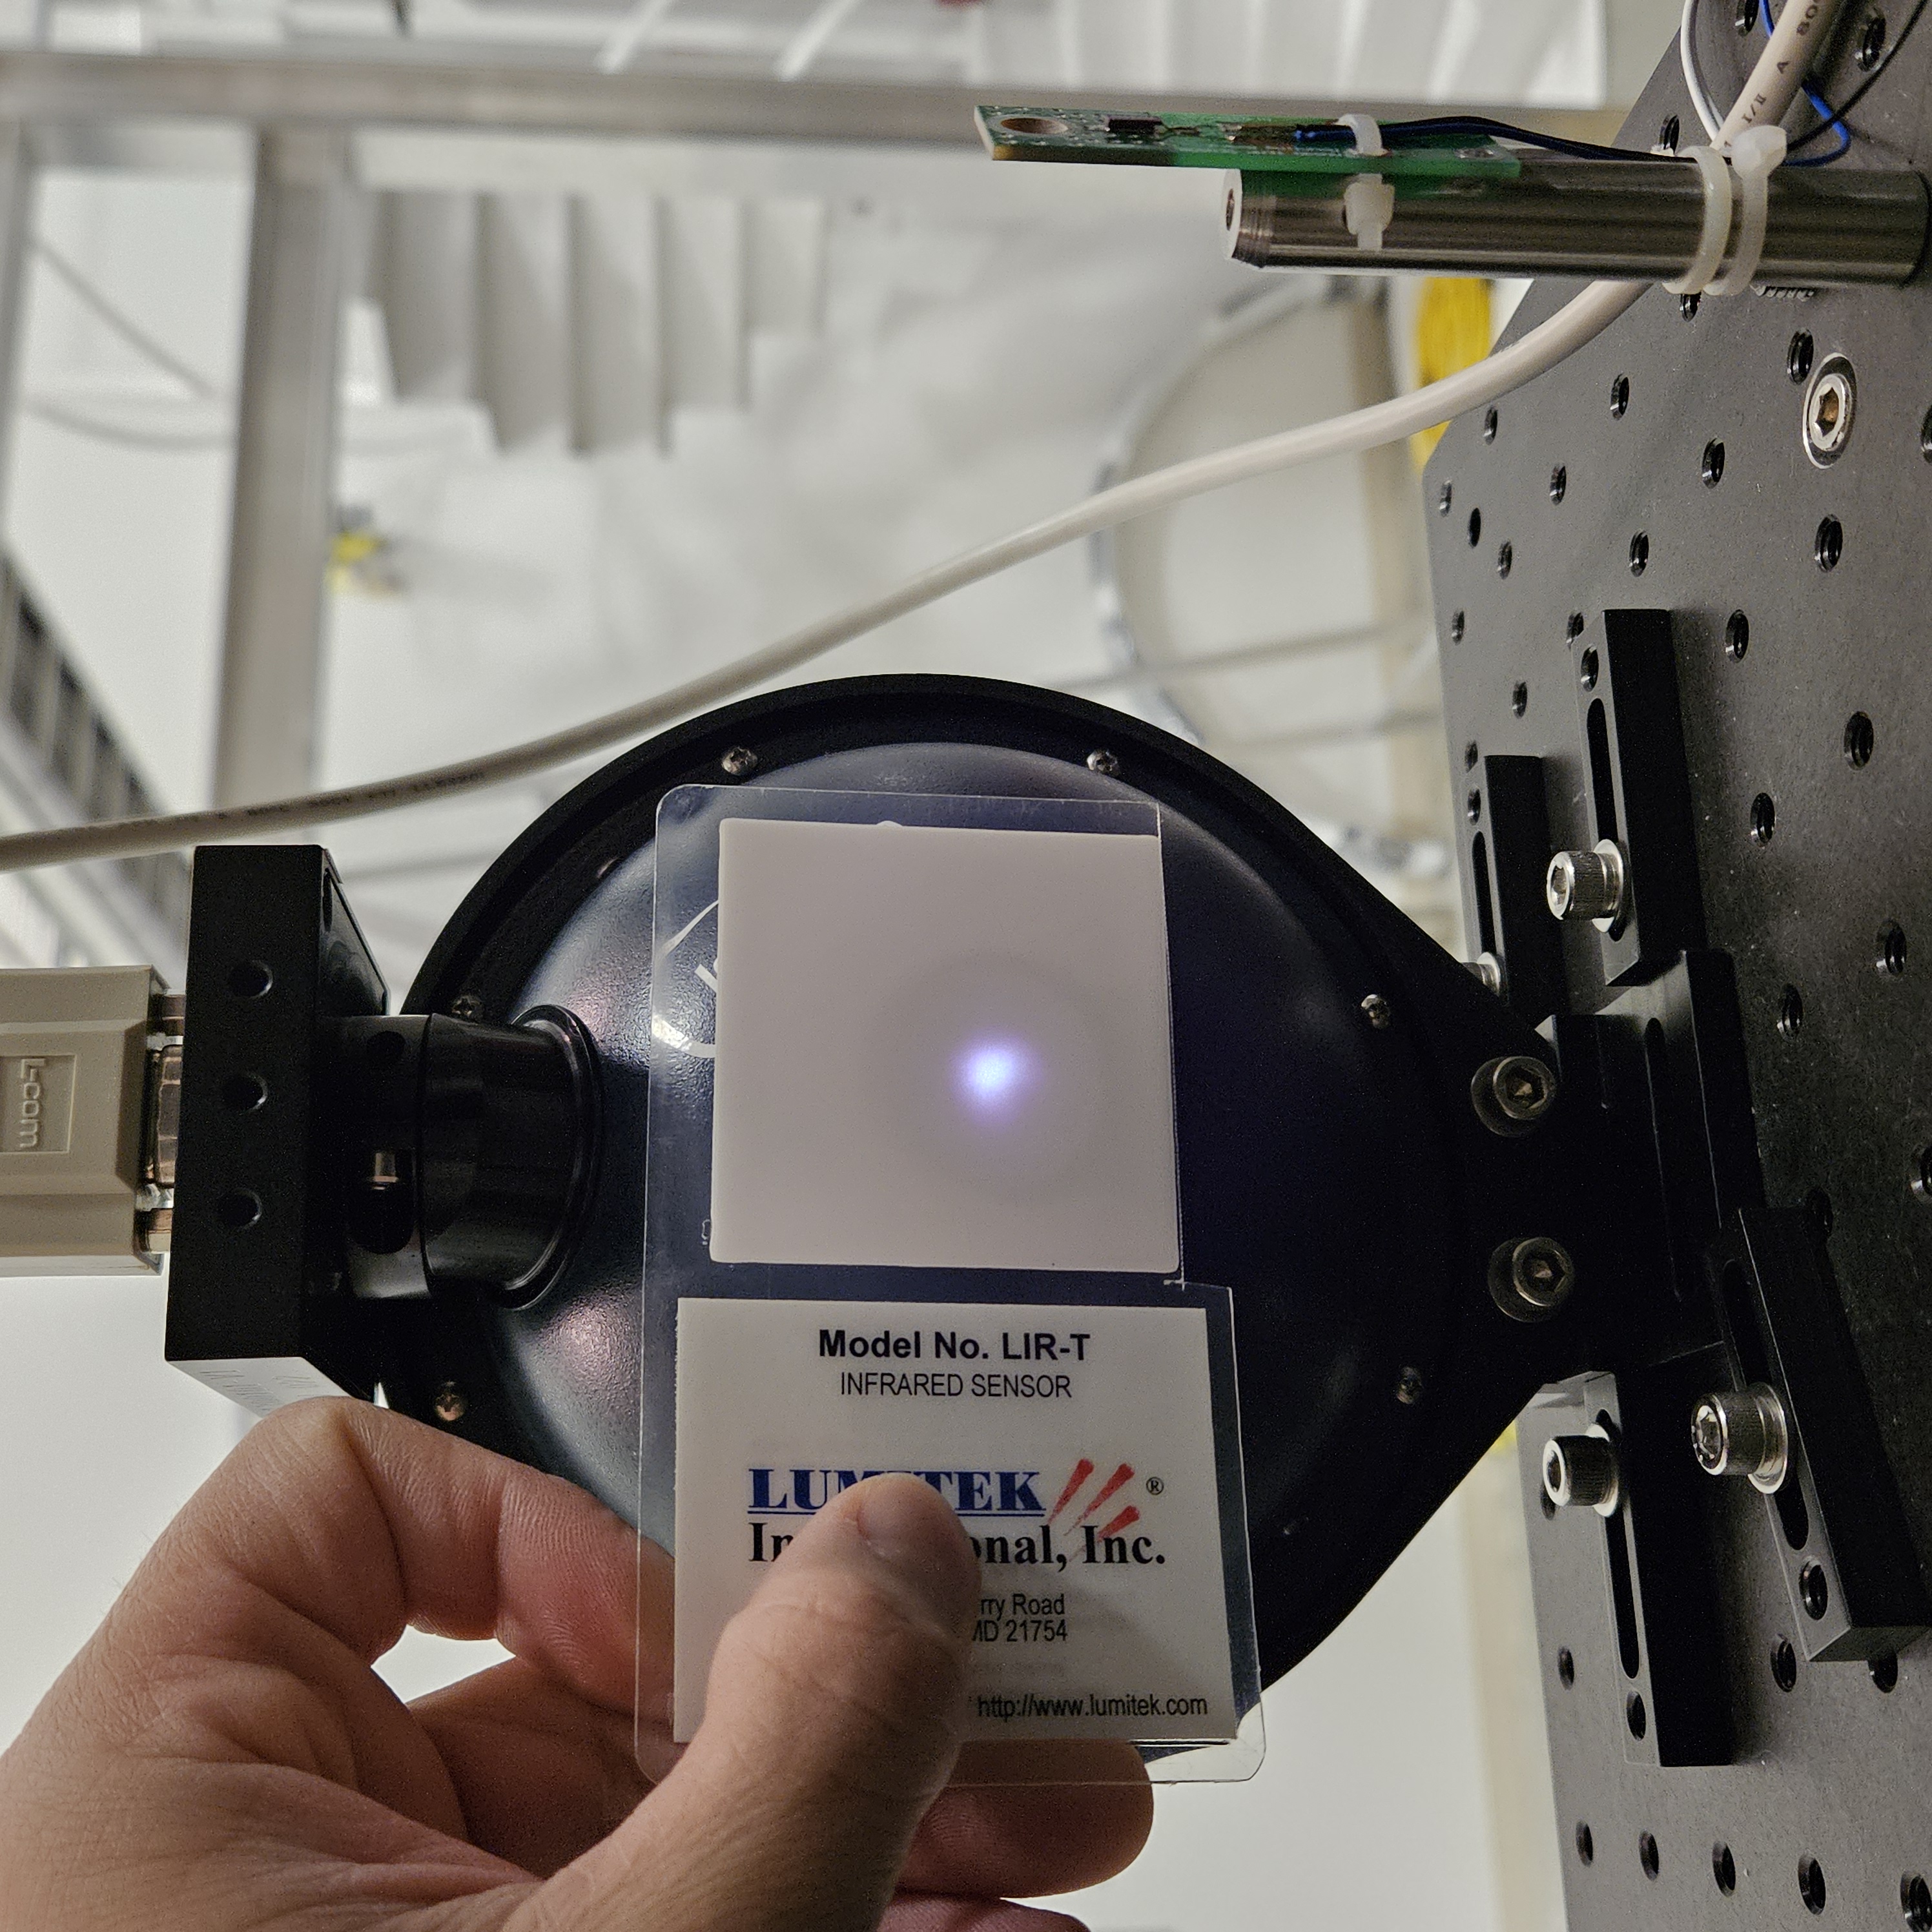
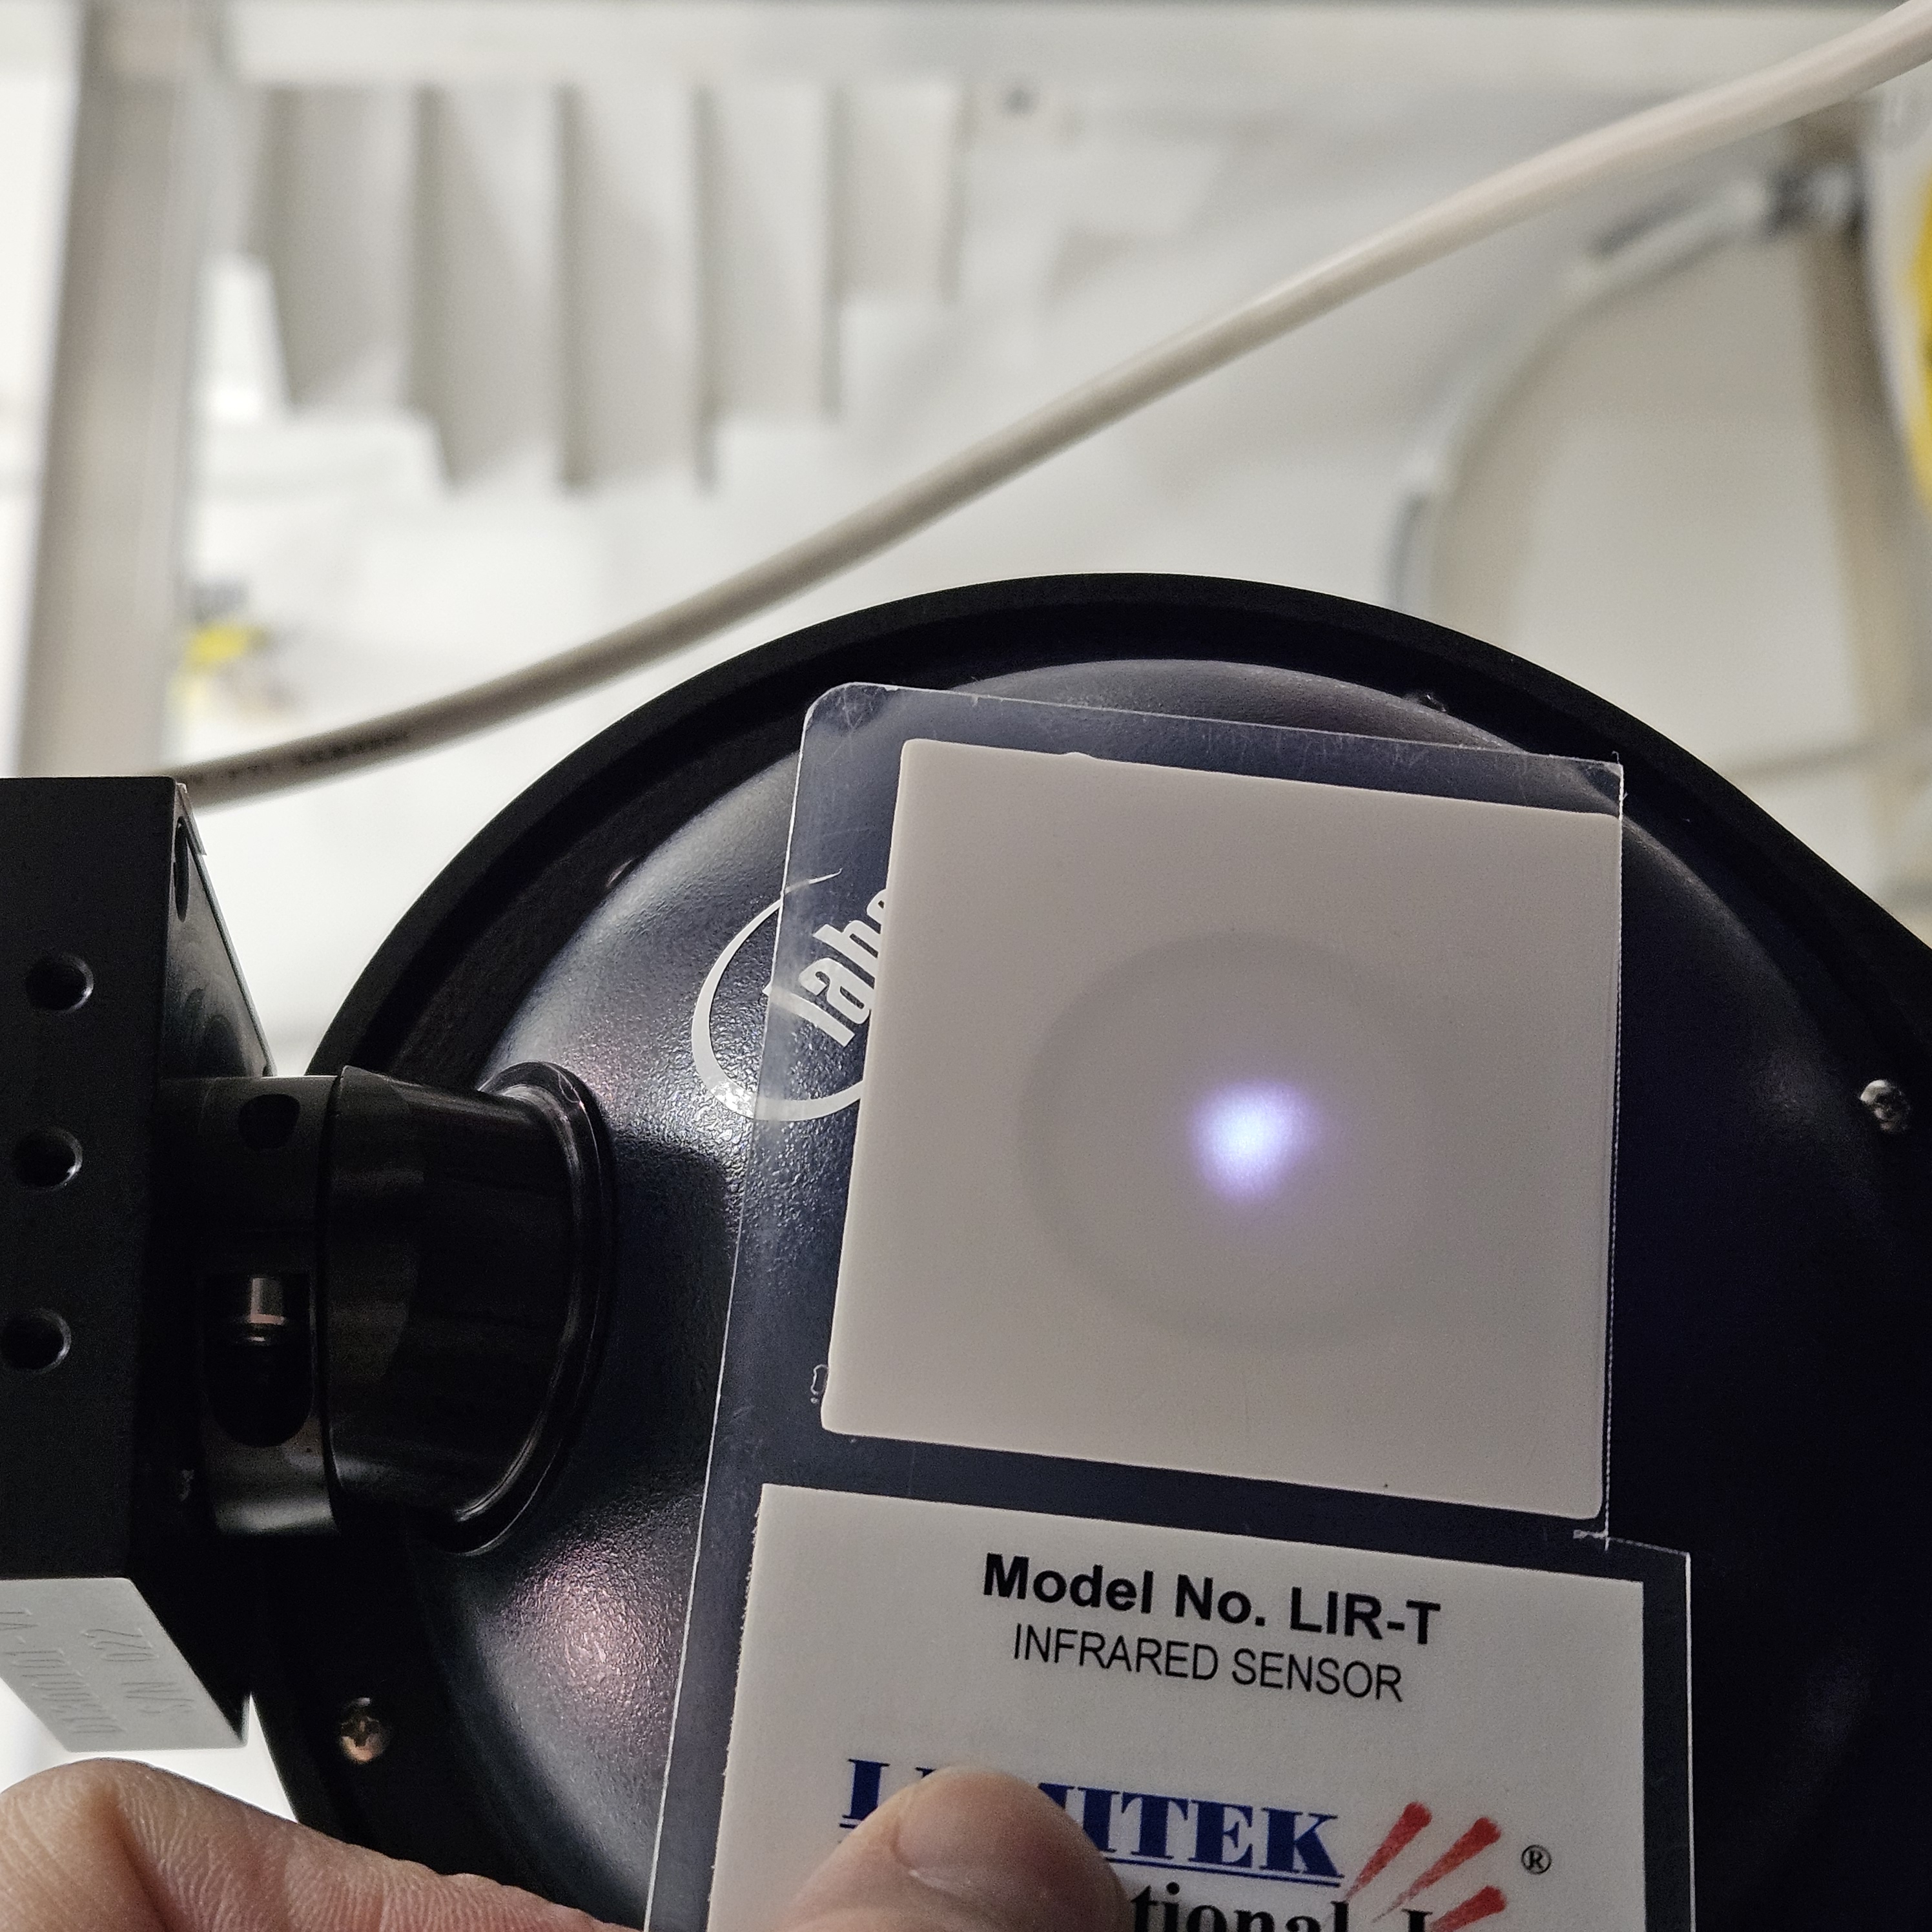
Before beam spot looking a little oblonged but not too bad.
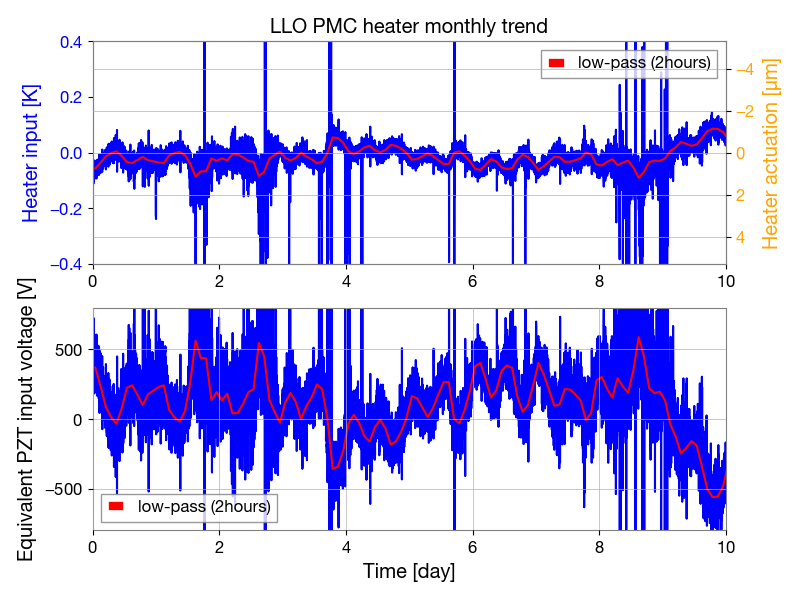
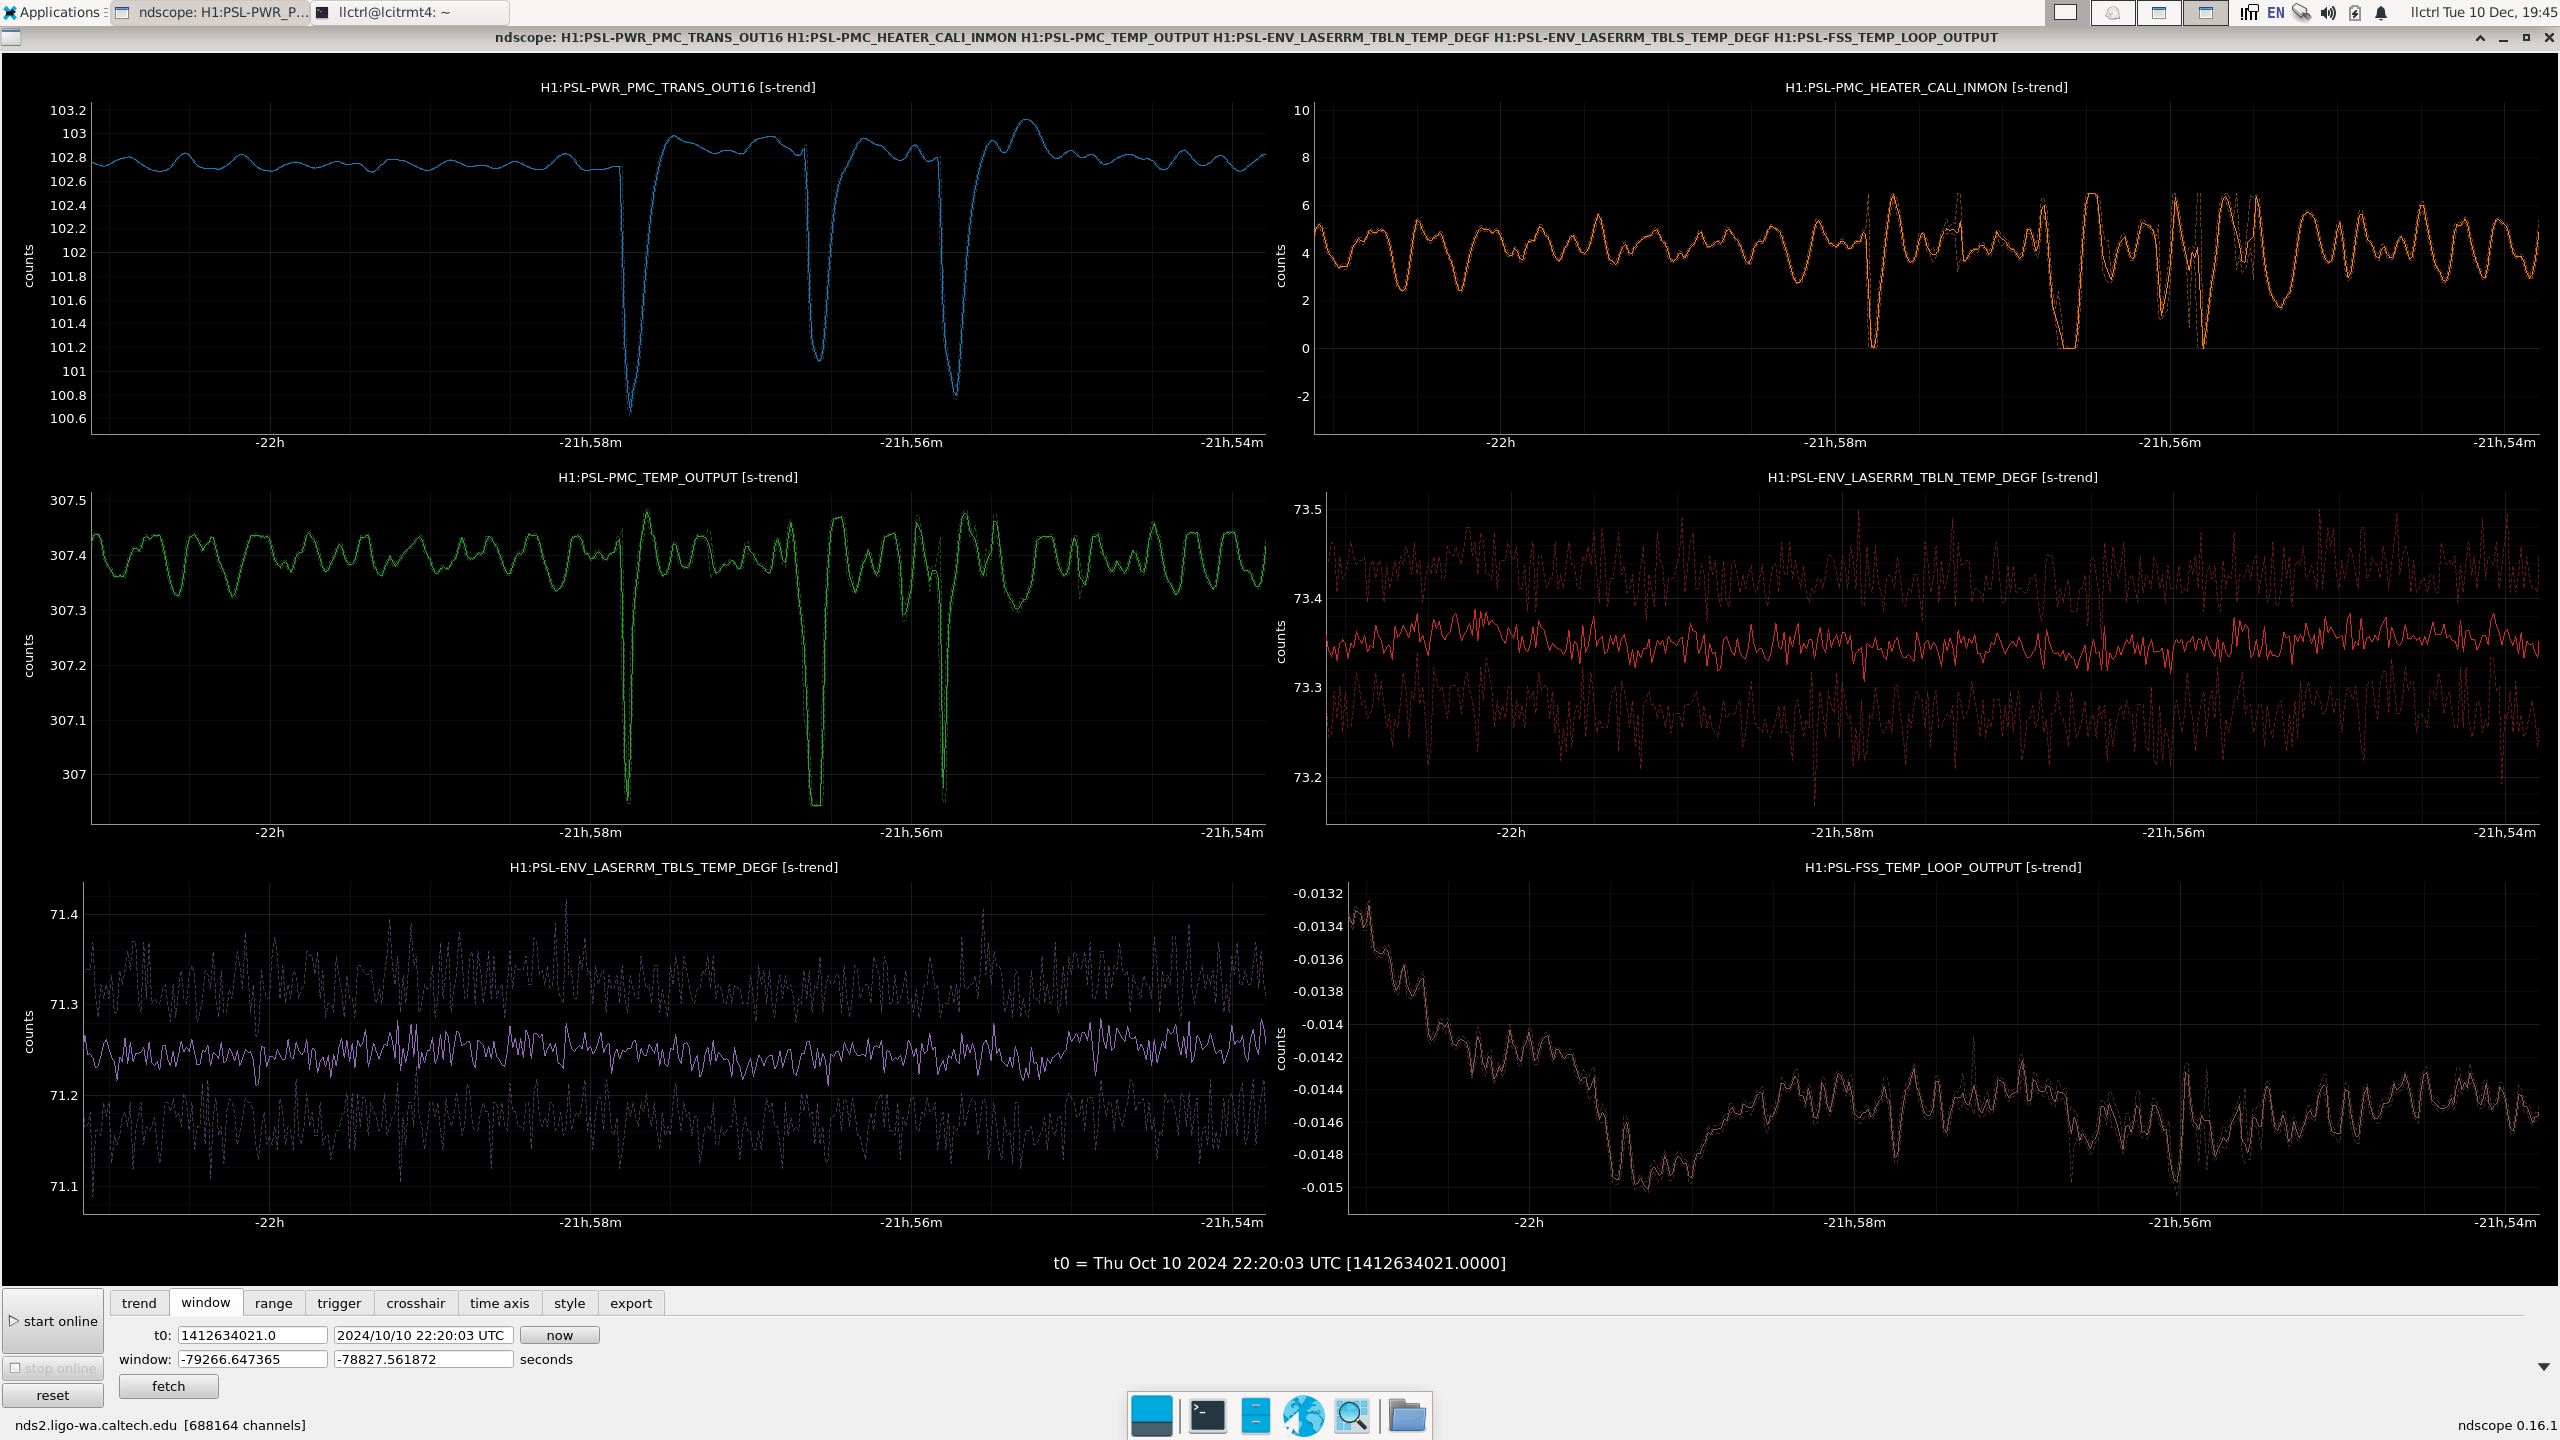
Martel Voltage Test plots
WS_at_RX plots
WS at RX Side with Both Beams
WS at Transmitter Module
PCAL ES procedure & Log DCC T1500062 ( Modified for long measurement)
The analysis for the long measurement is still pending.
This adventure was brought to you by Dripta & Tony S.
I forgot to link to the trends doc:
https://git.ligo.org/Calibration/pcal/-/blob/master/O4/ES/measurements/LHO_EndY/tD20241210/LHO_EndY_PD_ReportV4.pdf?ref_type=heads
As part of WP 12239 we moved h0epics, cdsvmscript1, epics-burt, autoburt off of the cds0proxmox hypervisor. This resulted in a few minutes of down time for the dust monitor IOC around 8:19am localtime. After this we done we were able to look at cdsproxmox. Its boot drive had failed. After some help from Fil we got the drives replaced and reinstalled proxmox ve on cdsproxmox. We adjusted DNS and renamed the box cdsproxmox0. Some notes: * This is now in a temporary state. We aim to retire this hardware by or at the end of O4. New hypervisor computers are being procured. As such we did not provision much storage on this. Just enough to run the hypervisor, relying on the shared storage layer to handle the VM. * As per the proxmox administrators guild we removed cdsproxmox from the cluster prior to attaching it back as cdsproxmox0.
to change a disk image name in proxmox,
Get the numeric id for the VM from the web interface
Turn off the VM
edit /etc/pve/nodes/<hypervisor hostname>/qemu-server/<id>.conf
Change the disk image name and save the file.
Find the disk image file and change its name also.
Restart the VM. It will load from the renamed file.