Back in March (76269) Jeff and I had updated all the suspension watchdogs (besides OFIS, OPOS, and HXDS since those were already up to date) to use better blrms filtering and to be output into um. We set the suspension watchdog thresholds to values between 100 and 300 µm, but these values were set arbitrarily since there was no way to previously see how far the stages move during different scenarios. We had upped a few of the thresholds after having some suspensions trip when they probably shouldn't have, and this is a continuation of that.
During the large earthquake that hit us on December 5th, 2024 18:46 UTC, all ISI watchdogs tripped as well as some of the stages on several suspensions. After a cursory look, all suspensions that tripped only had either the bottom or bottom+penultimate stage trip, meaning that with the exception of the single suspensions, the others' M1 stage damping should have stayed on.
We wanted to go through and check whether the trips may have just been because of the movement from the ISIs tripping. If that is the case, we want to raise the suspension watchdog thresholds for those stages so that these suspensions don't trip every single time their ISI trips, especially if the amount that they are moving is still not very large.
Suspension stages that tripped:
Triples:
- MC3 M3
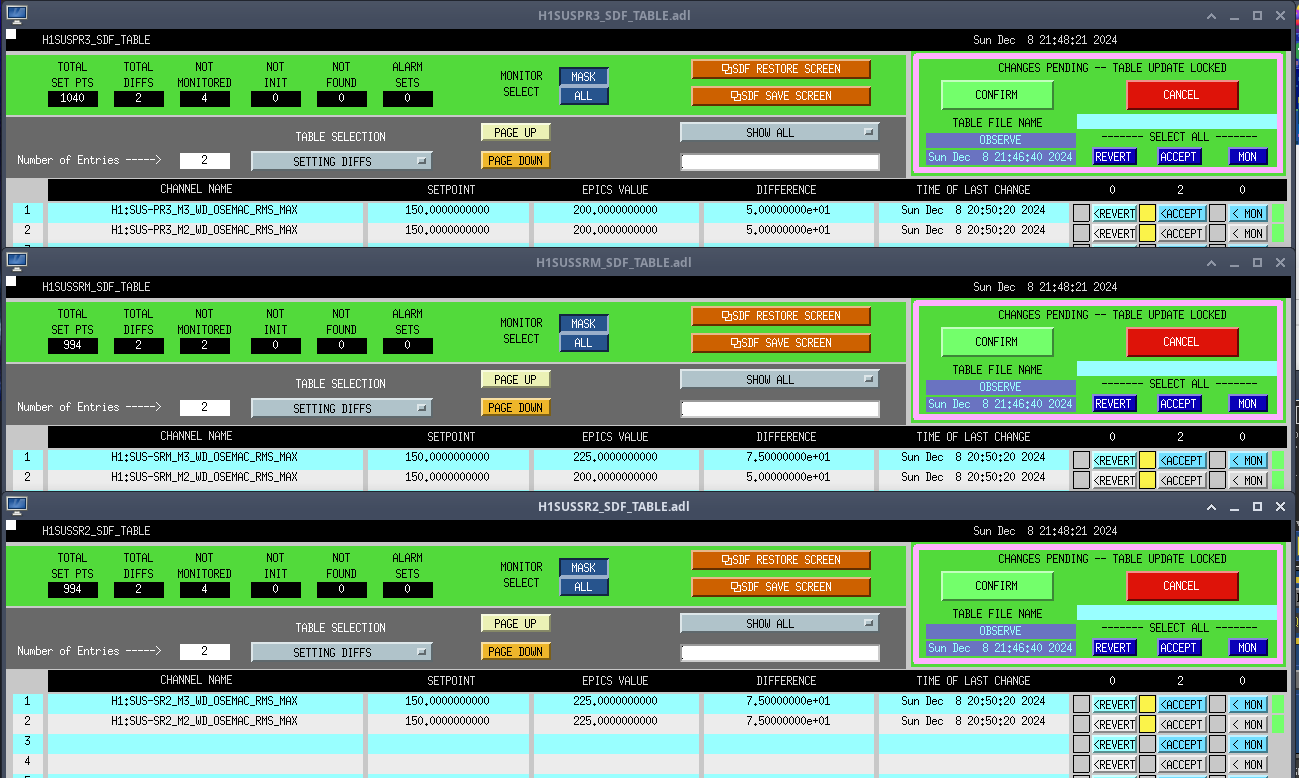
- PR3 M2, M3
- SRM M2, M3
- SR2 M2, M3
Singles:
- IM1 M1
- OFI M1
- TMSX M1
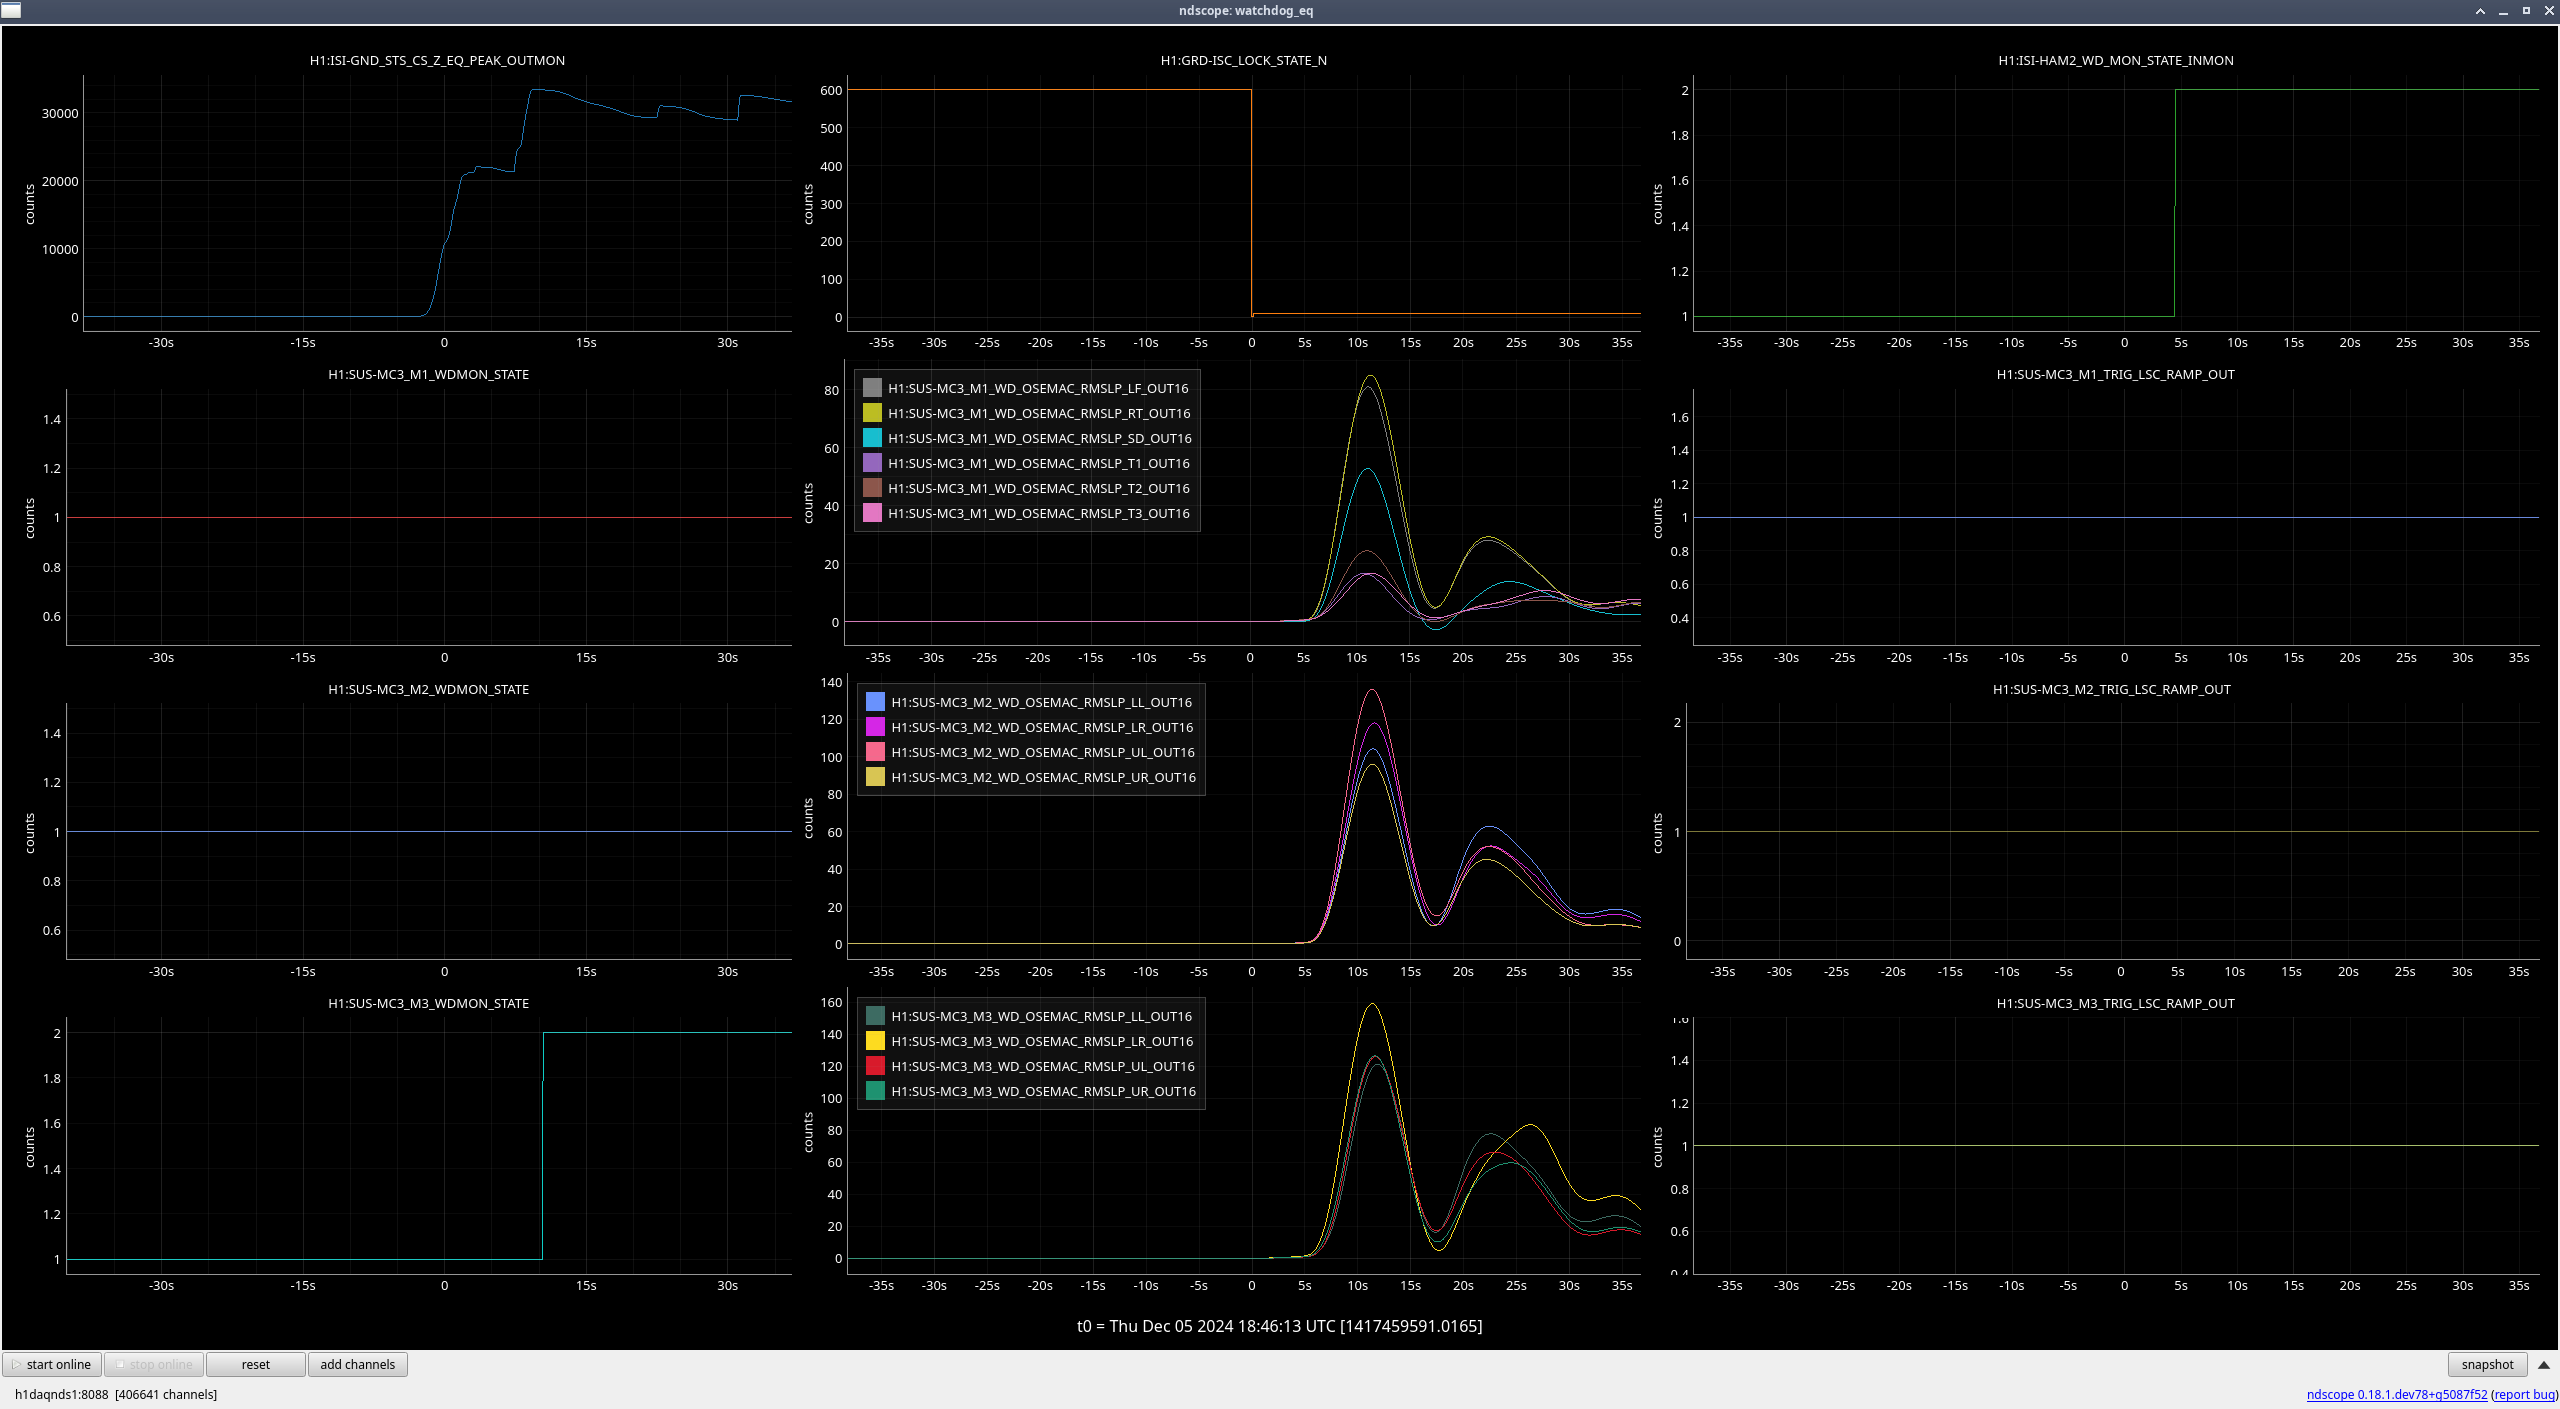
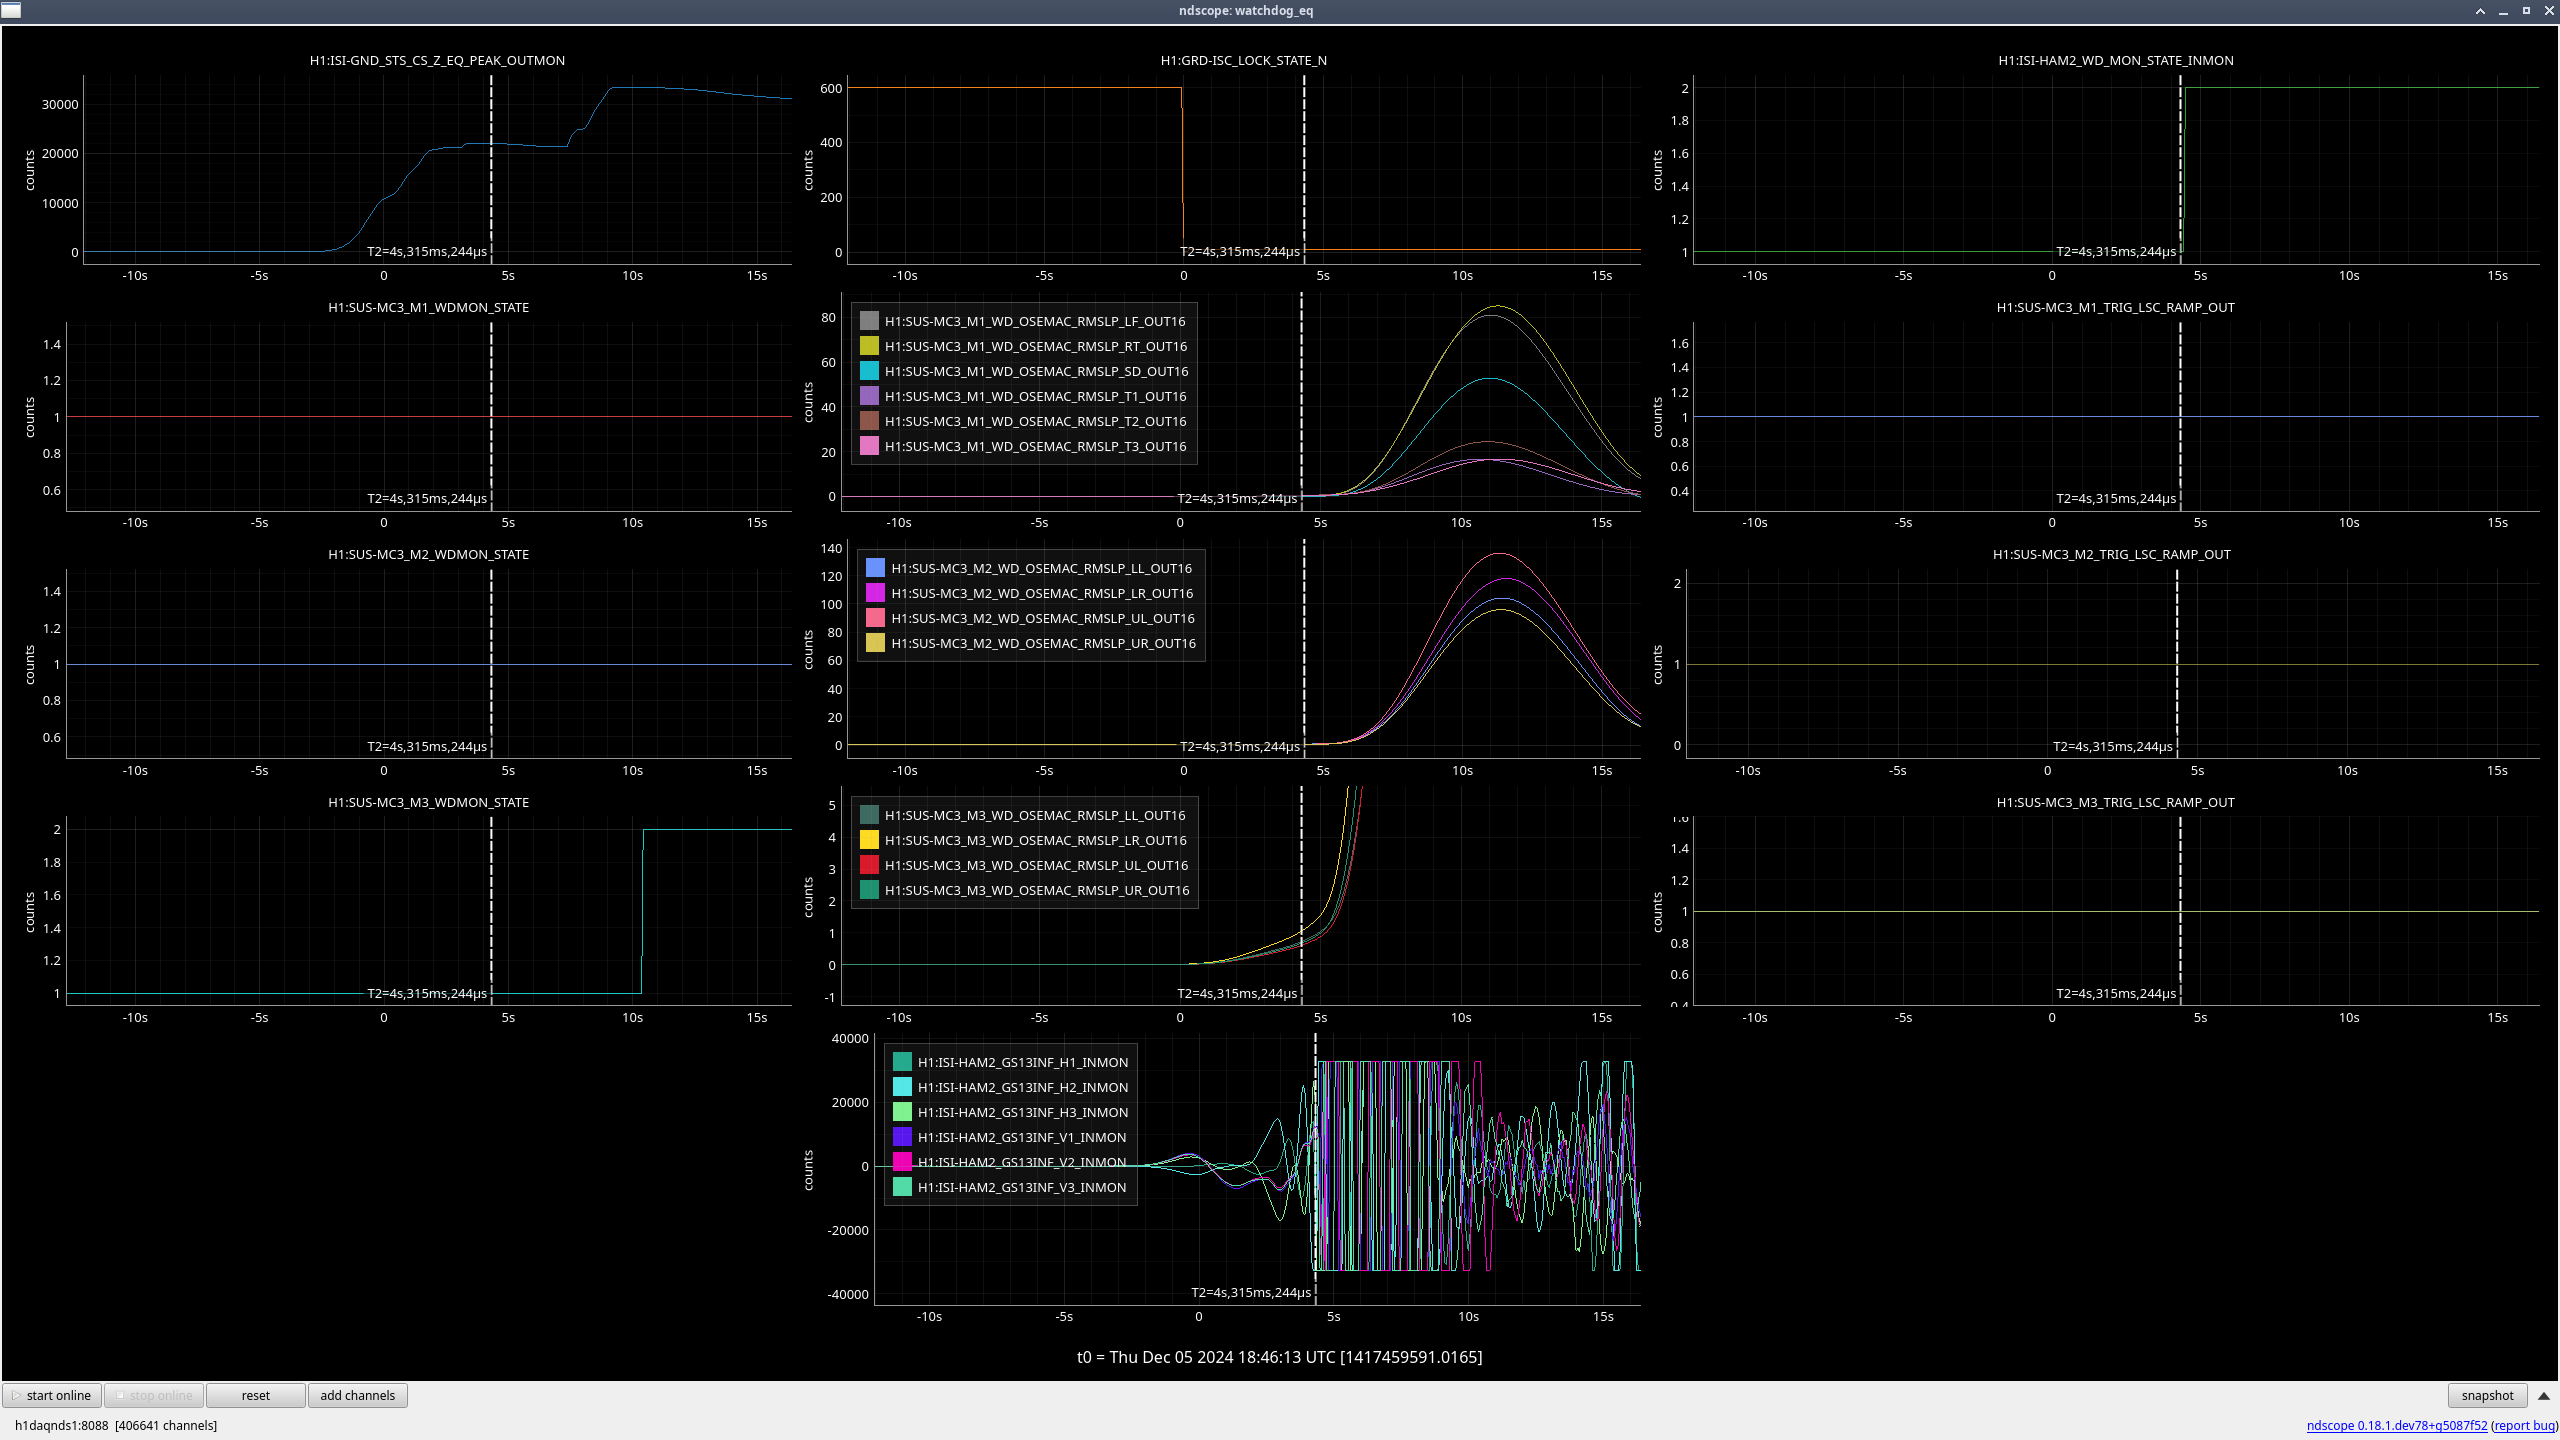
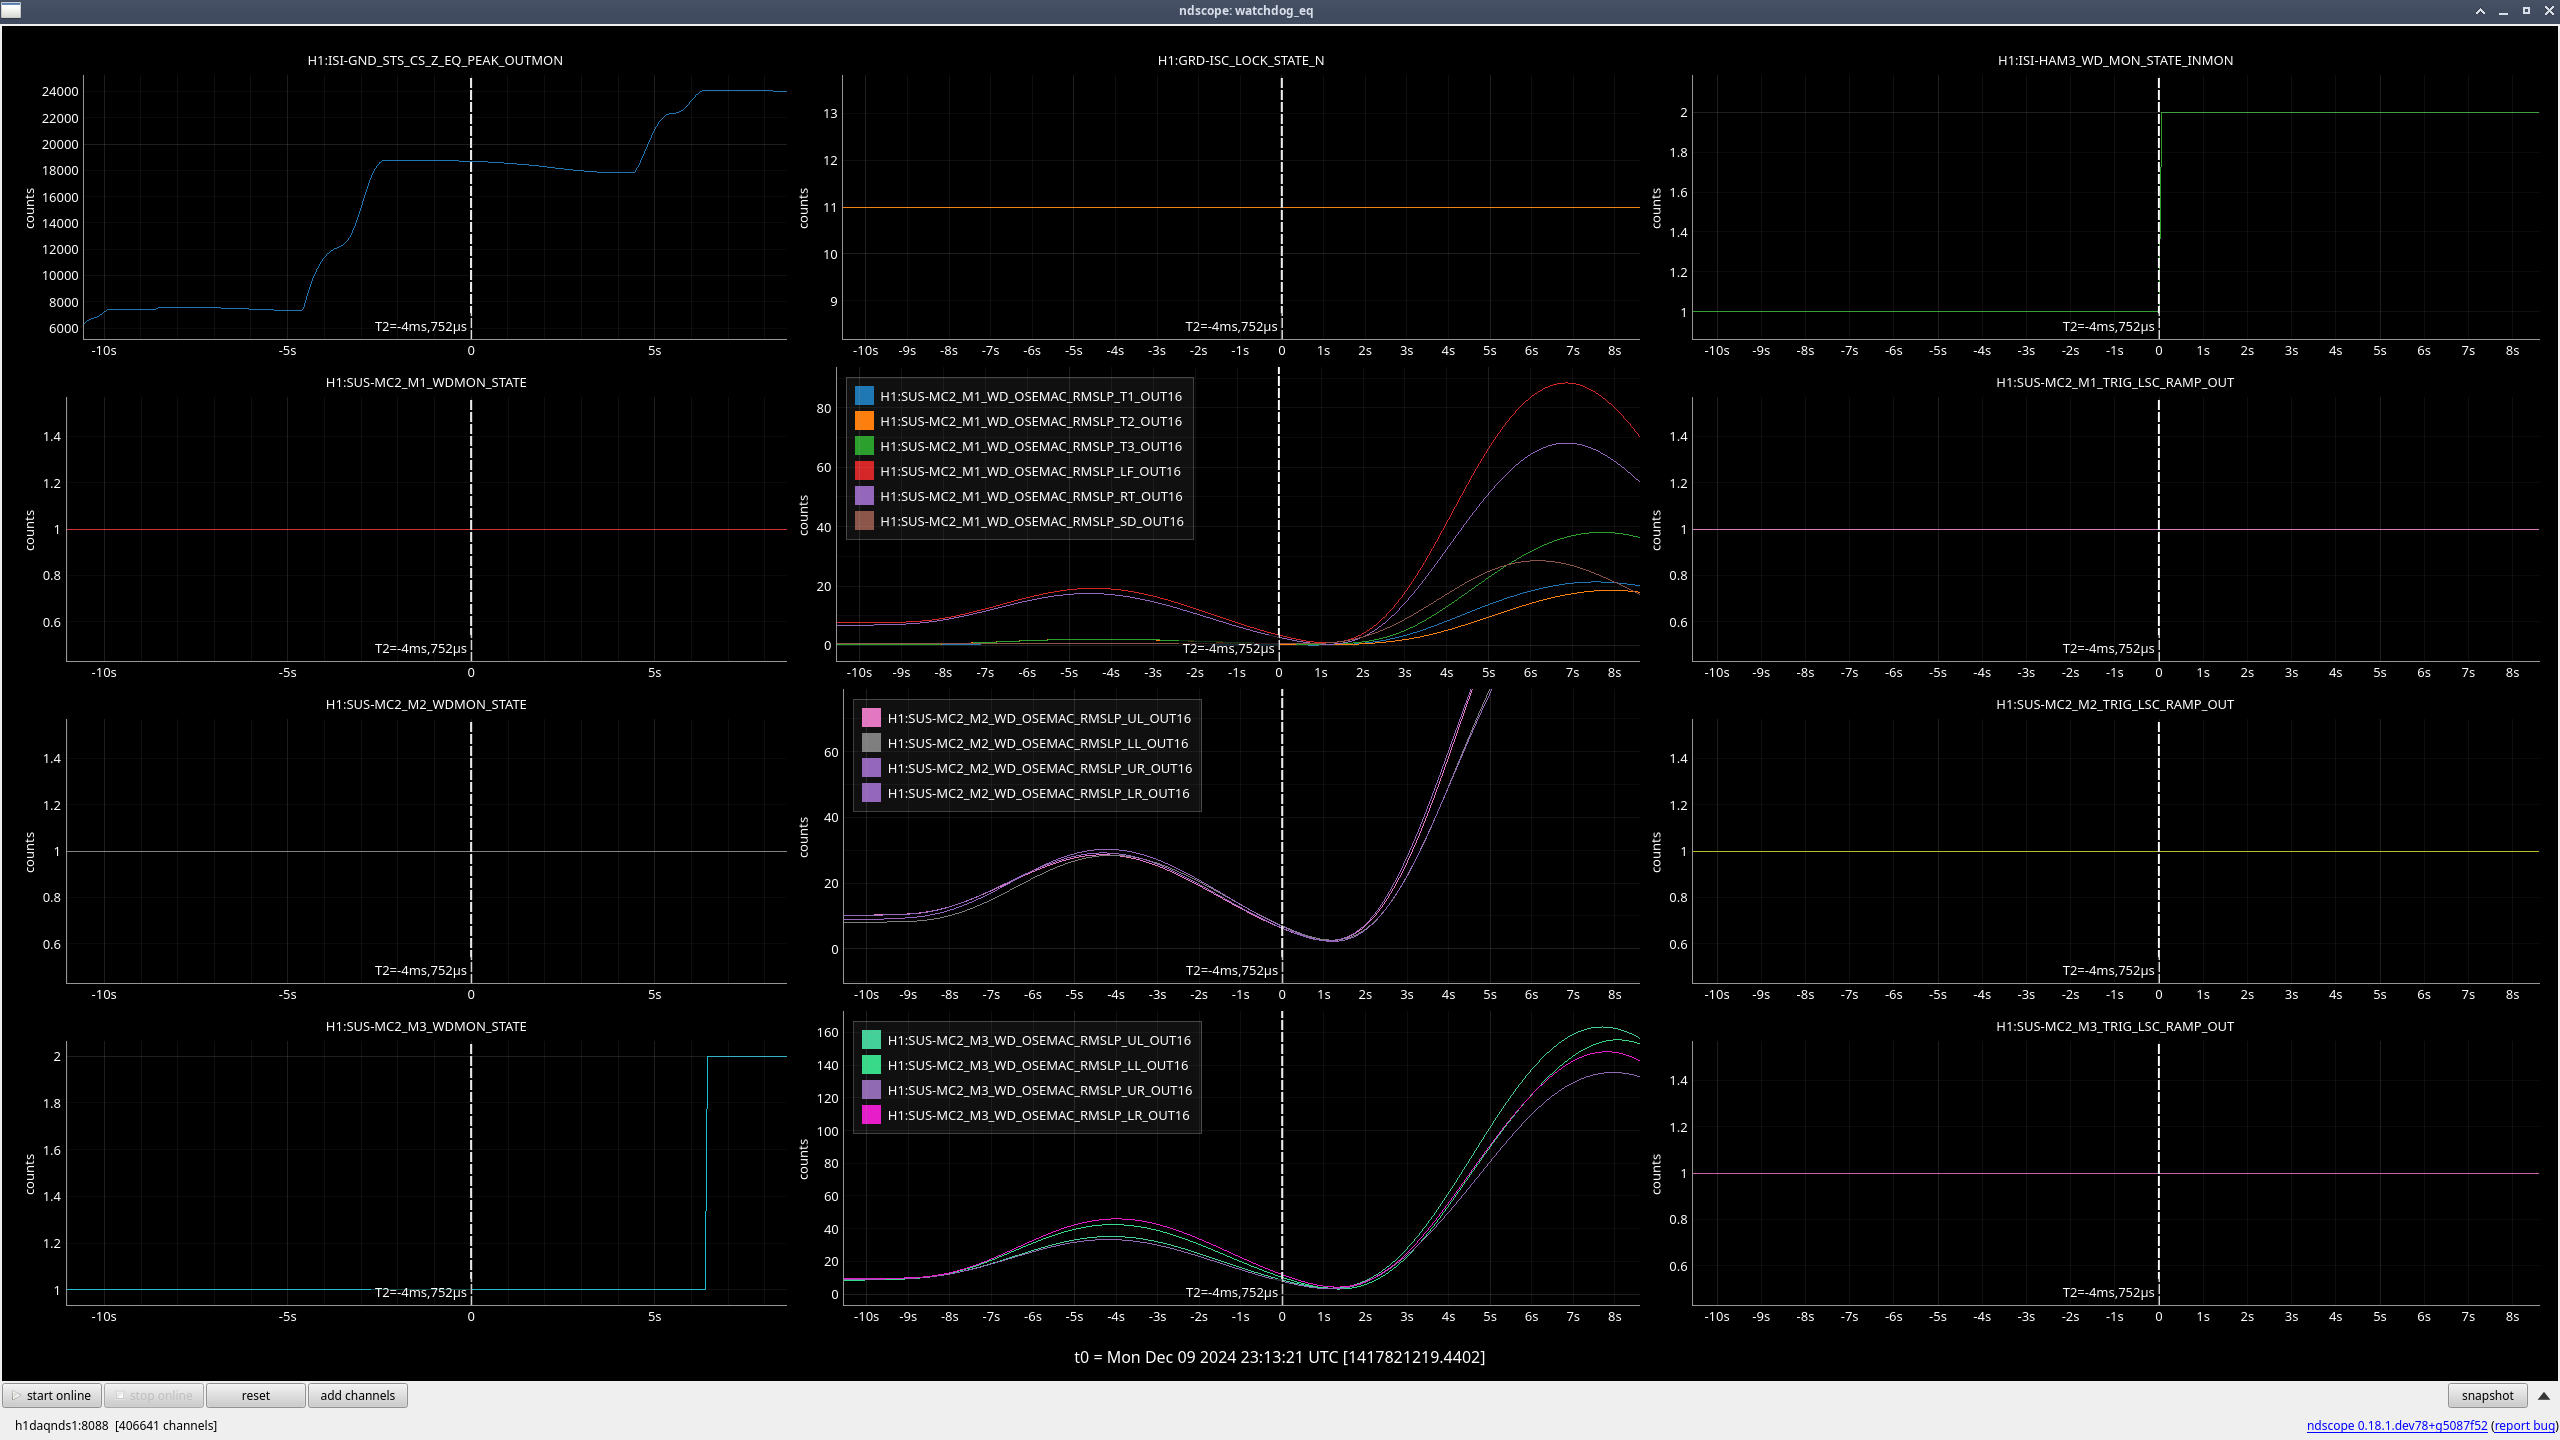
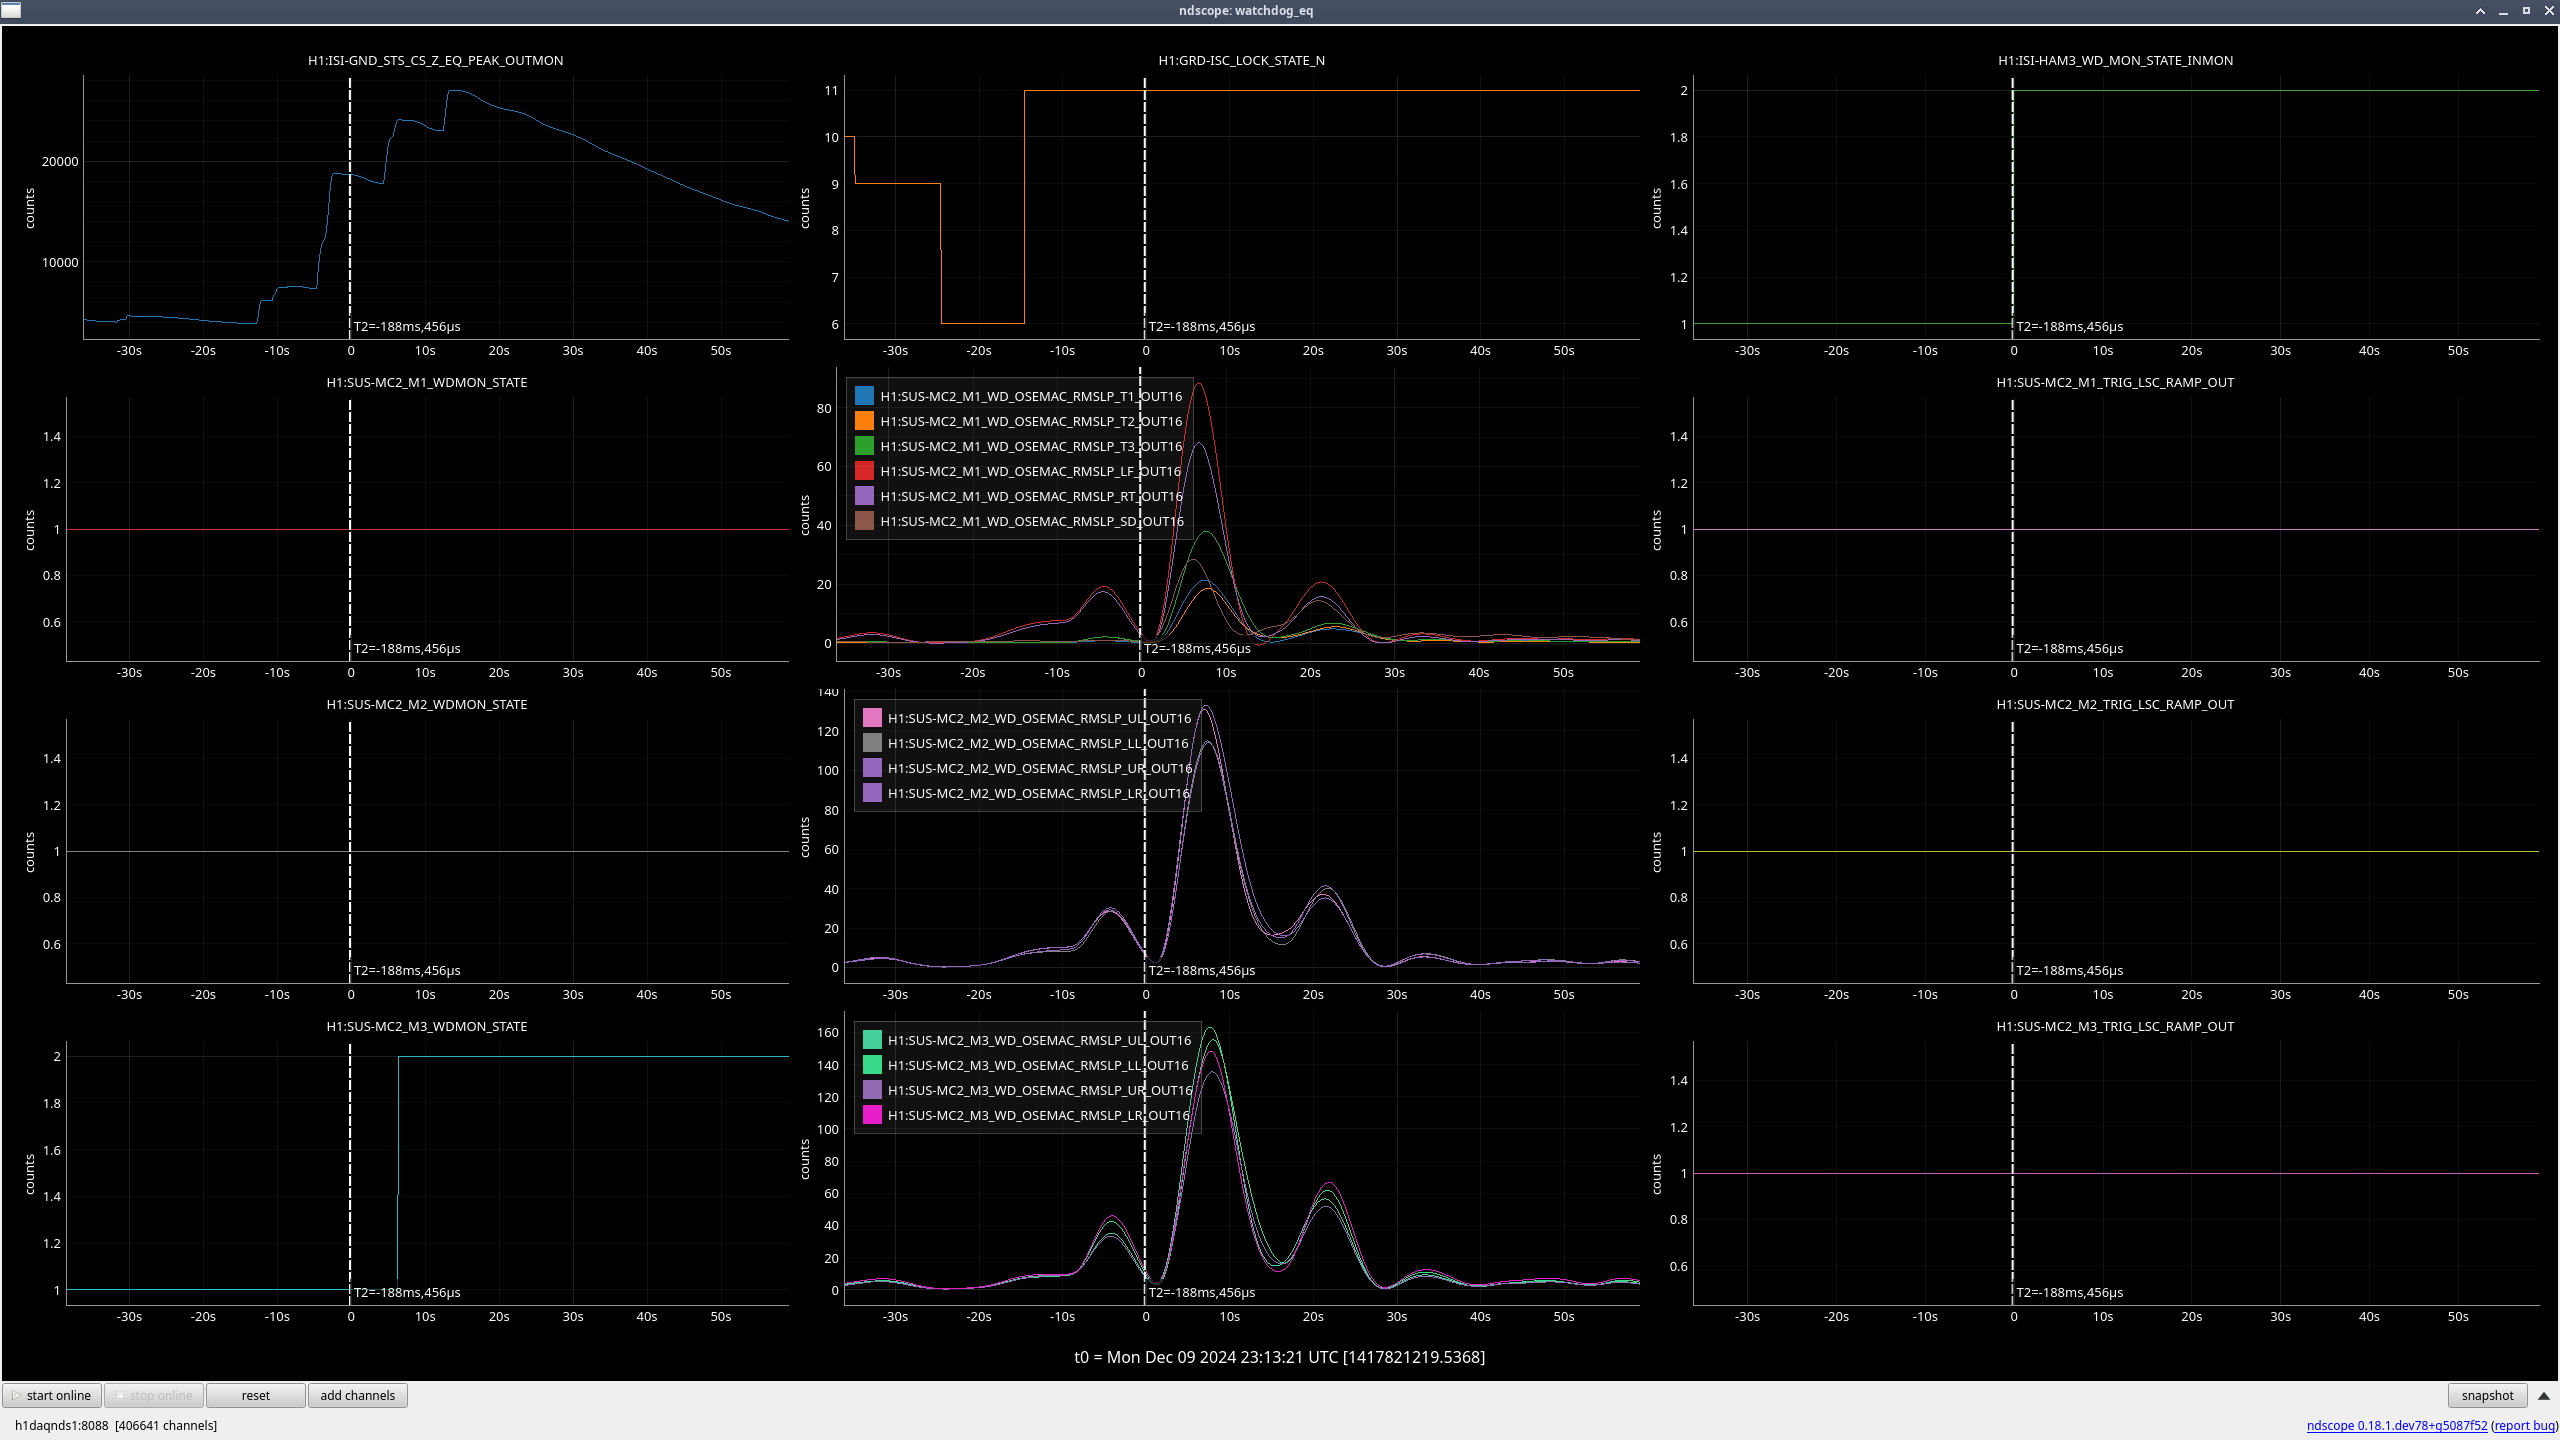
MC3 (M3) (ndscope1)
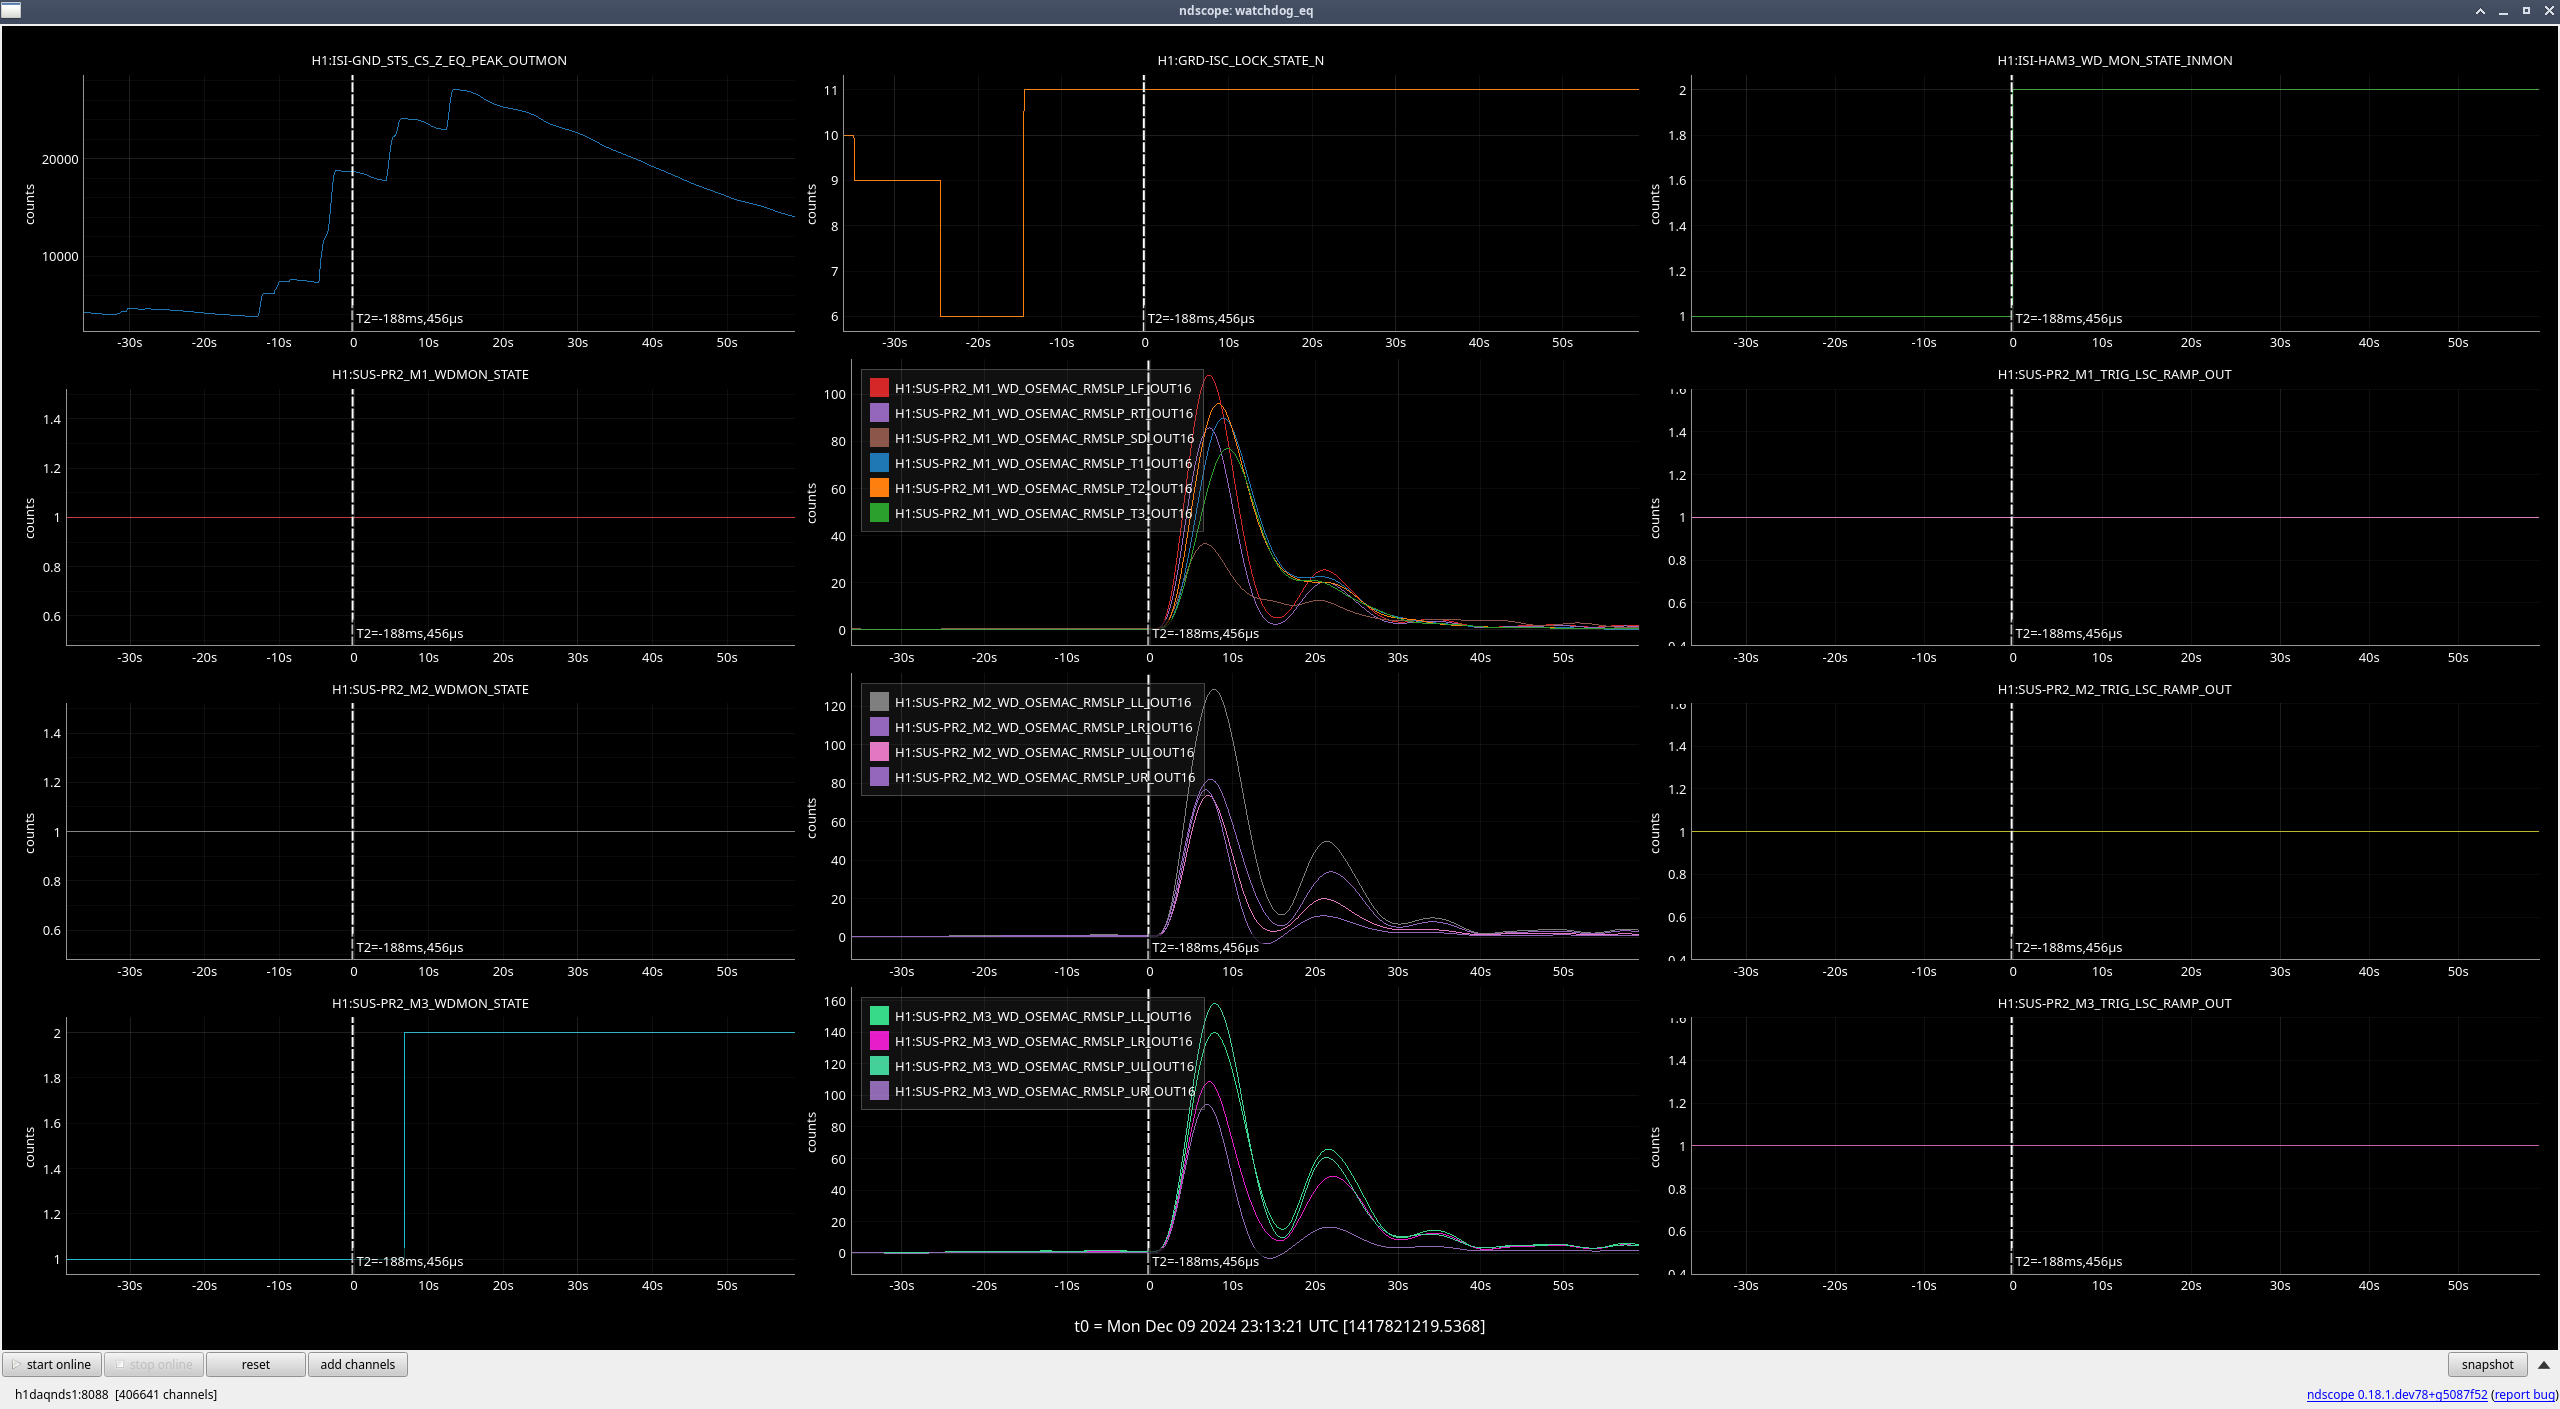
When the earthquake hit and we lost lock, all stages were moving due to the earthquake, but once HAM2 ISI tripped 5 seconds after the lockloss, the rate at which the OSEMs were moving quickly accelerated, so the excess motion looks to mainly be due to the ISI trip (ndscope2).
| Stage |
Original WD threshold |
Max BLRMS reached after lockloss |
New WD threshold |
| M1 |
150 |
86 |
150 (unchanged) |
| M2 |
150 |
136 |
175 |
| M3 |
150 |
159 |
200 |
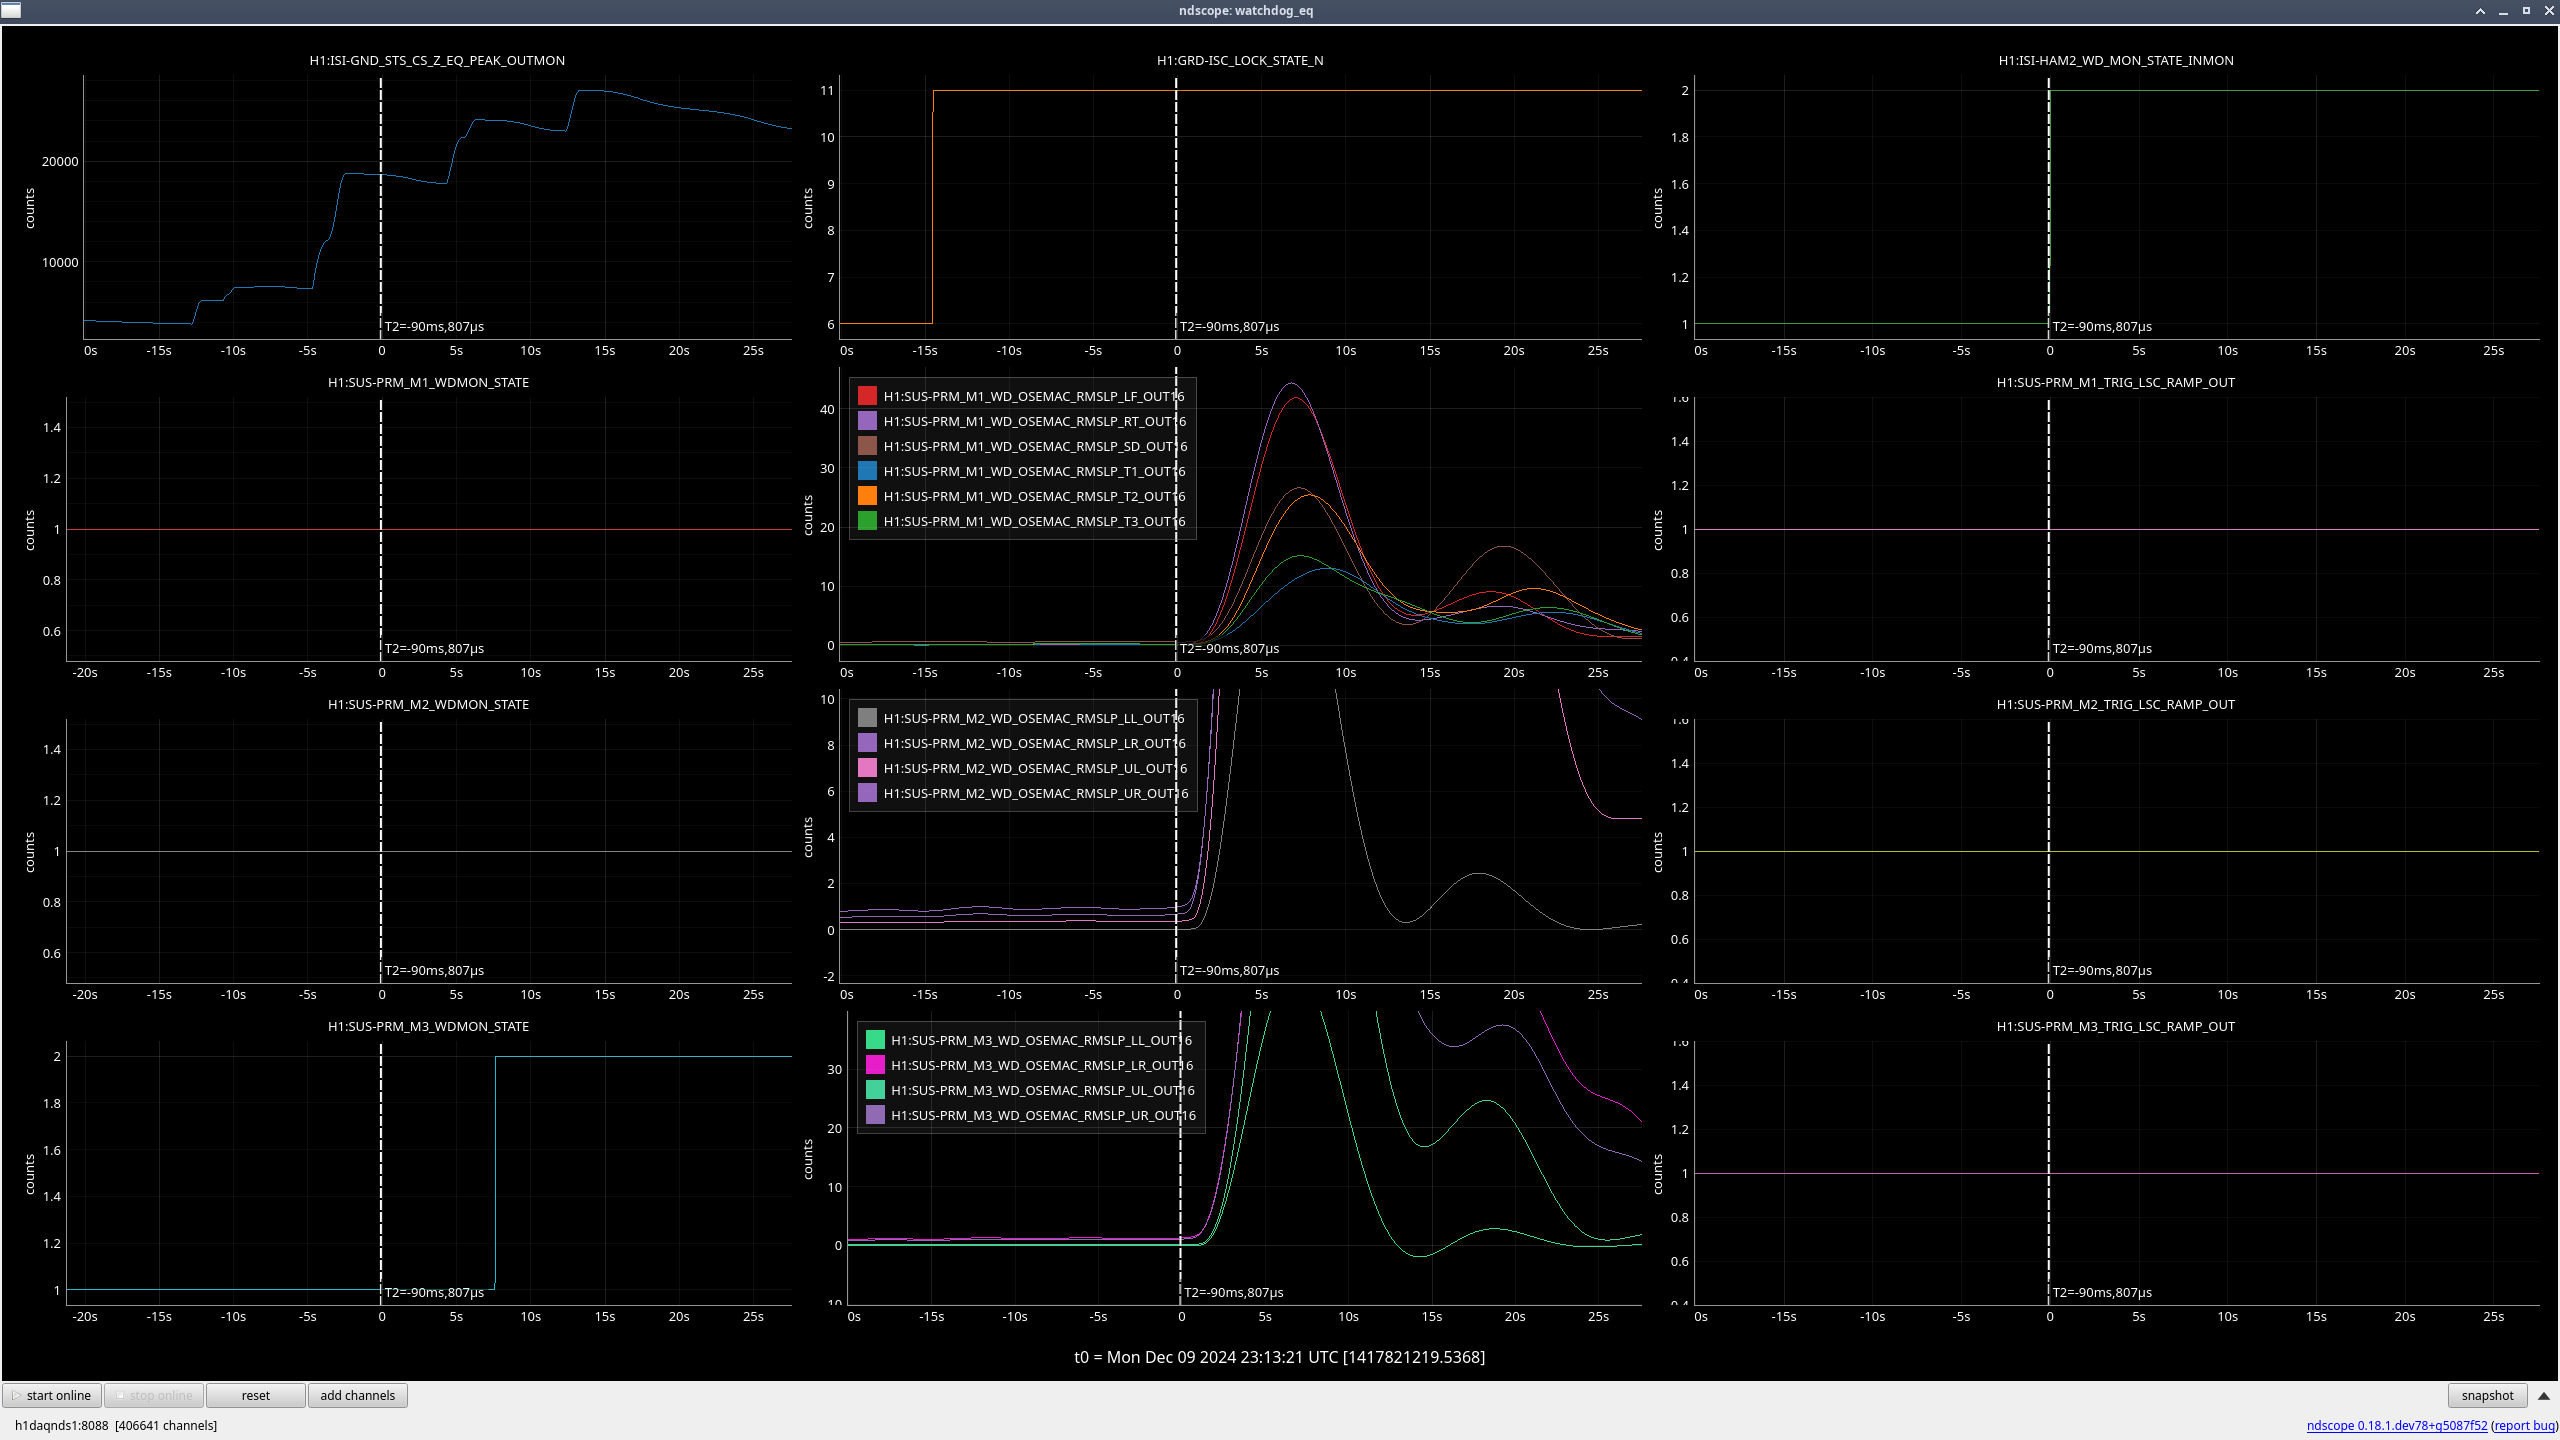
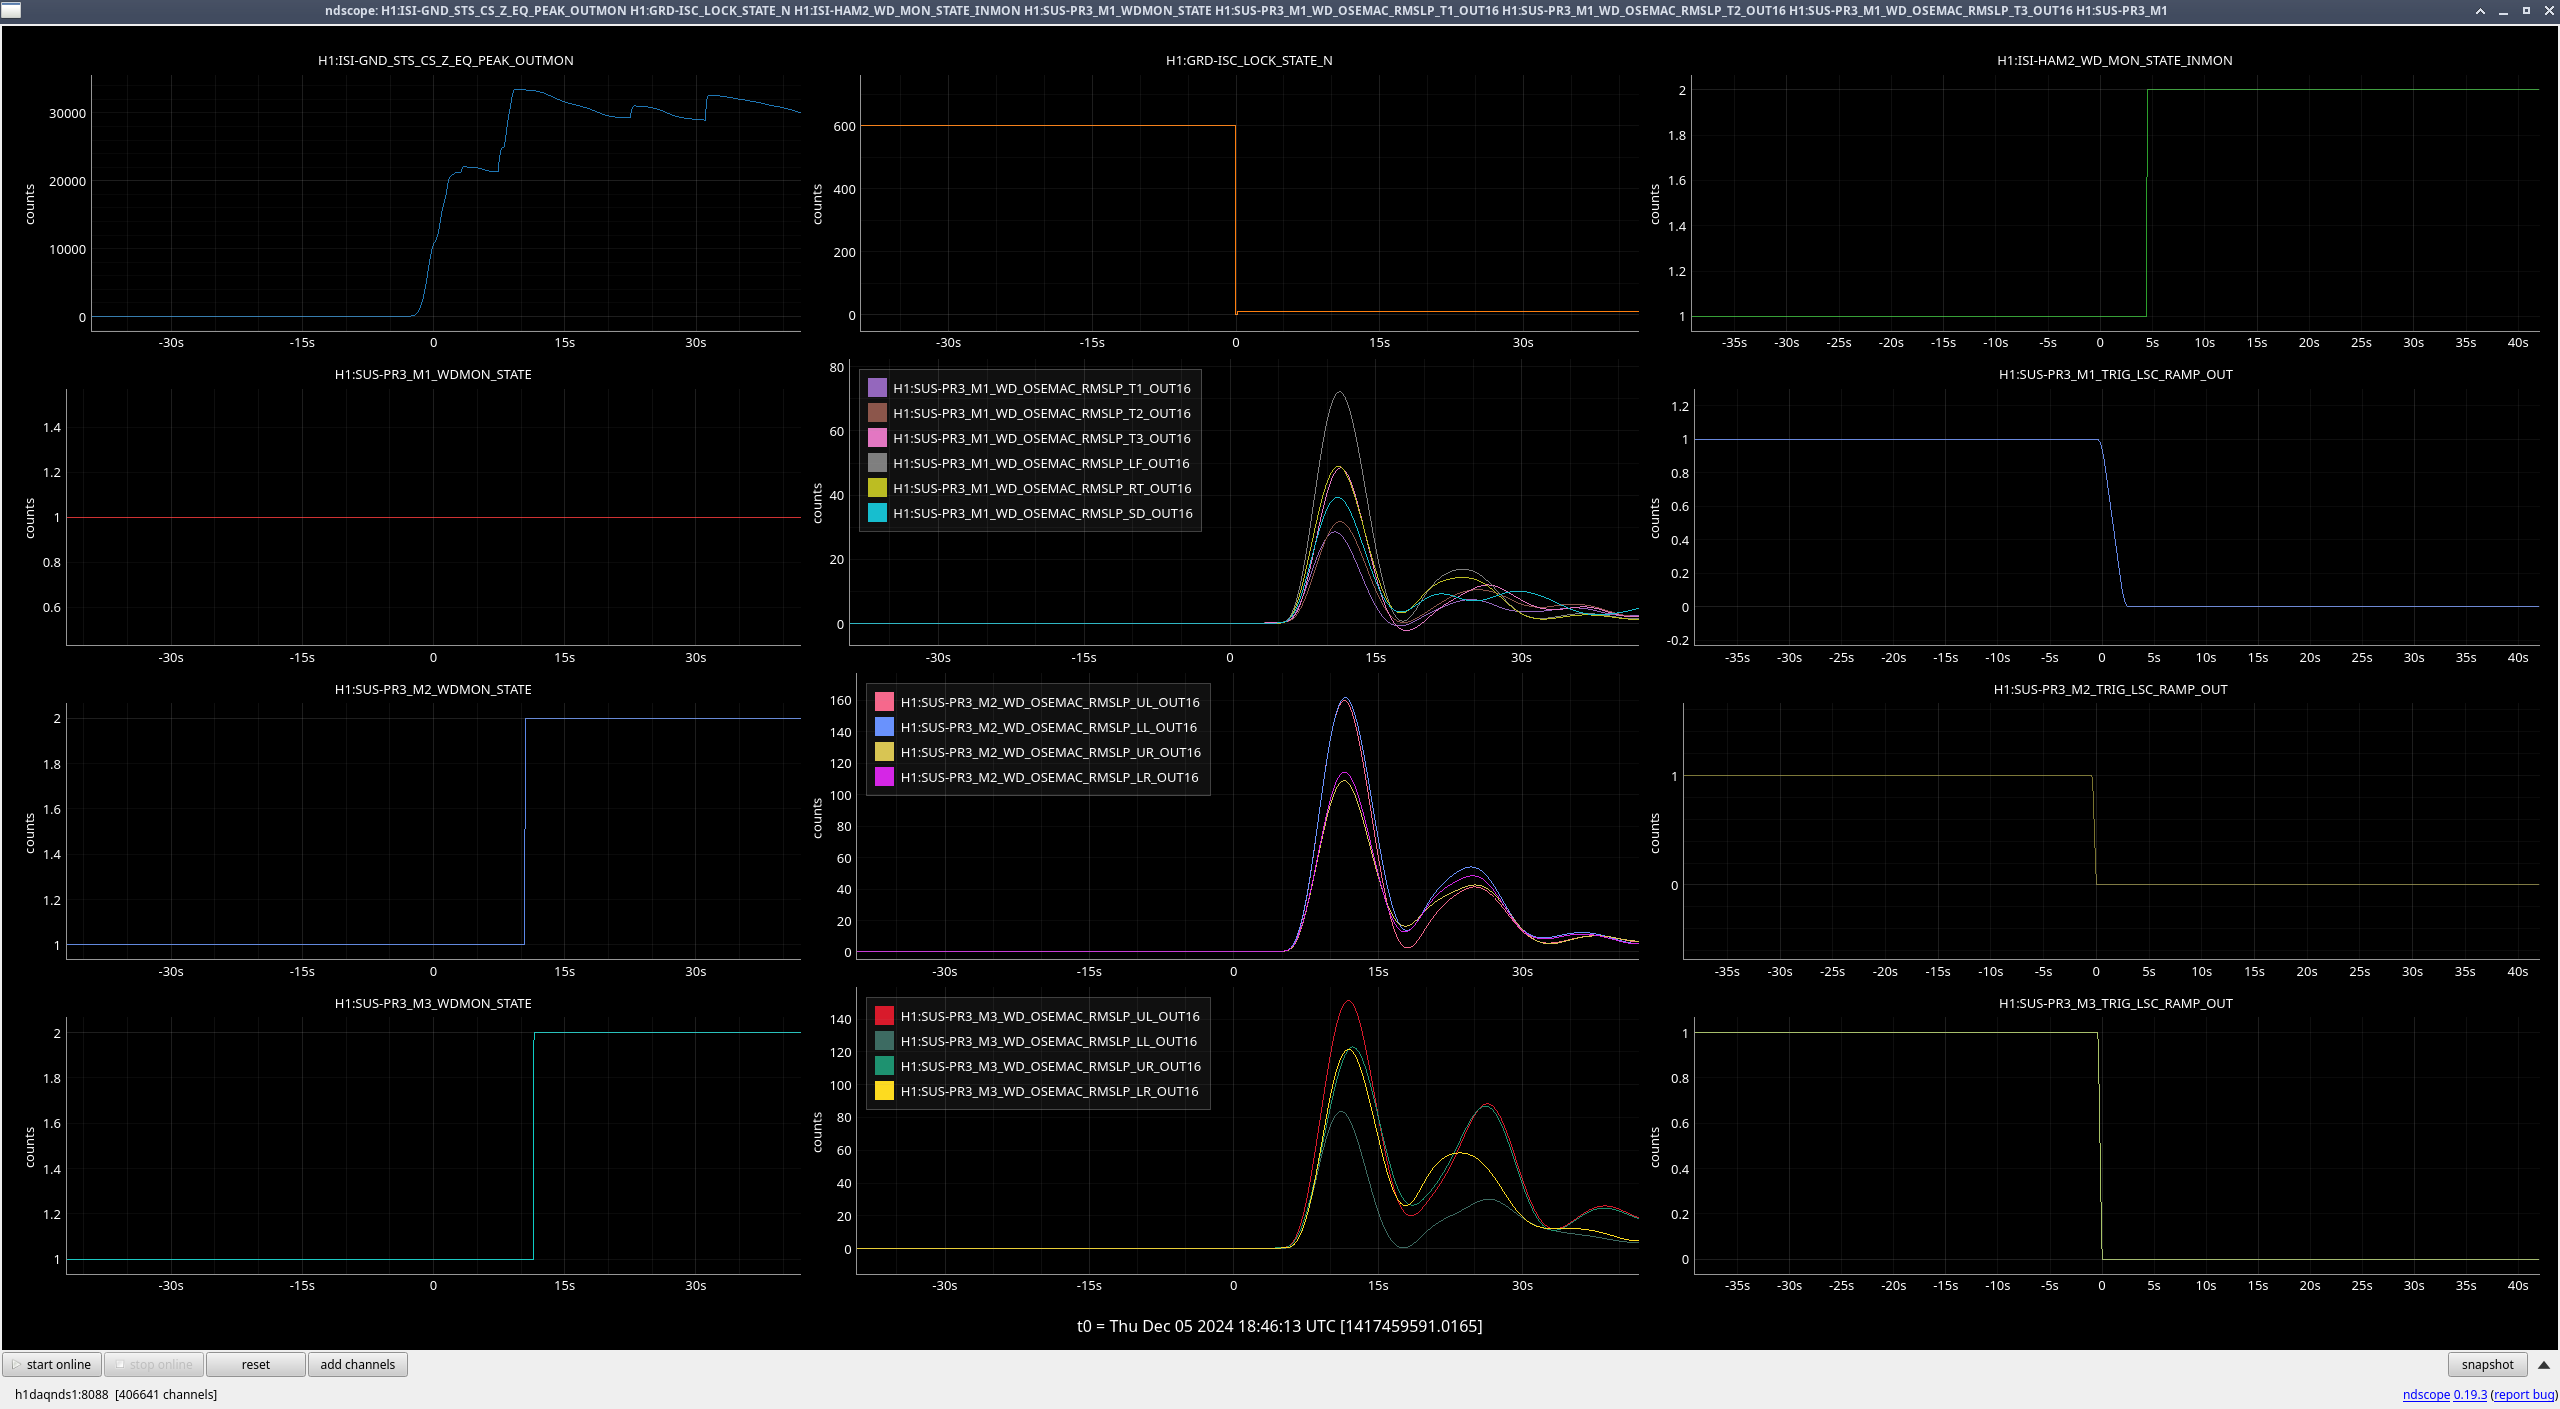
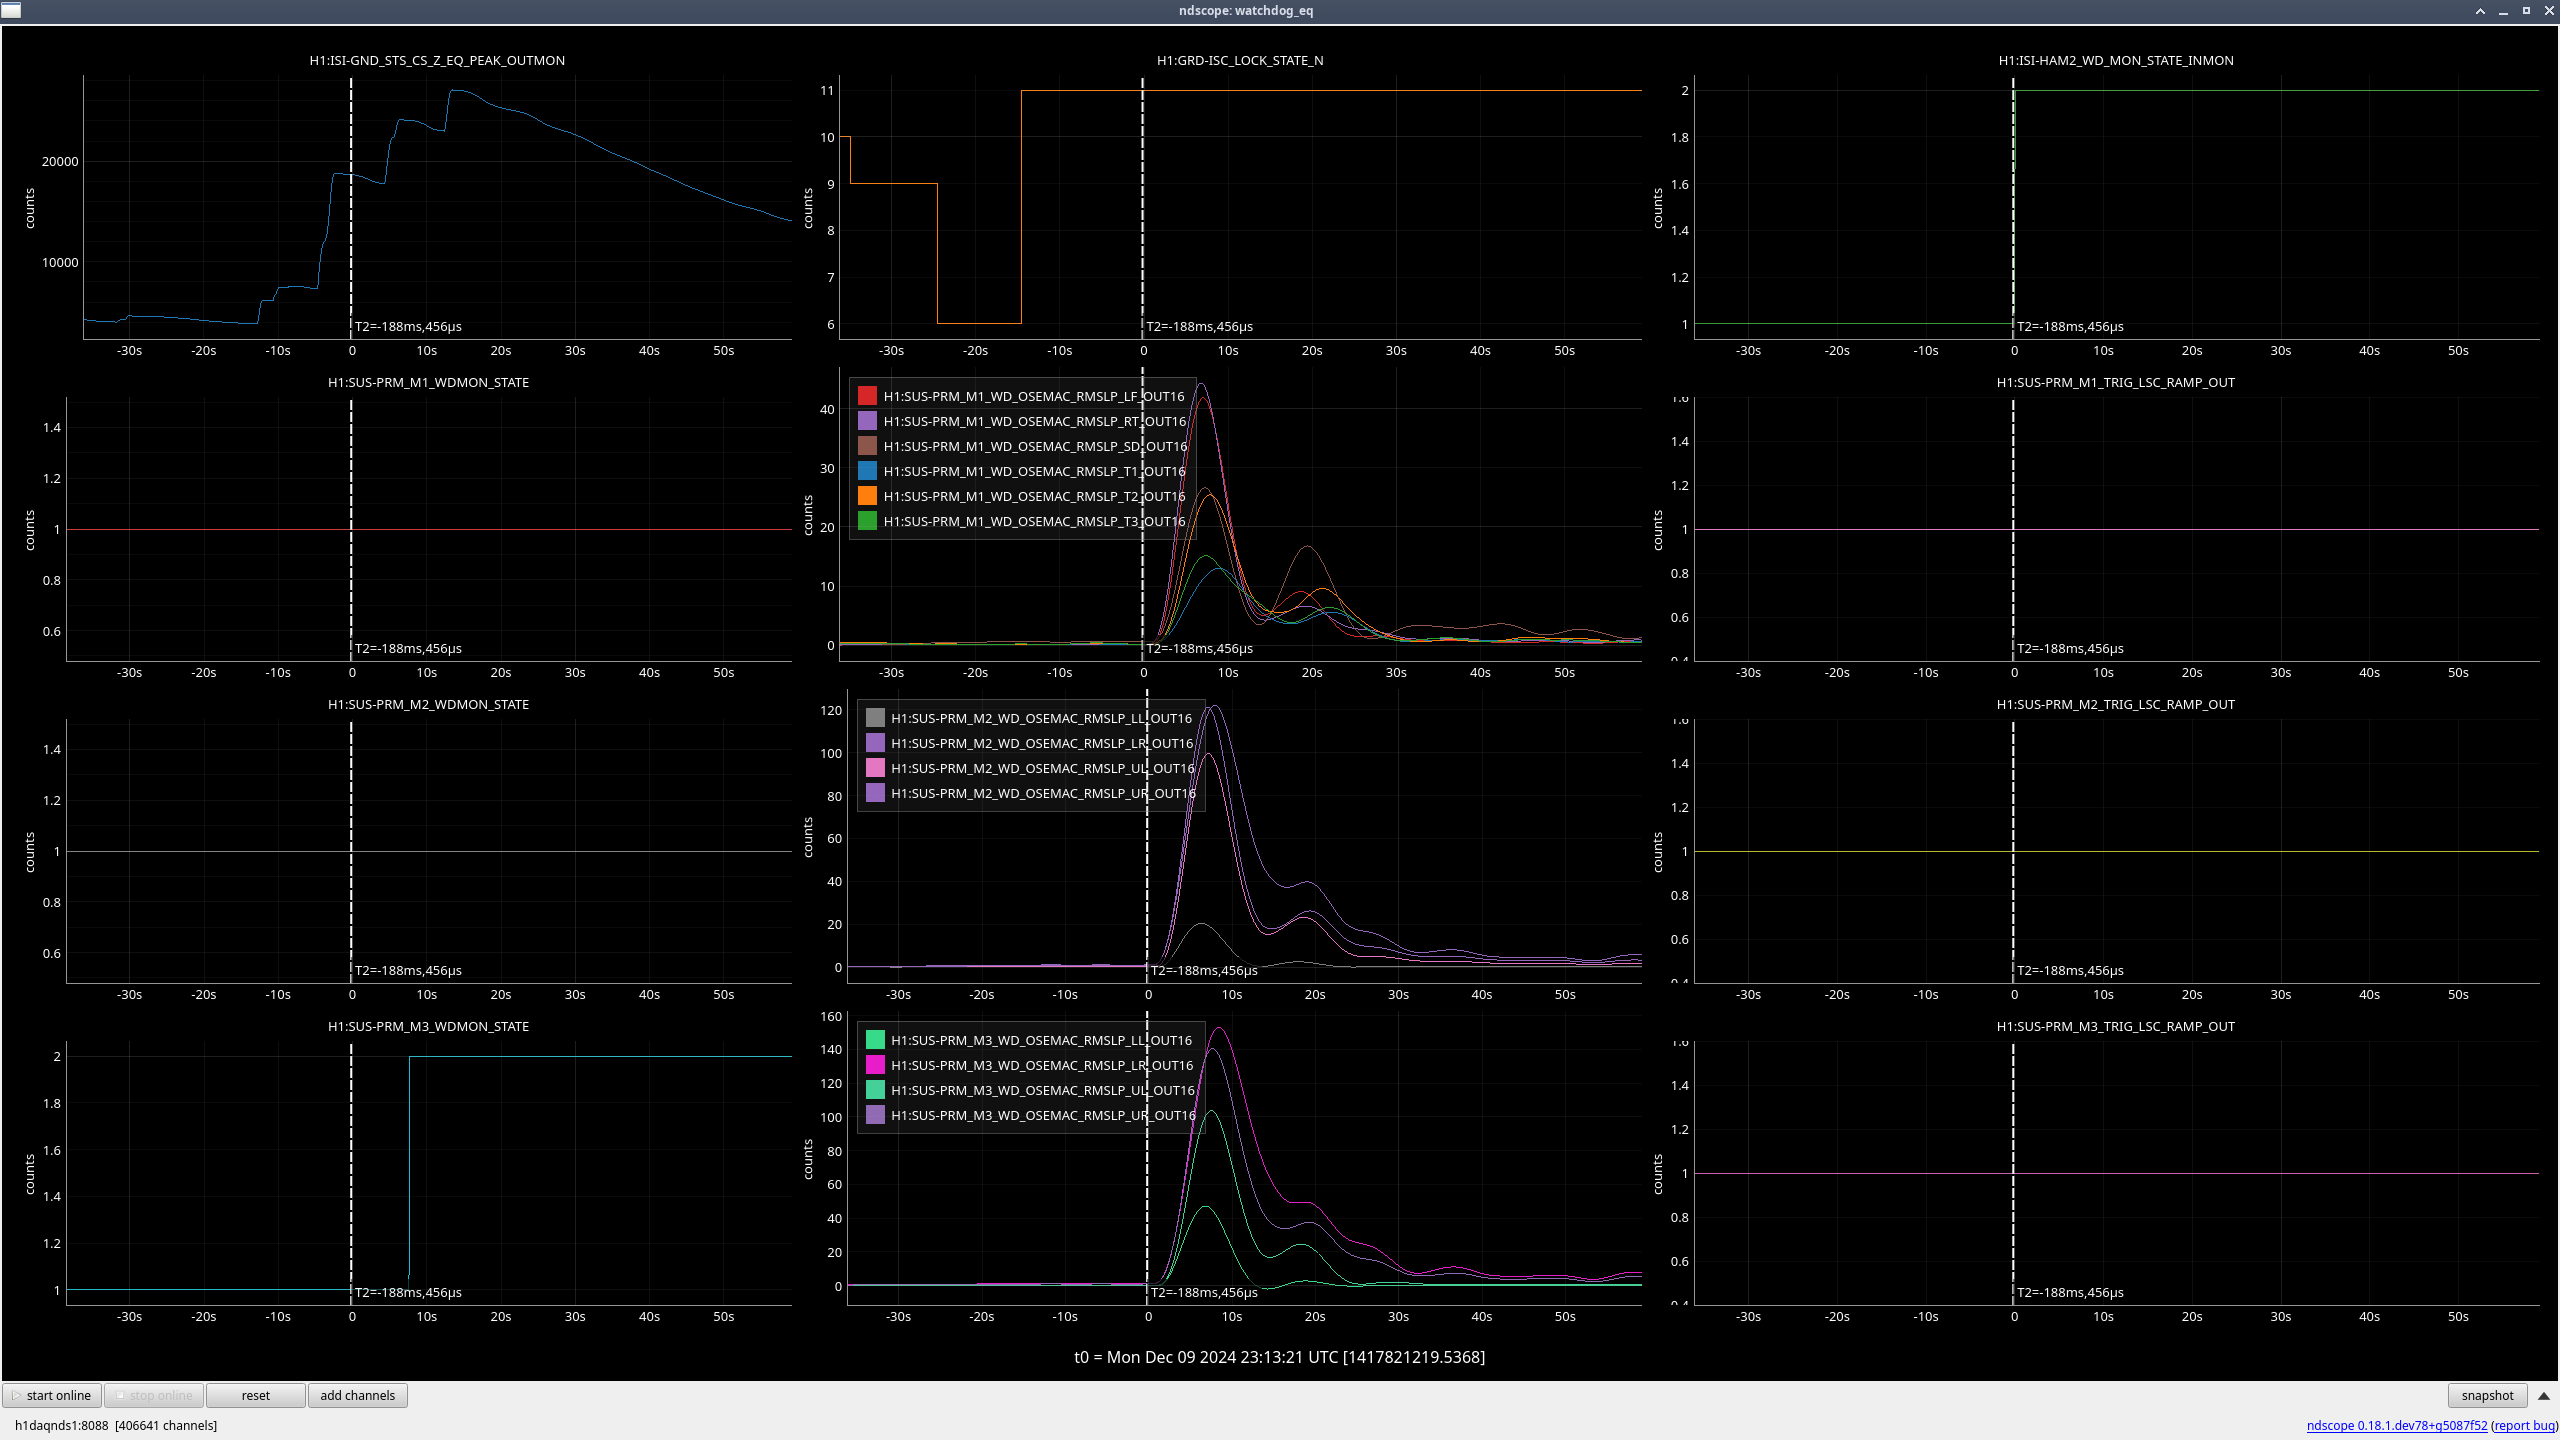
PR3 (M2, M3) (ndscope3)
Looks to be the same issue as with MC3.
| Stage |
Original WD threshold |
Max BLRMS reached after lockloss |
New WD threshold |
| M1 |
150 |
72 |
150 (unchanged) |
| M2 |
150 |
162 |
200 |
| M3 |
150 |
151 |
200 |
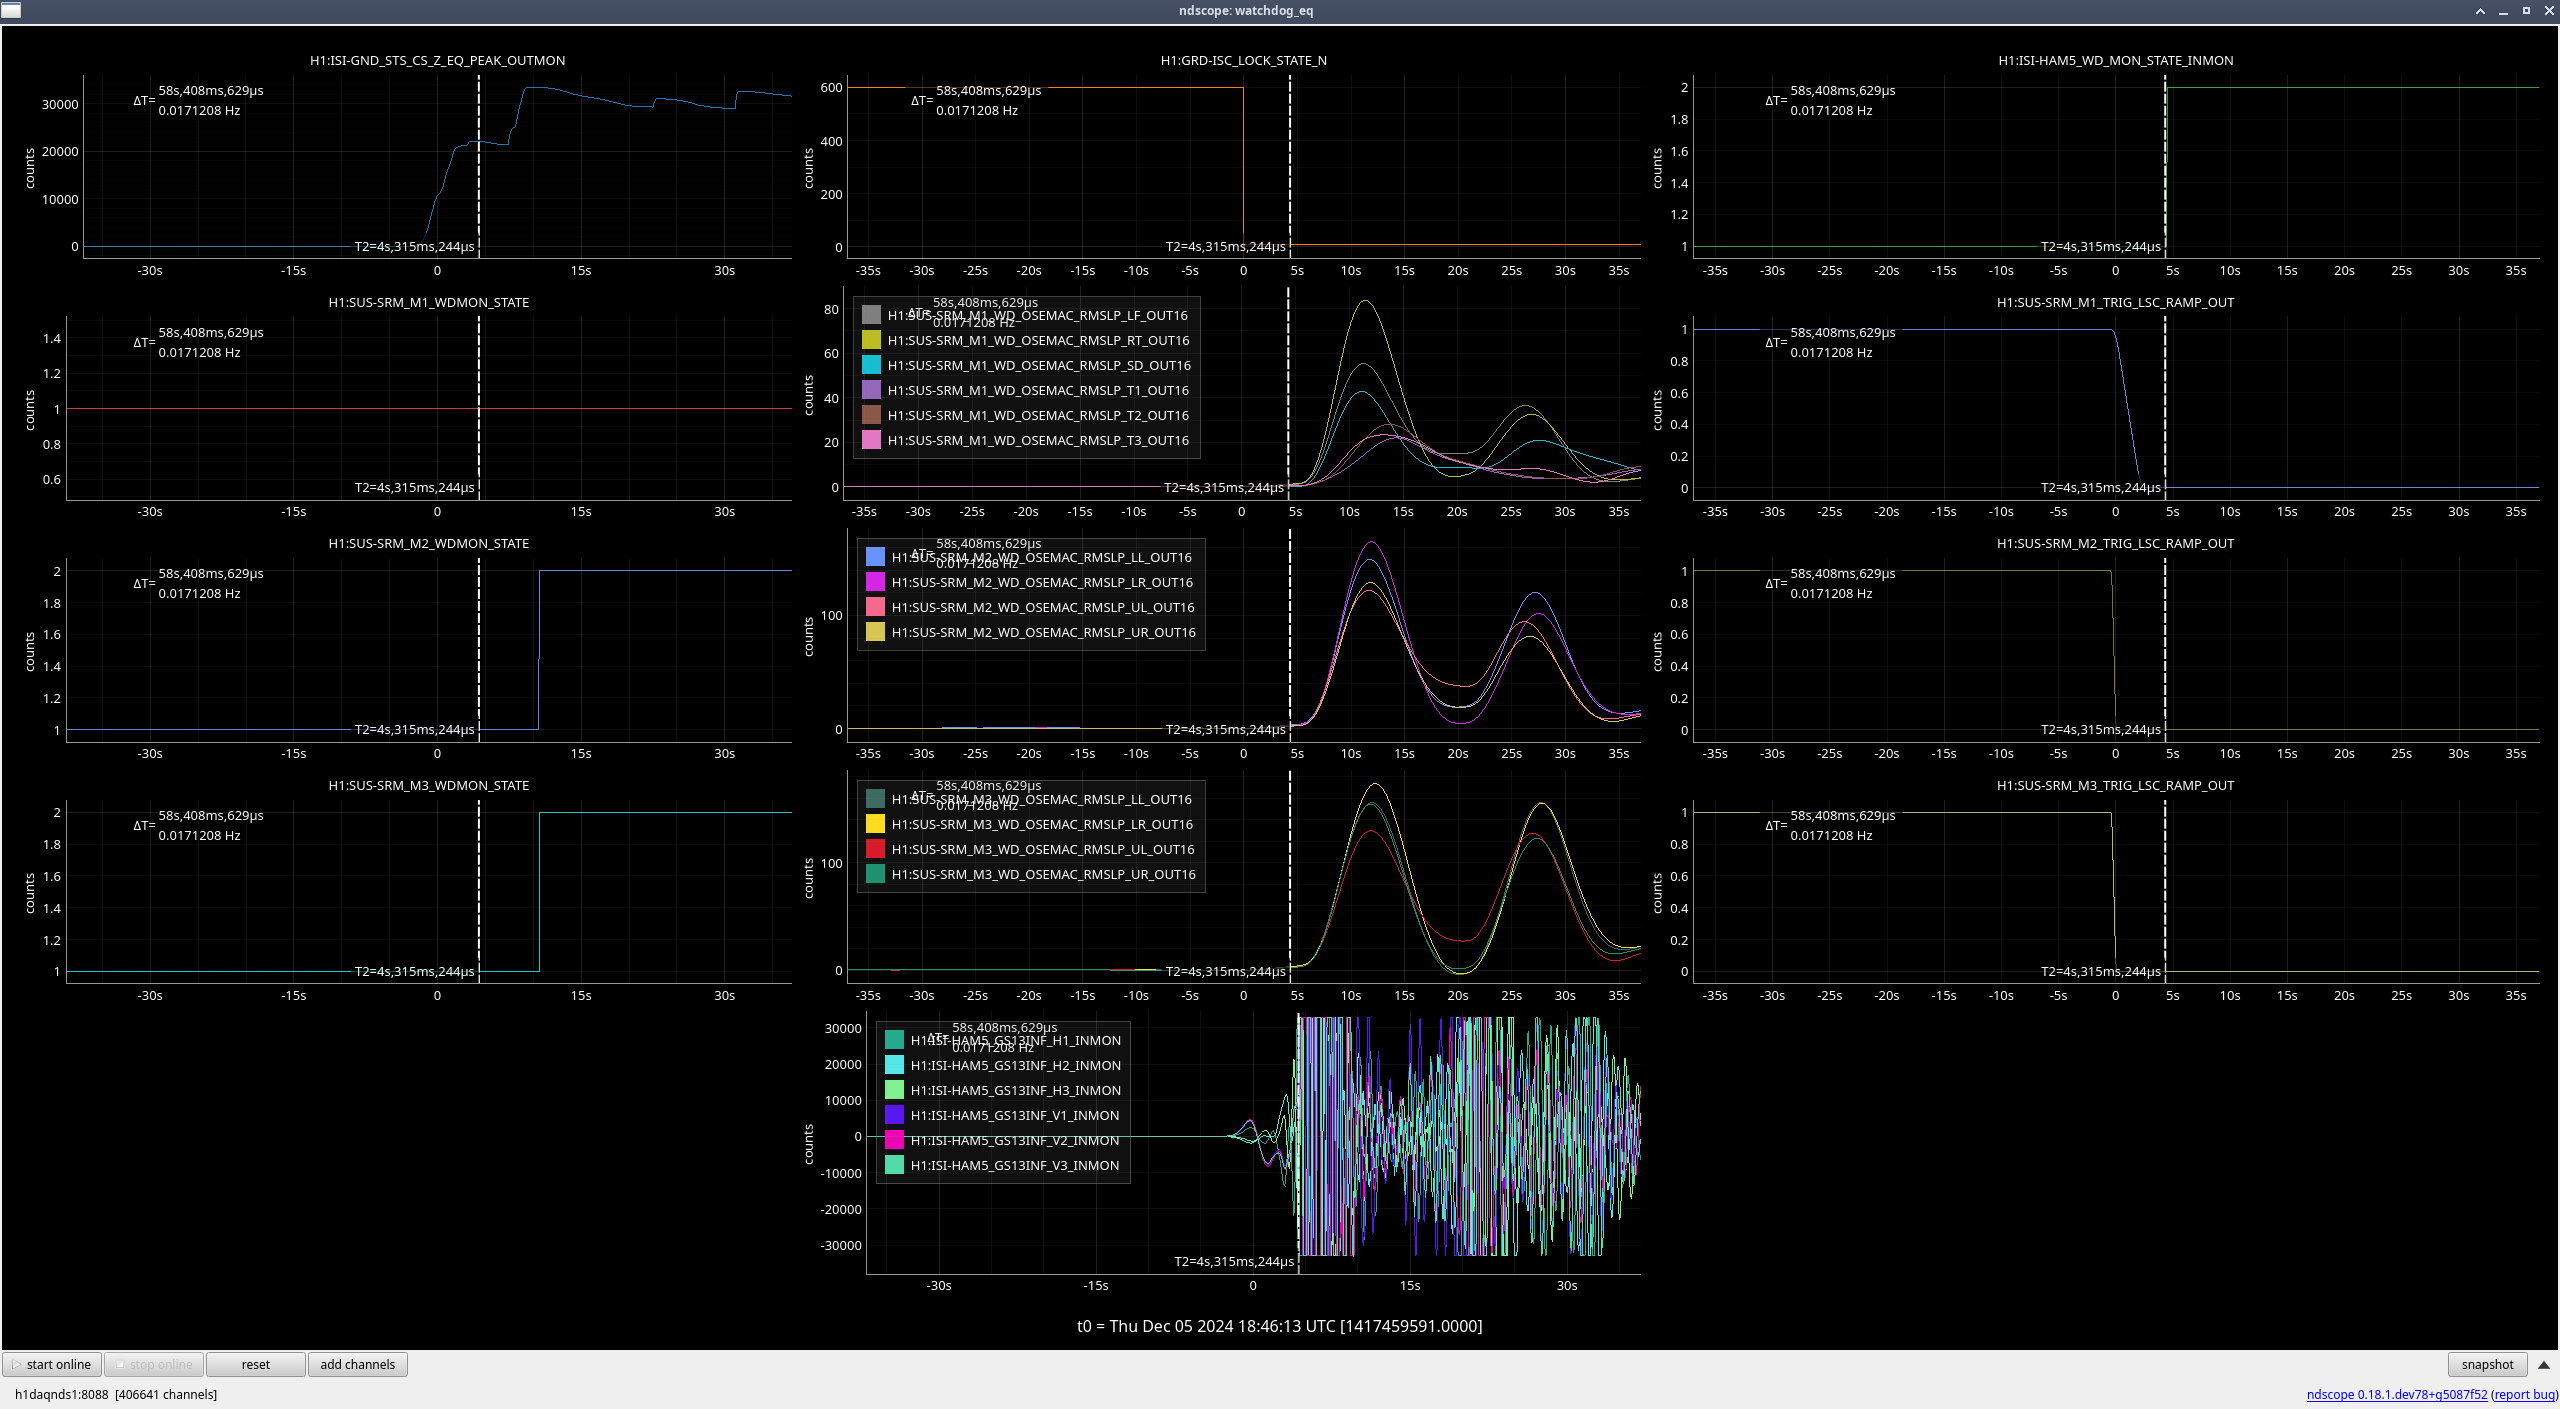
SRM (M2, M3) (ndscope4)
Once again, the OSEMs are moving after the lockloss due to the earthquake, but the rate they were moving at greatly increased once HAM5 saturated and the ISI watchdogs tripped.
| Stage |
Original WD threshold |
Max BLRMS reached after lockloss |
New WD threshold |
| M1 |
150 |
84 |
150 (unchanged) |
| M2 |
150 |
165 |
200 |
| M3 |
150 |
174 |
225 |
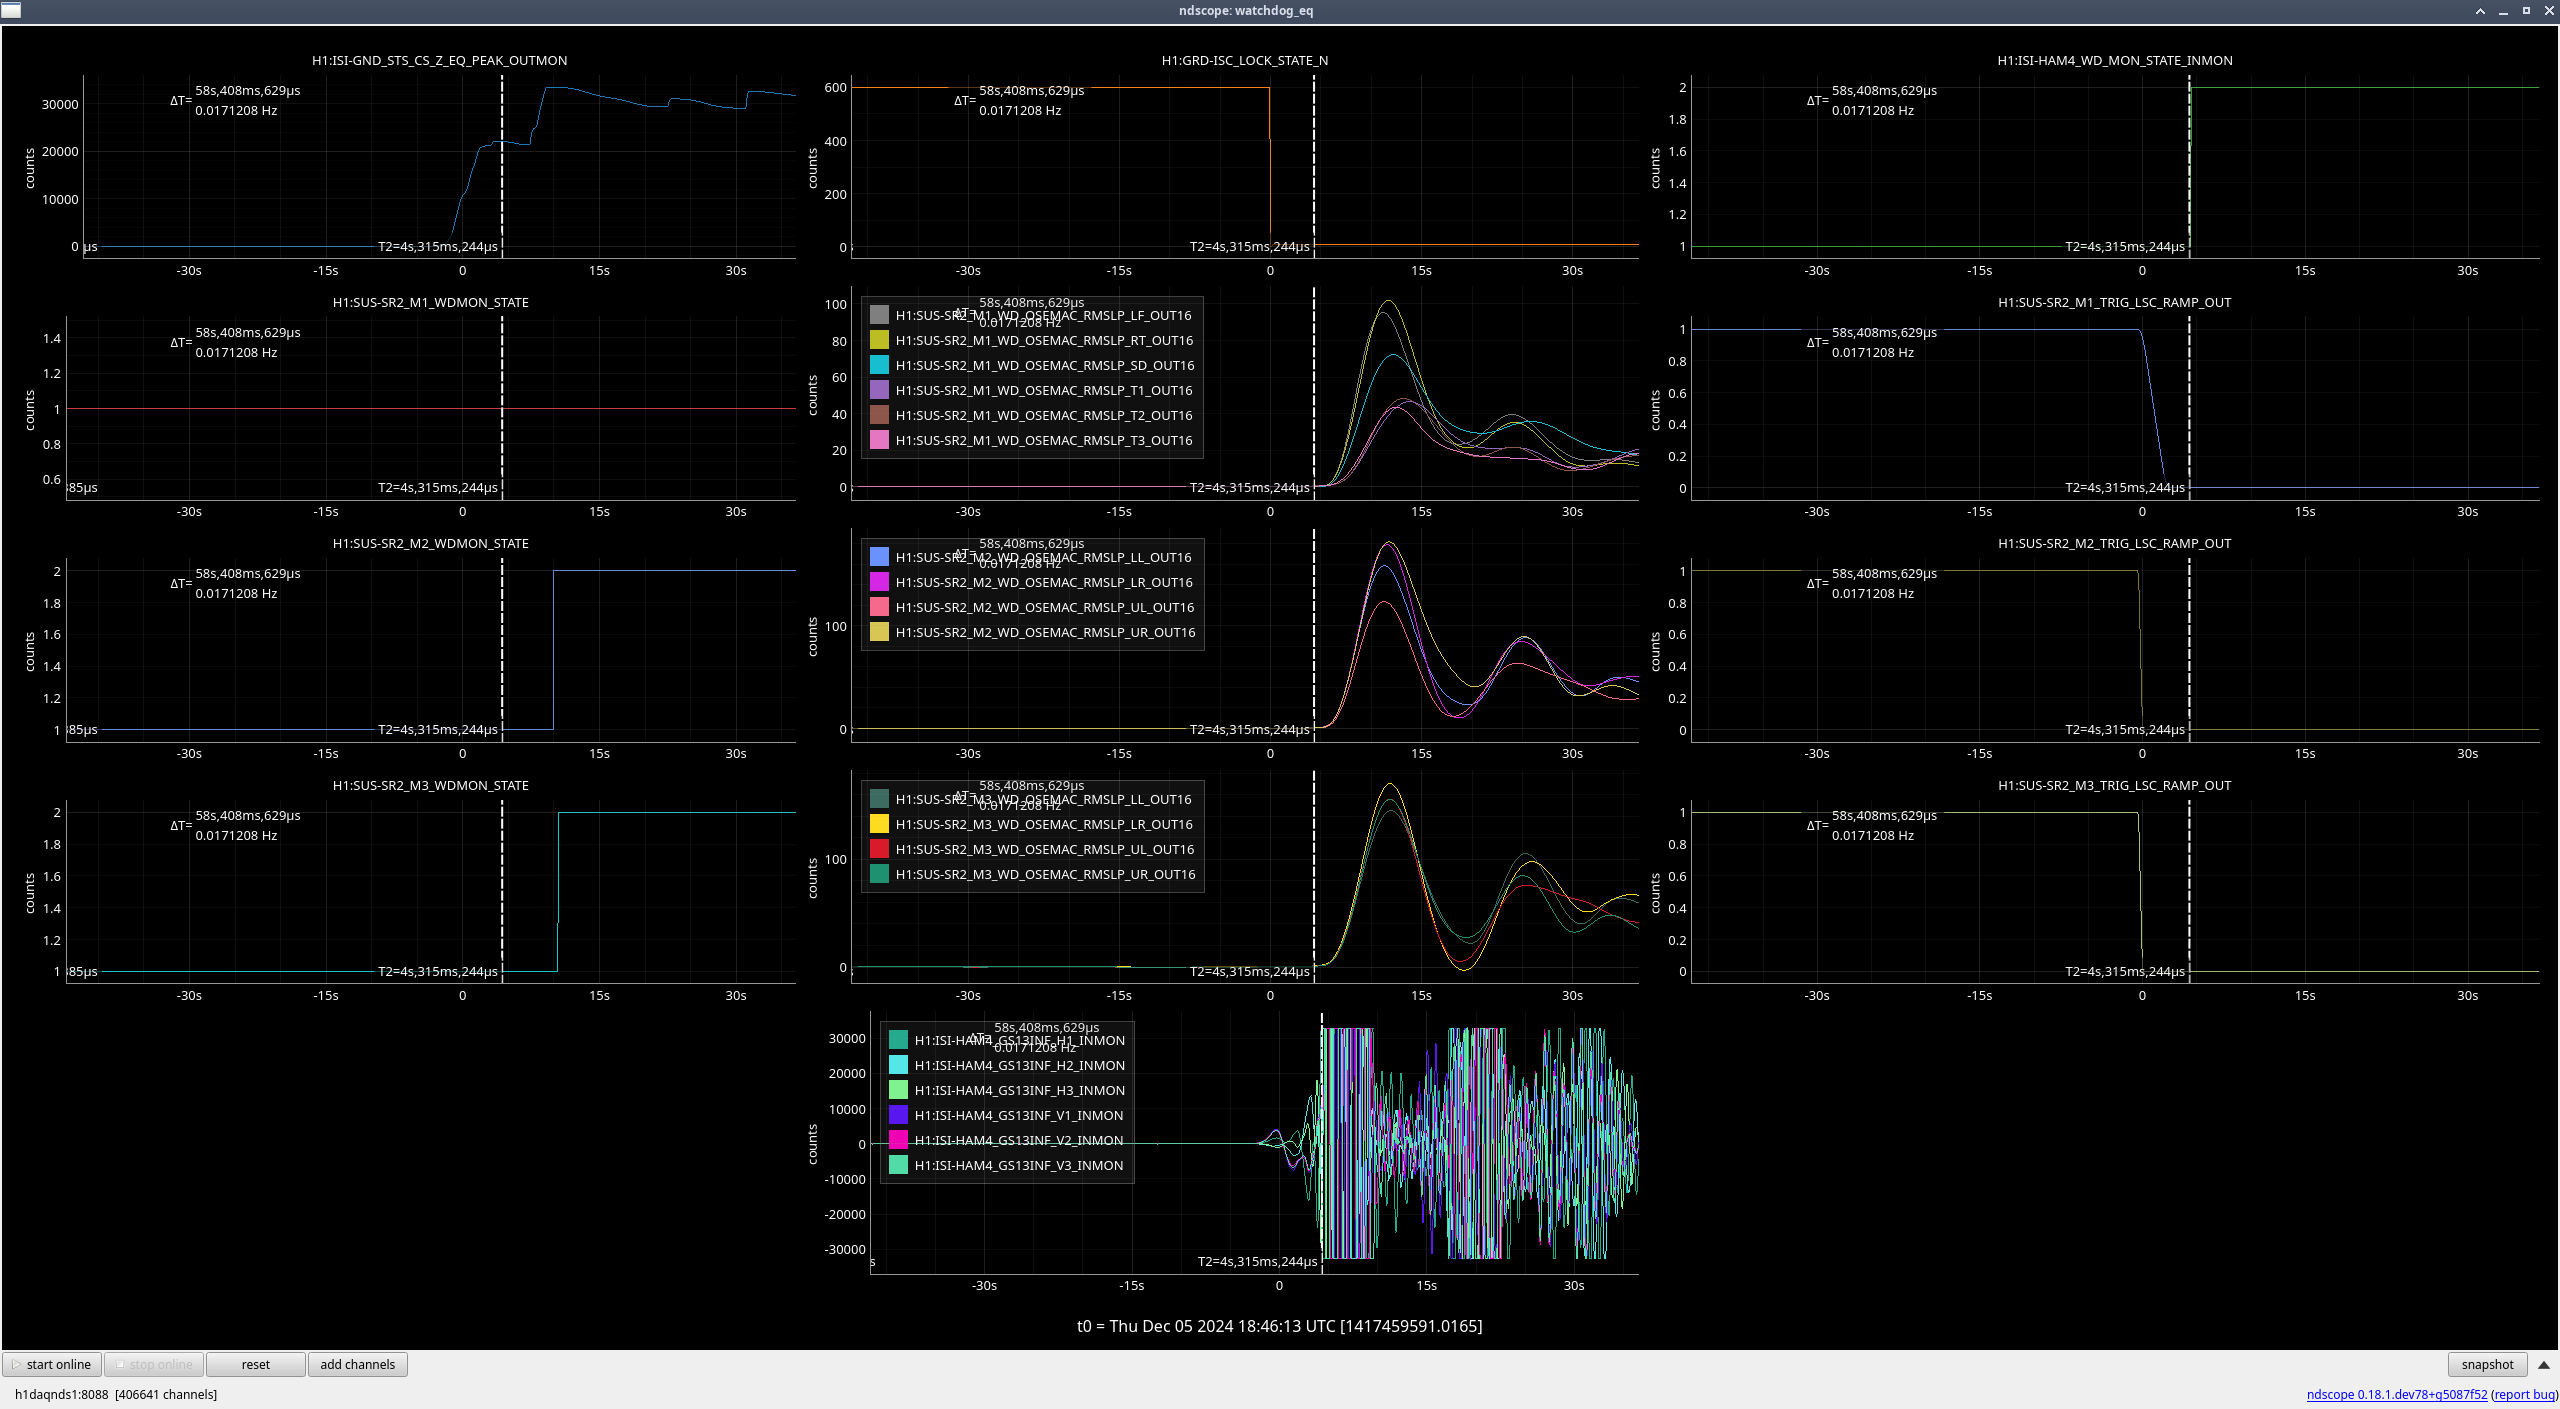
SR2 (M2, M3) (ndscope5)
Again, the OSEMs are moving after the lockloss due to the earthquake, but the rate they were moving at greatly increased once HAM4 saturated and the ISI watchdogs tripped.
| Stage |
Original WD threshold |
Max BLRMS reached after lockloss |
New WD threshold |
| M1 |
150 |
102 |
150 (unchanged) |
| M2 |
150 |
182 |
225 |
| M3 |
150 |
171 |
225 |
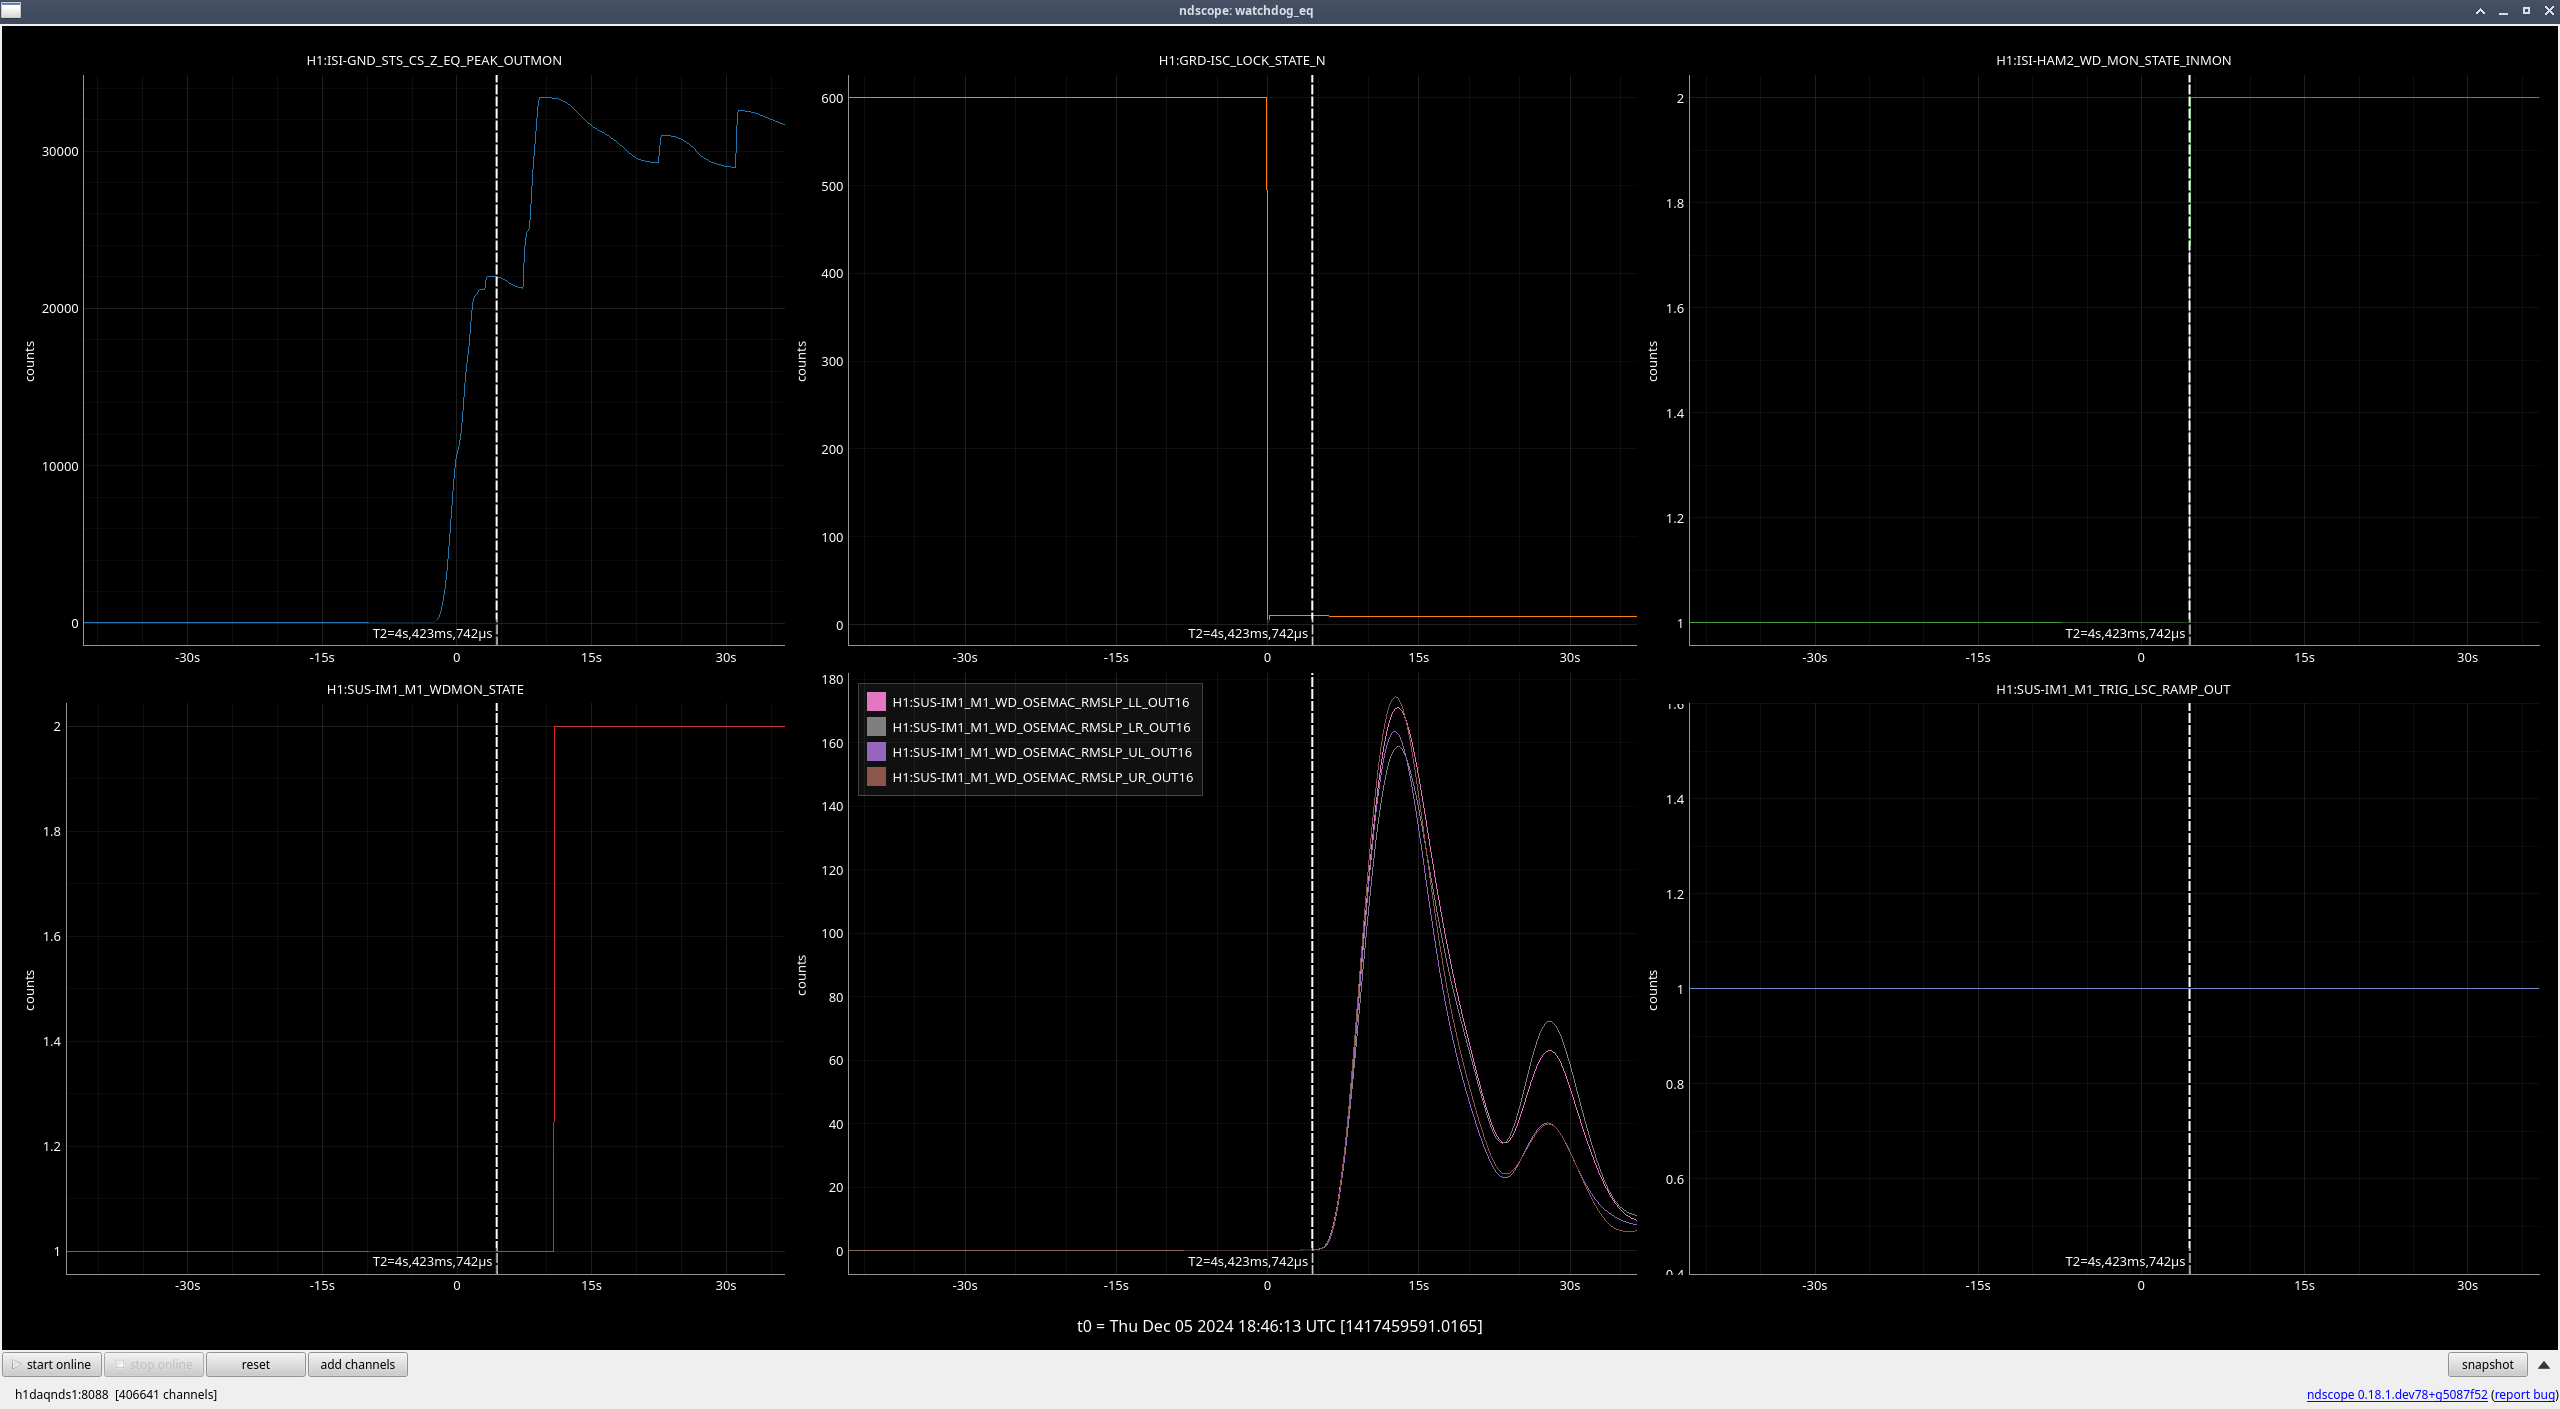
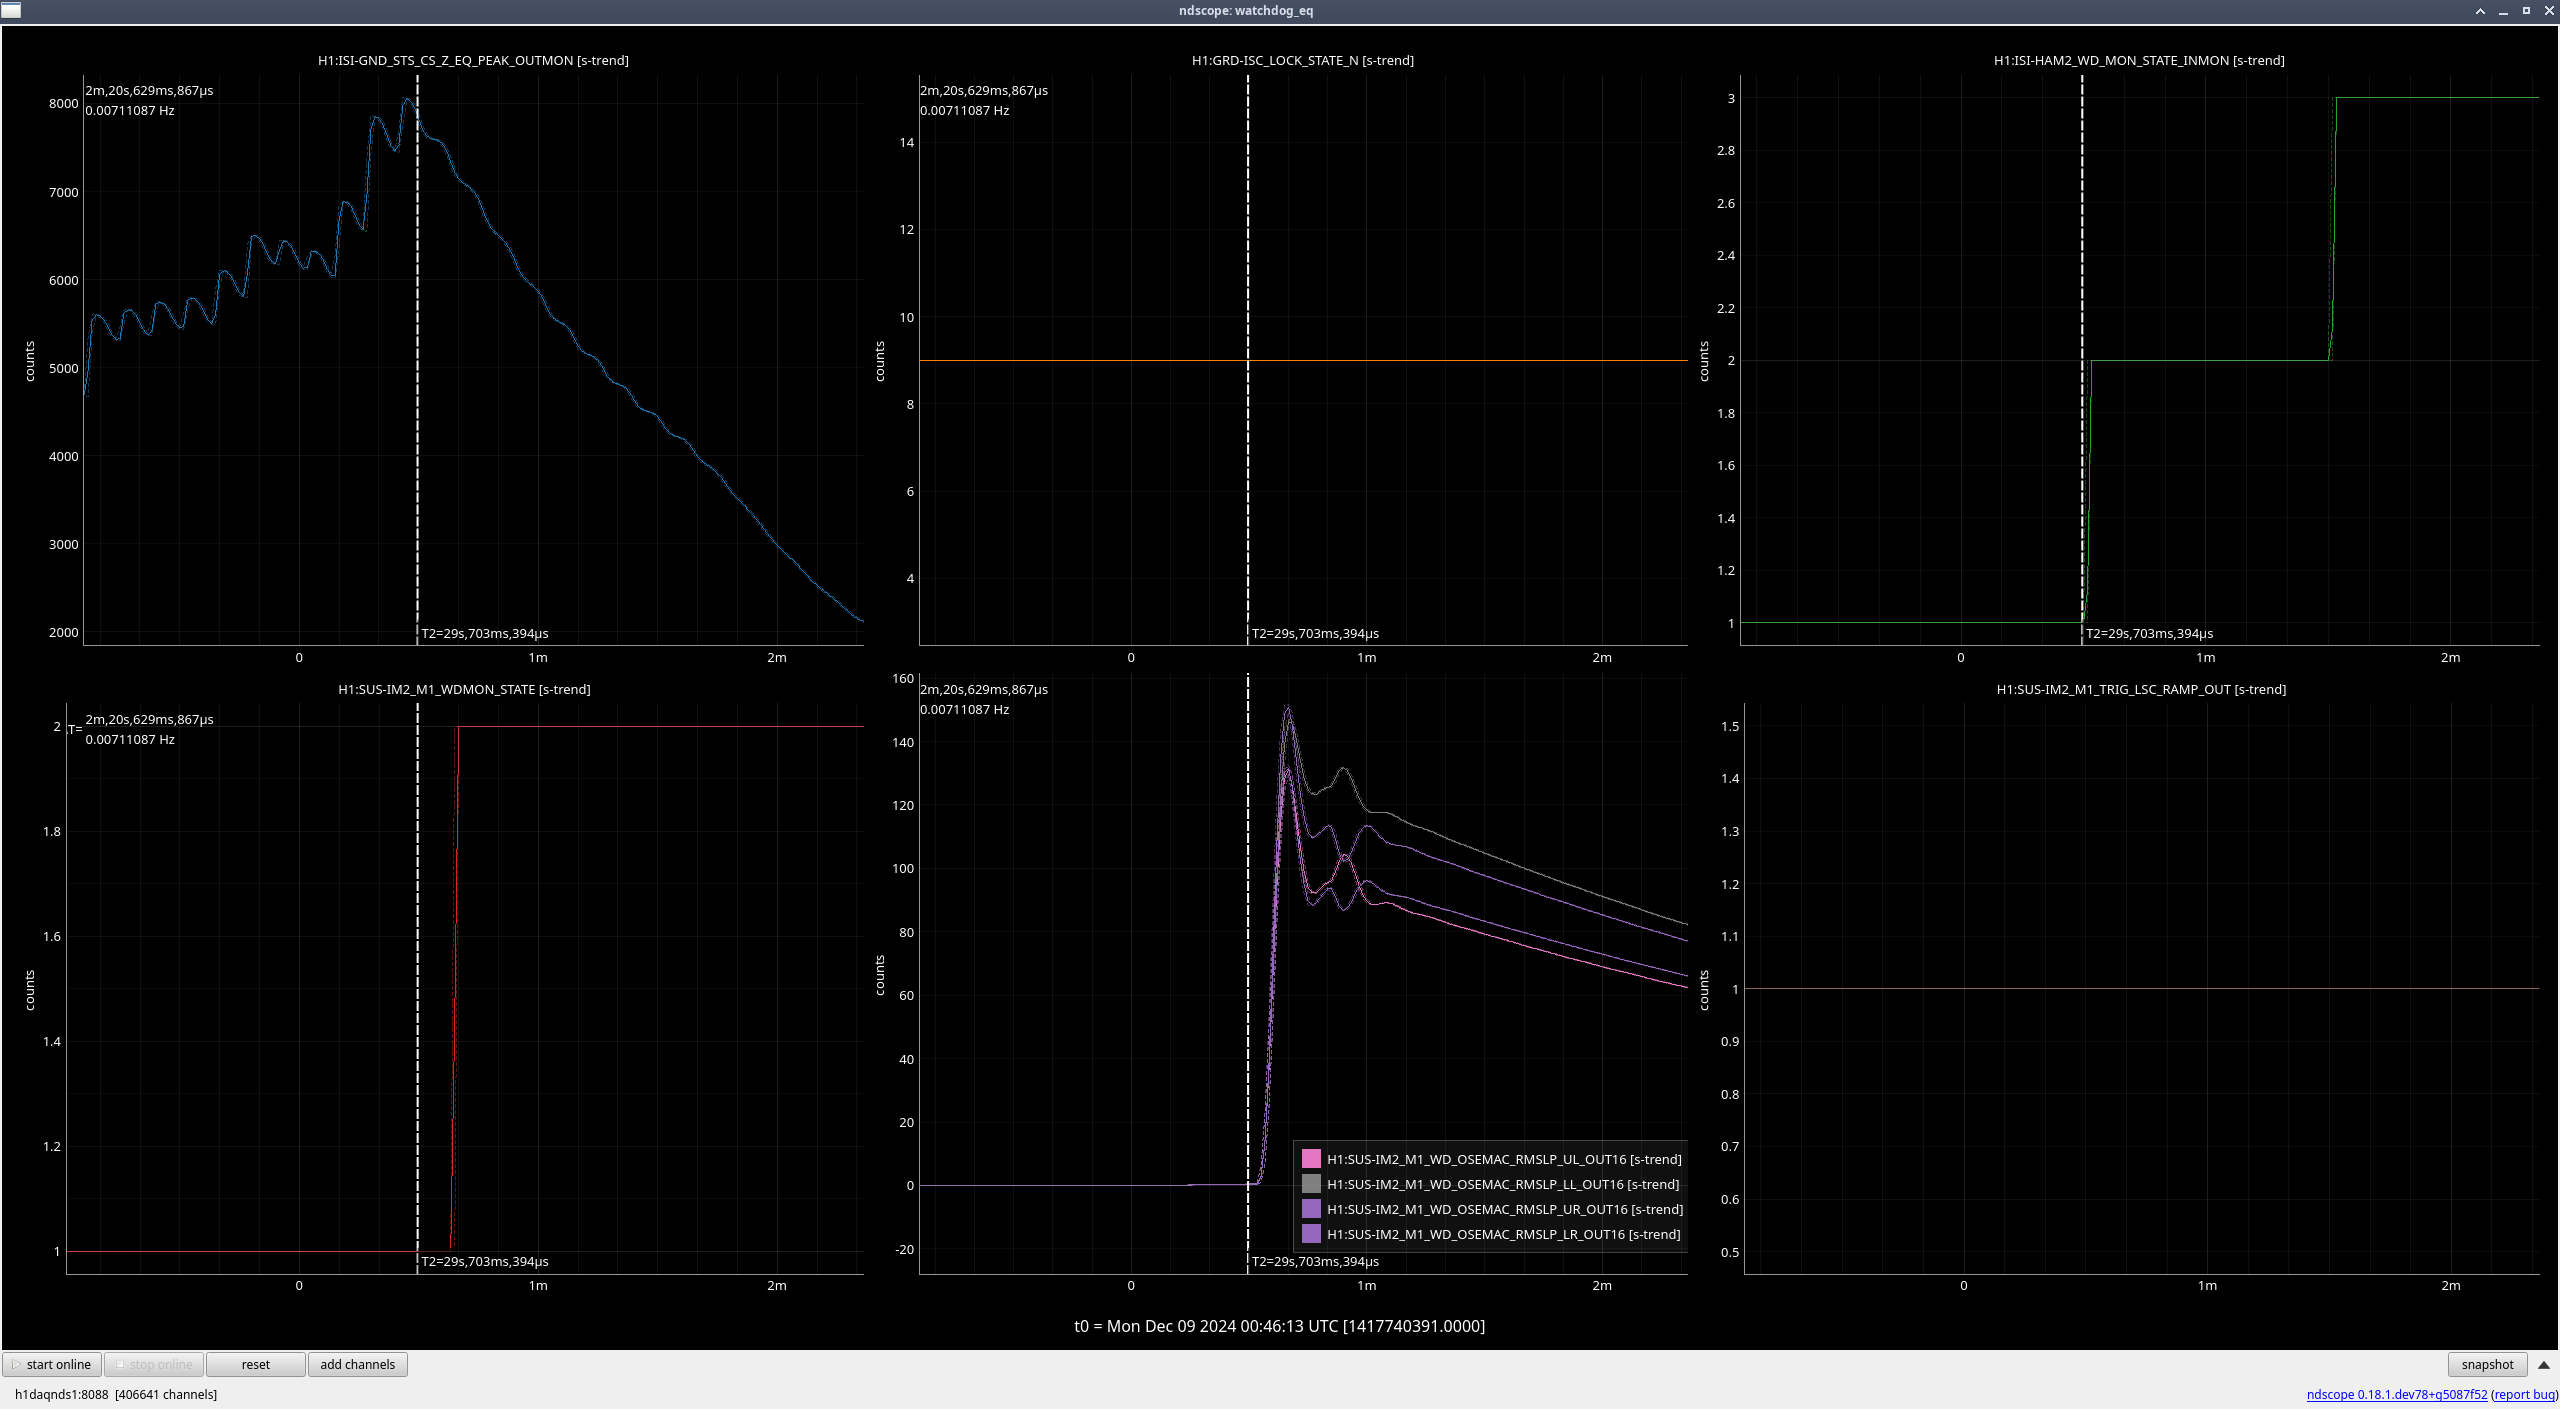
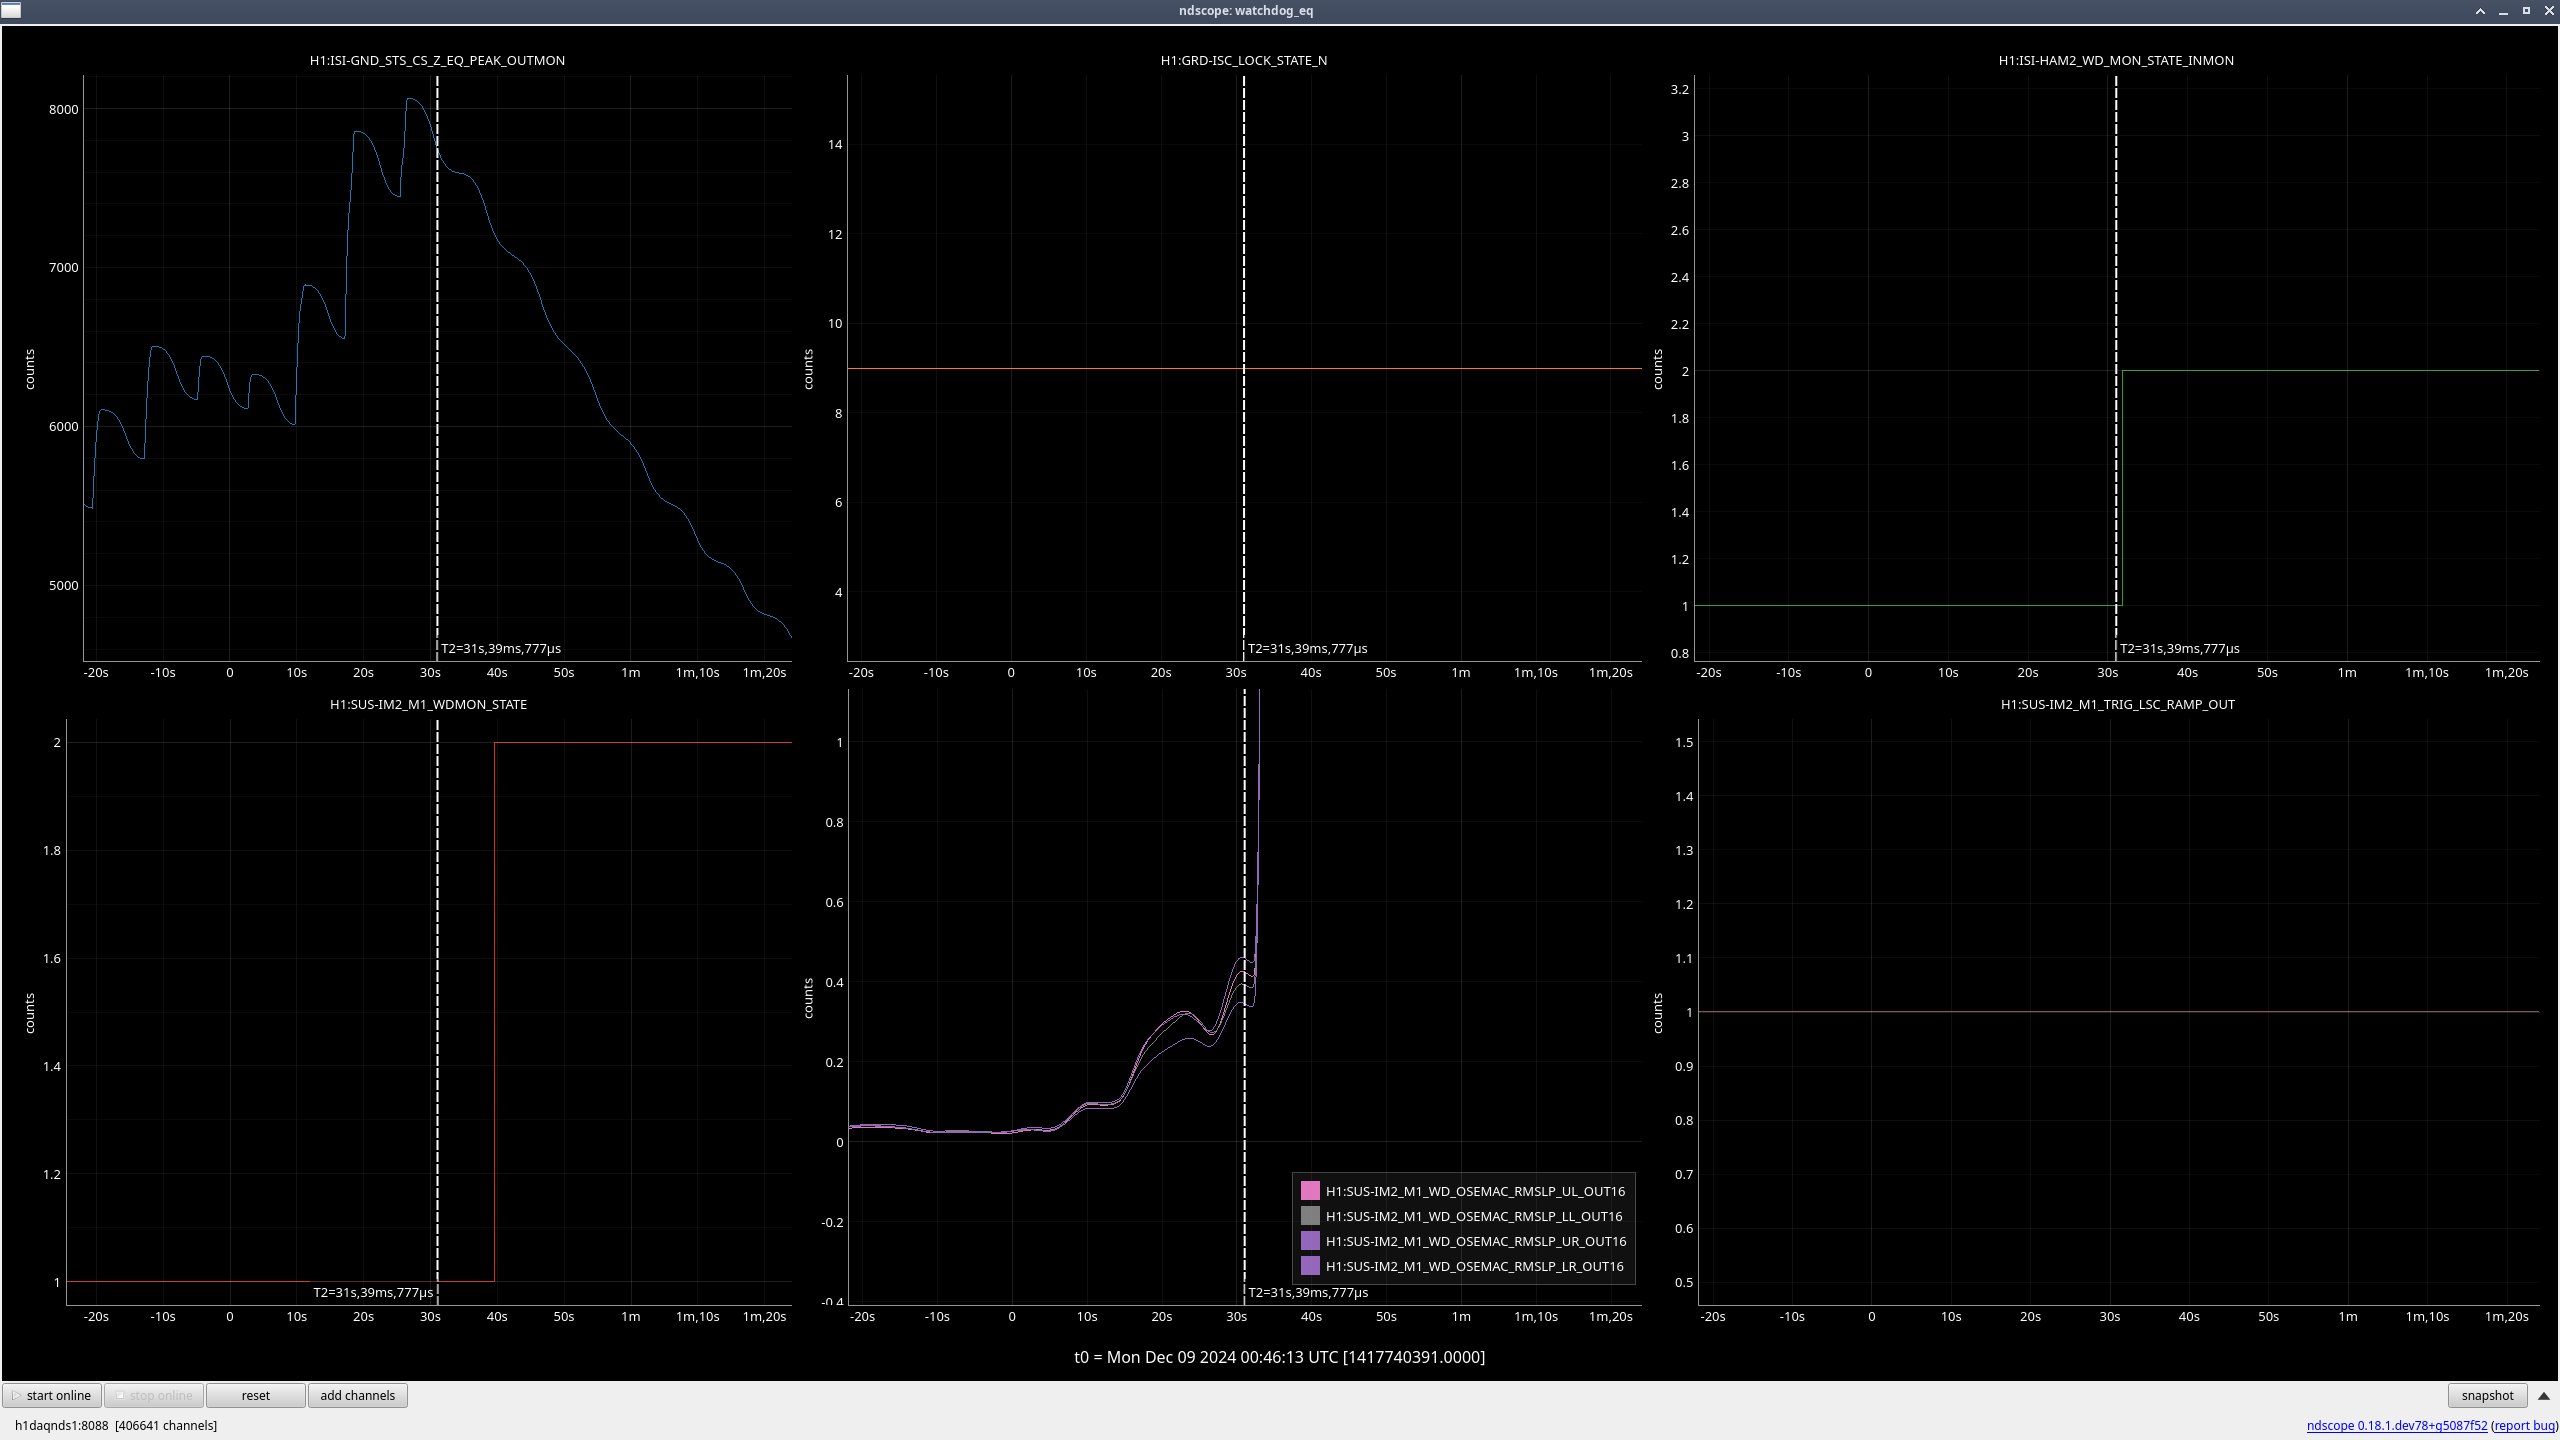
IM1 (M1) (ndscope6)
Again, the OSEMs are moving after the lockloss due to the earthquake, but the rate they were moving at greatly increased once HAM2 saturated and the ISI watchdogs tripped.
| Stage |
Original WD threshold |
Max BLRMS reached after lockloss |
New WD threshold |
| M1 |
150 |
175 |
225 |
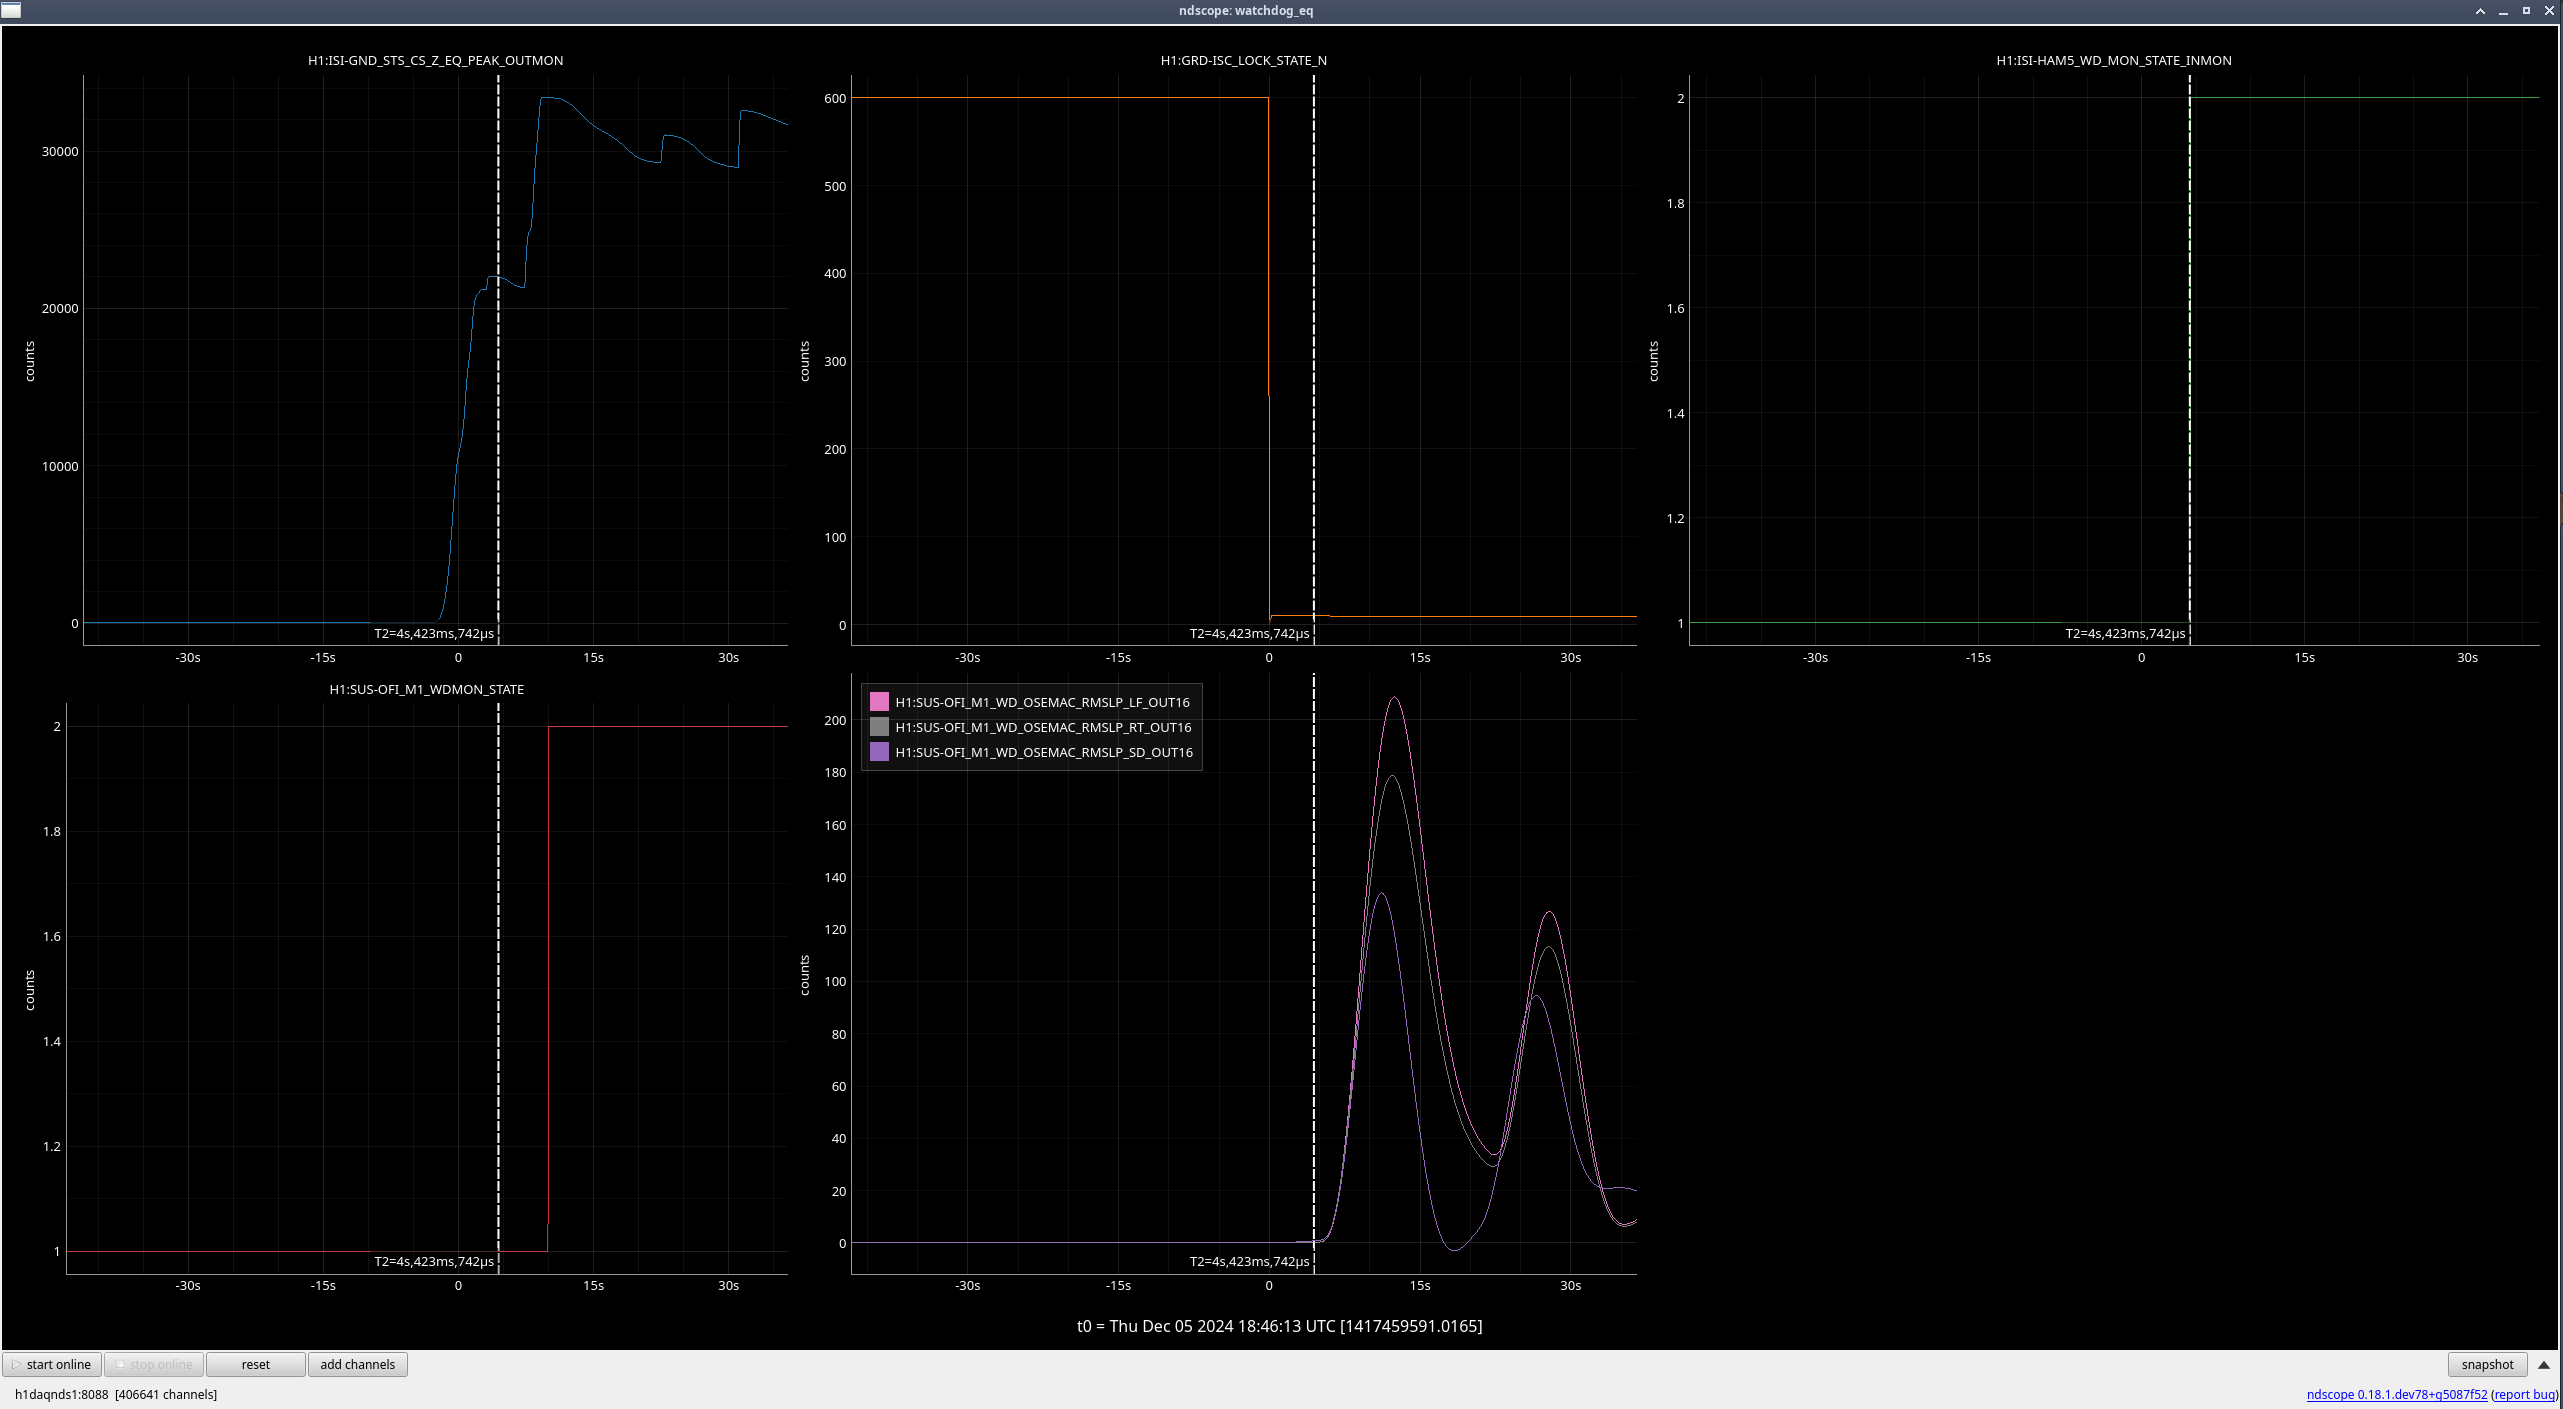
OFI (M1) (ndscope7)
Again, the OSEMs are moving after the lockloss due to the earthquake, but the rate they were moving at greatly increased once HAM5 saturated and the ISI watchdogs tripped.
| Stage |
Original WD threshold |
Max BLRMS reached after lockloss |
New WD threshold |
| M1 |
150 |
209 |
250 |
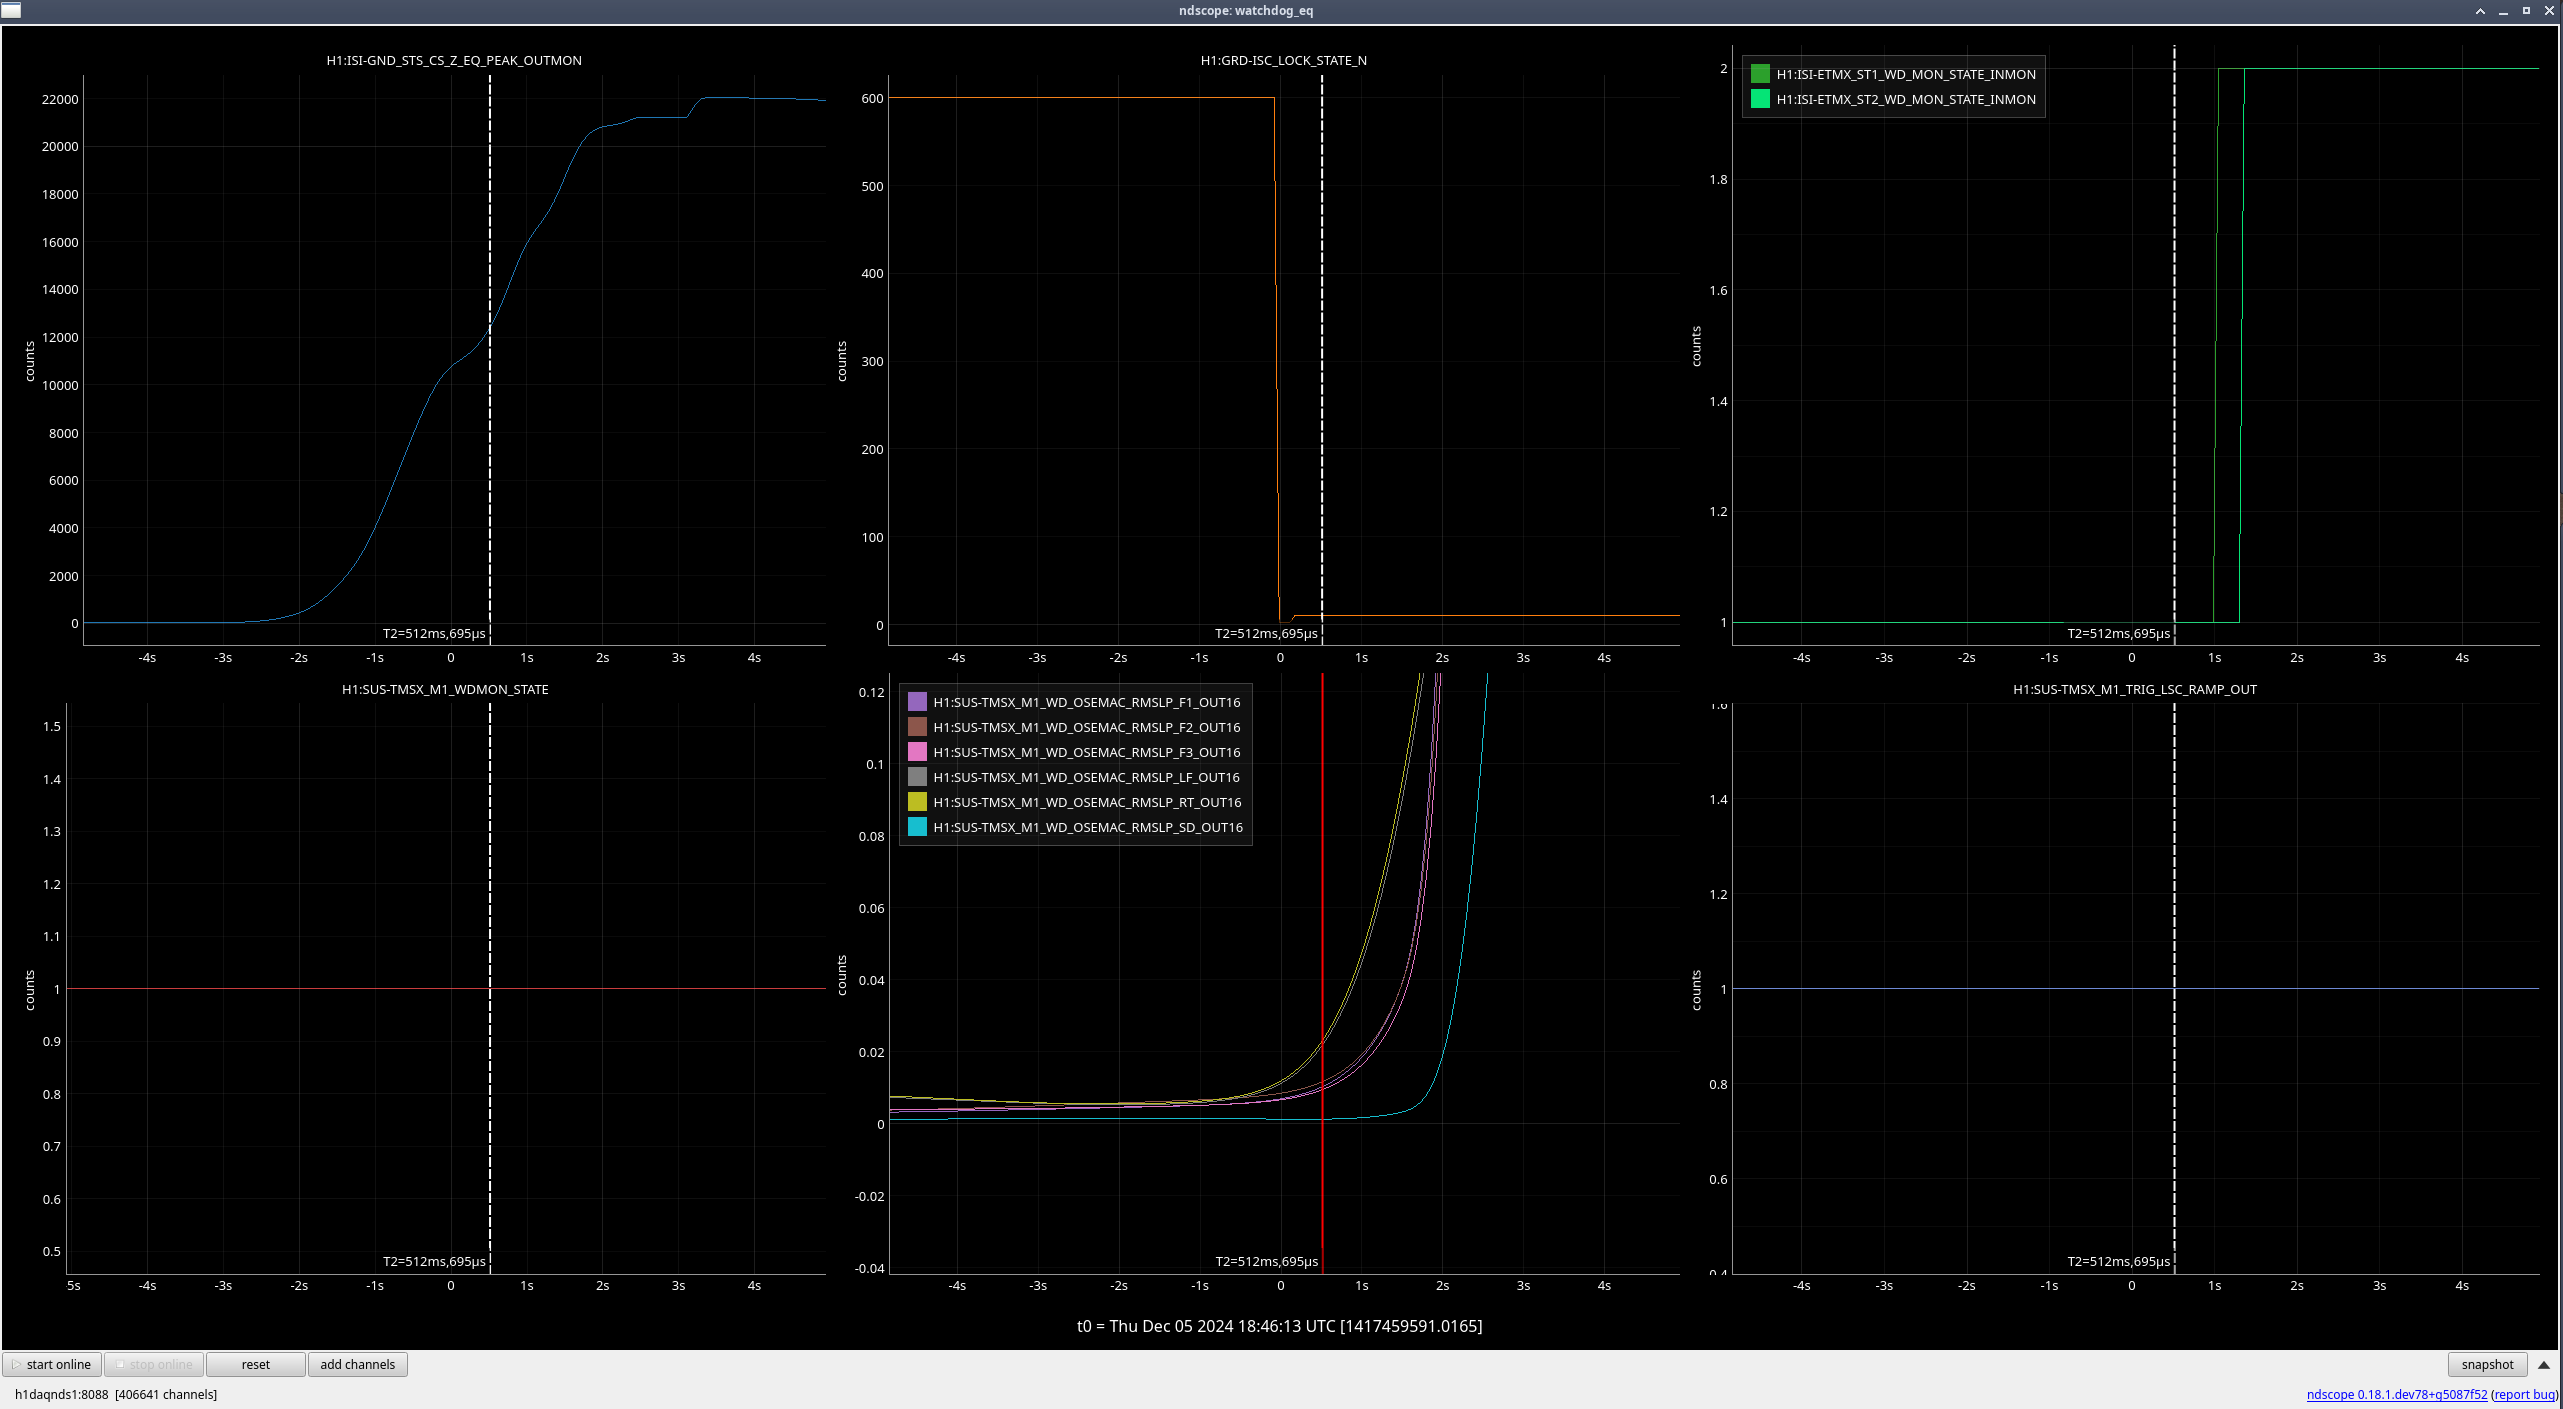
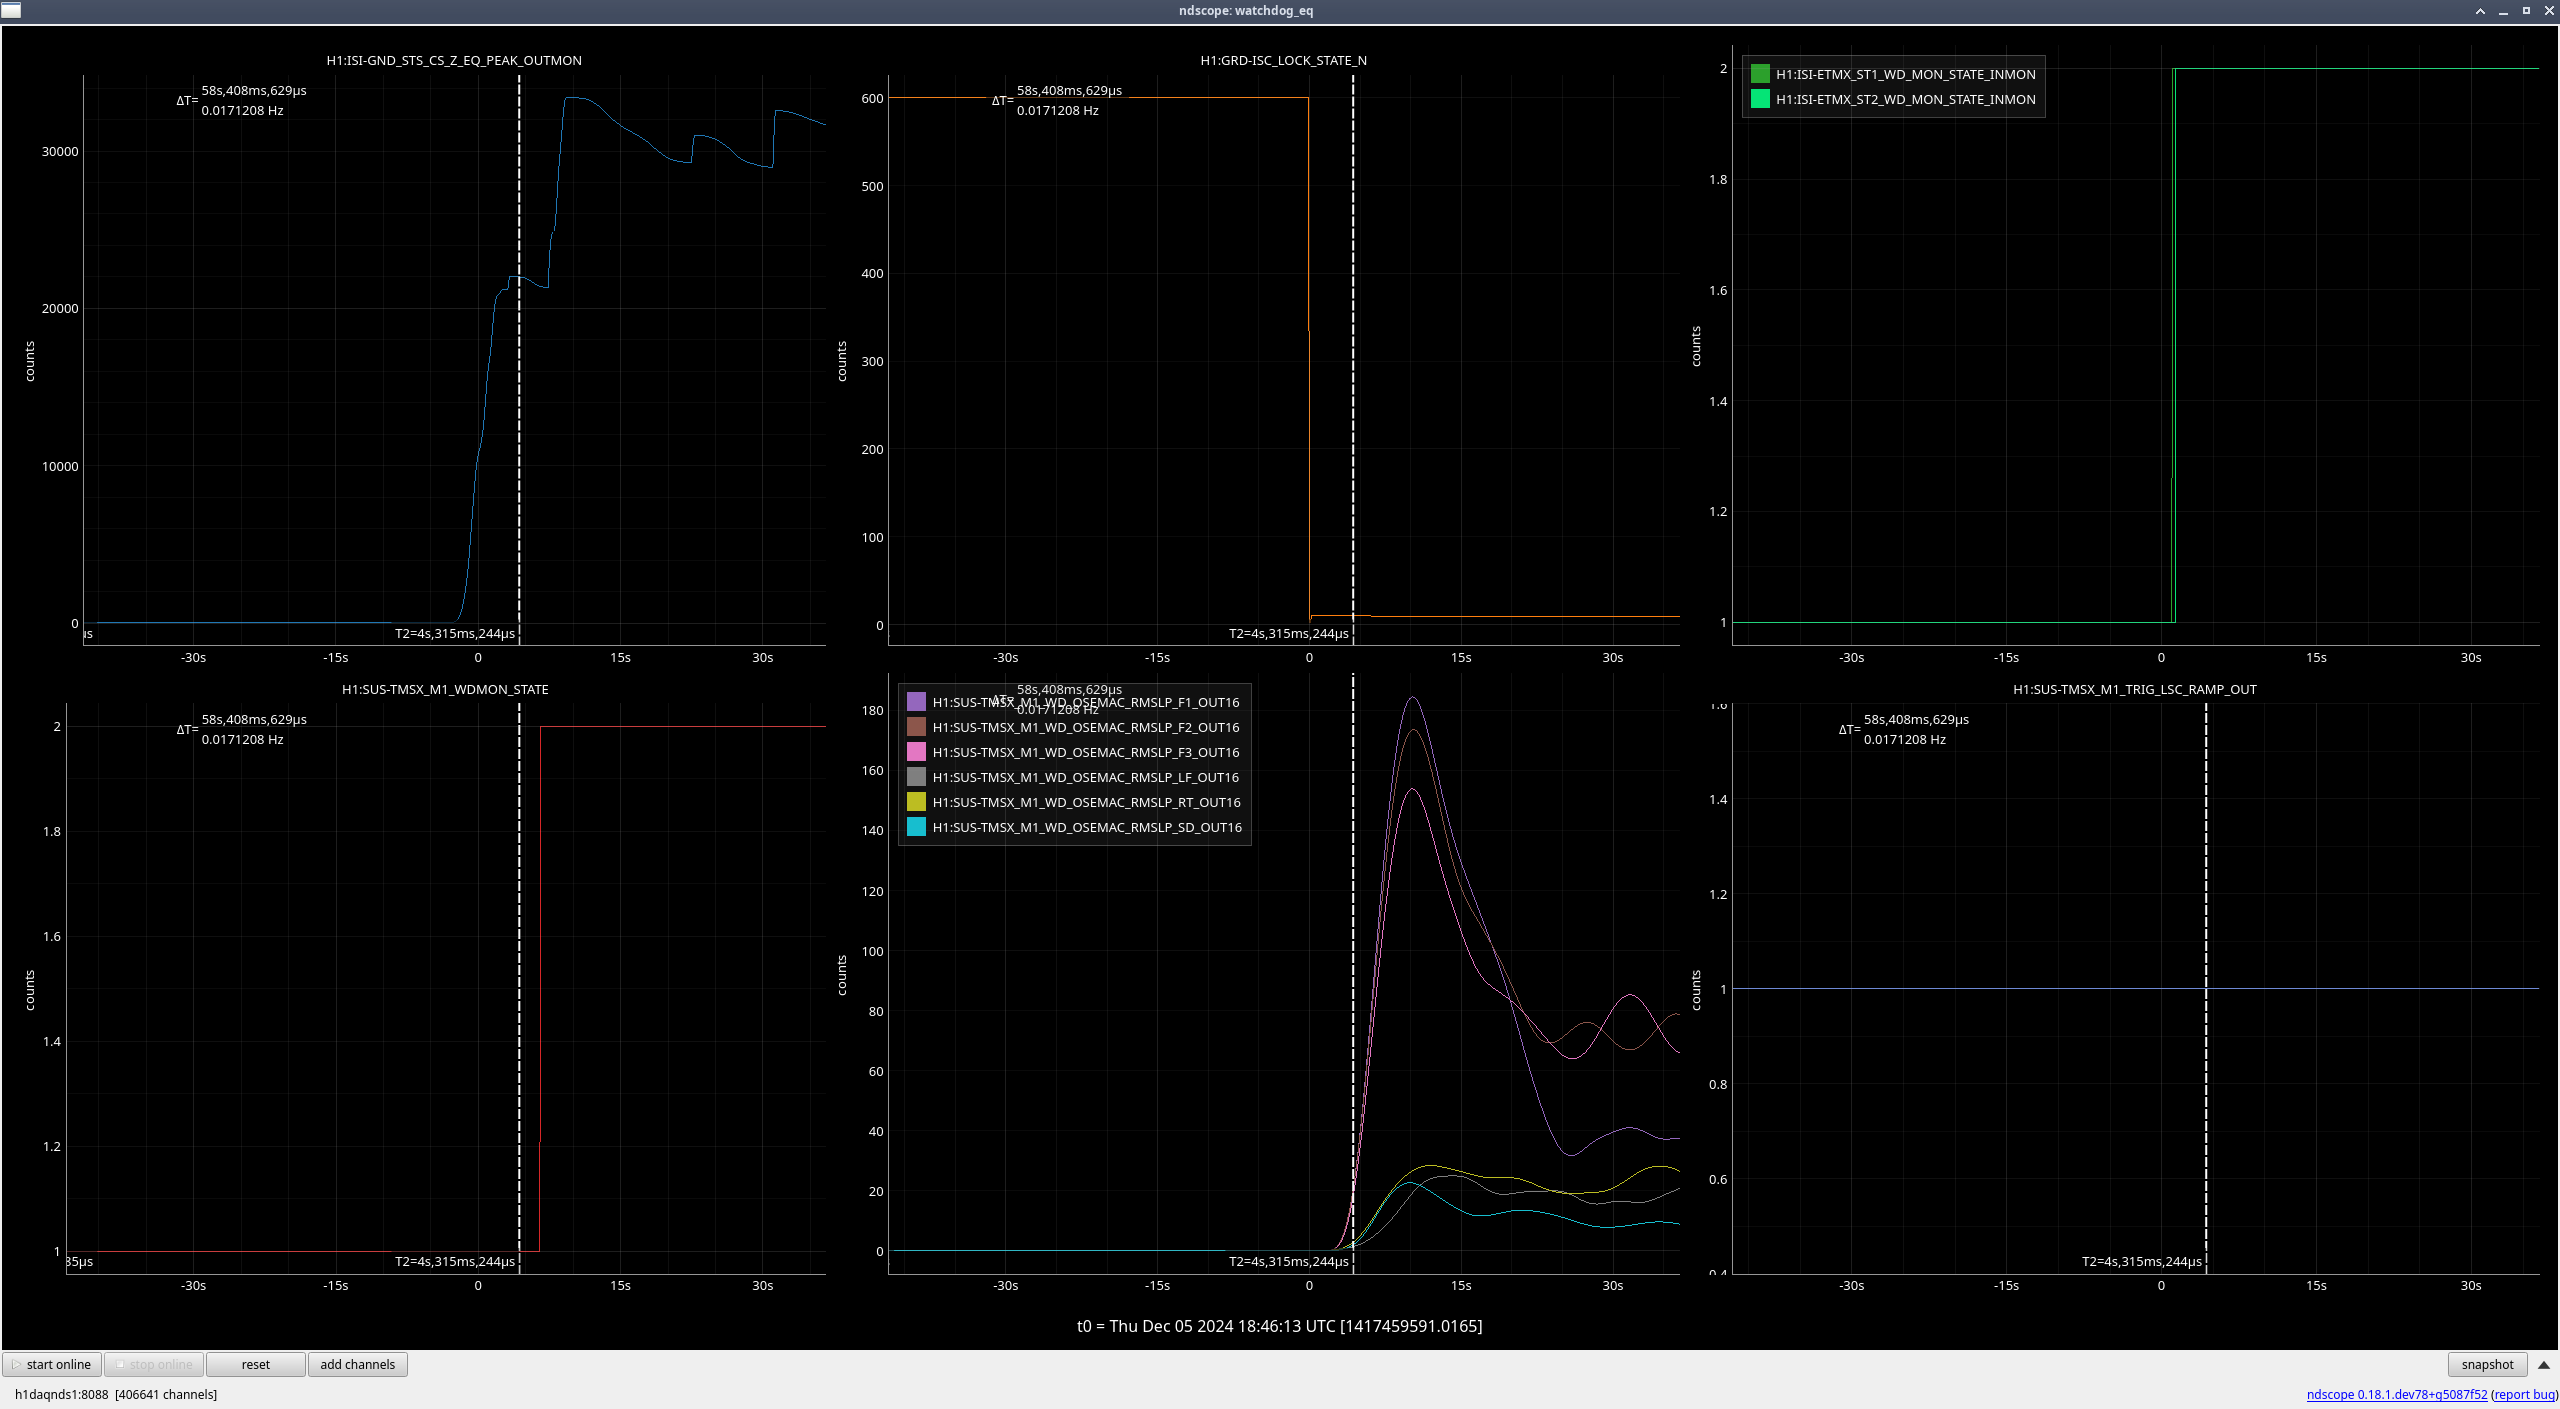
TMSX (M1) (ndscope8)
This one seems a bit questionable - it looks like some of the OSEMs were already moving quite a bit before the ISI tripped, and there isn't as much of a clear place where they started moving more once the ISI had tripped(ndscope9). I will still be raising the suspension trip threshold for this one just because it doesn't need to be raised very much and is within a reasonable range.
| Stage |
Original WD threshold |
Max BLRMS reached after lockloss |
New WD threshold |
| M1 |
100 |
185 |
225 |


