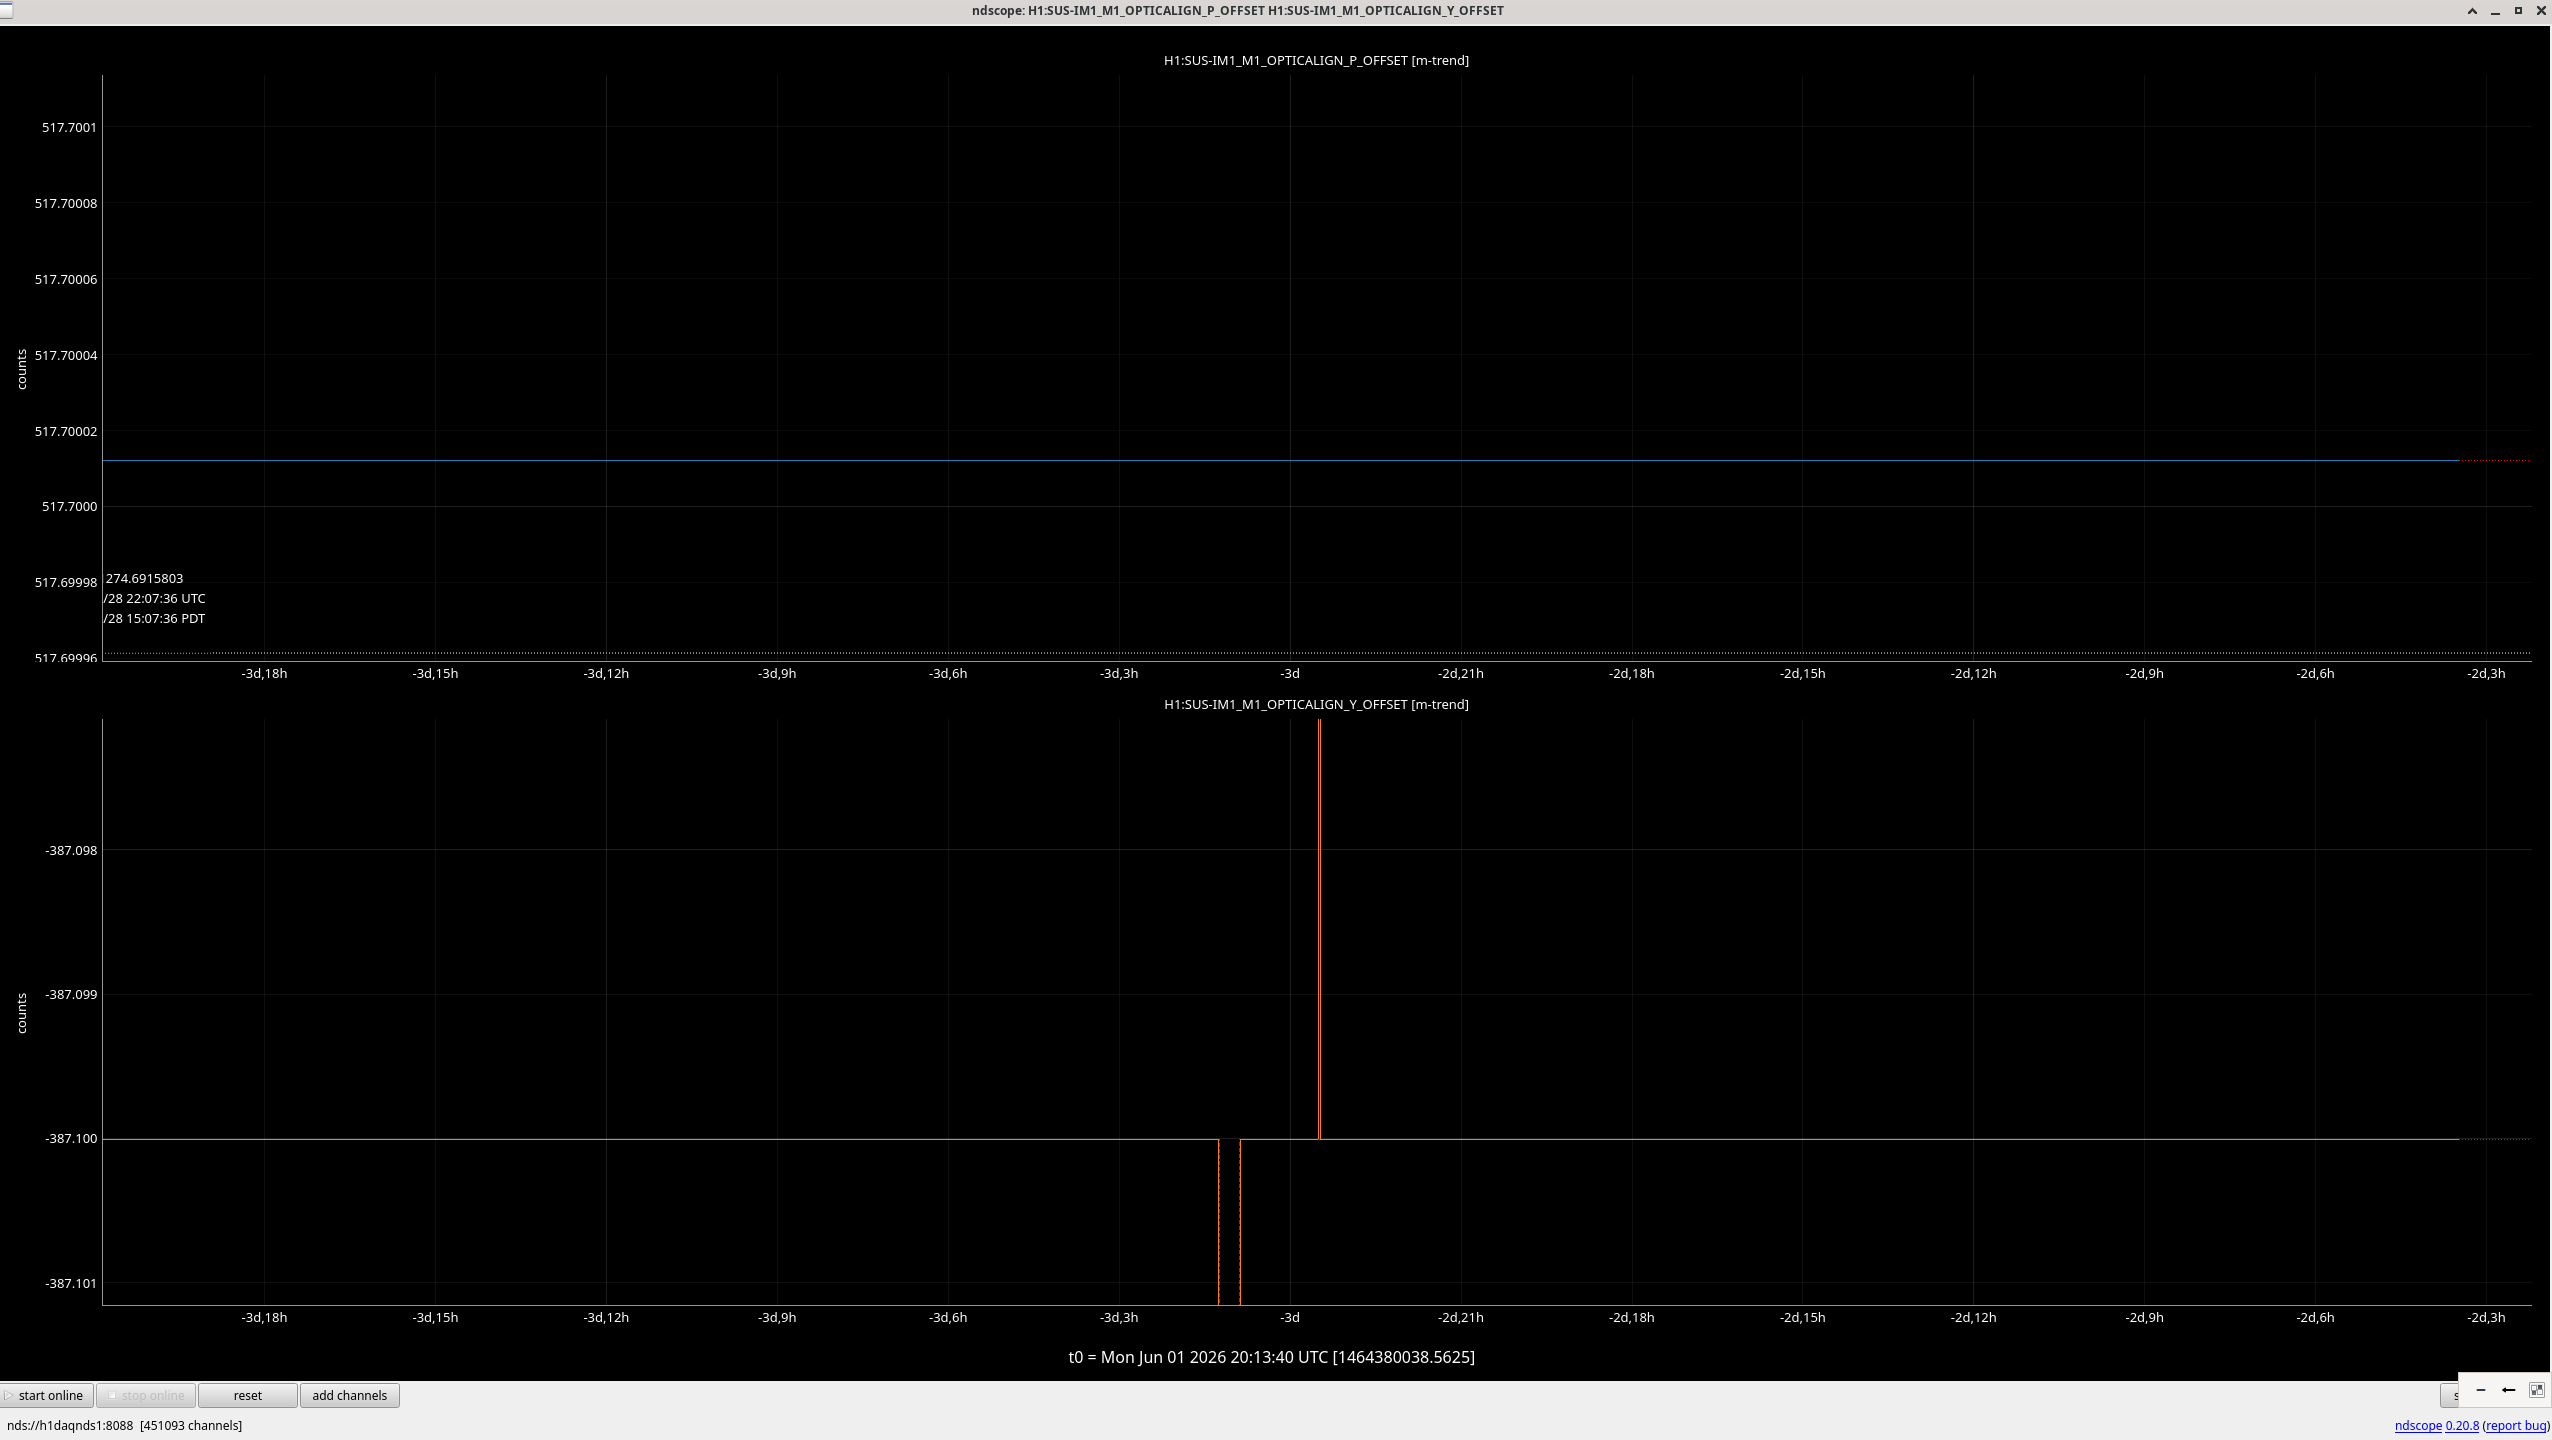
After JAC was recovered (alog 90421) we moved IM4 by negative 500urad YAW (from -387.1urad to -887.1urad) and adjusted PRM so that it retroreflects (without bothering to adjust IM2, 3 and 4 in the interest of time) and Jenne started centering the REFL A and B using RMs.
However, RM2 still railed.
Turns out that the accuracy of retroreflection matters because 100urad rotation of PRM causes the equivalent of 280urad rotation of IM1 as far as the beam angle leaving RH9 (IFO REFL pickoff) is concerned.
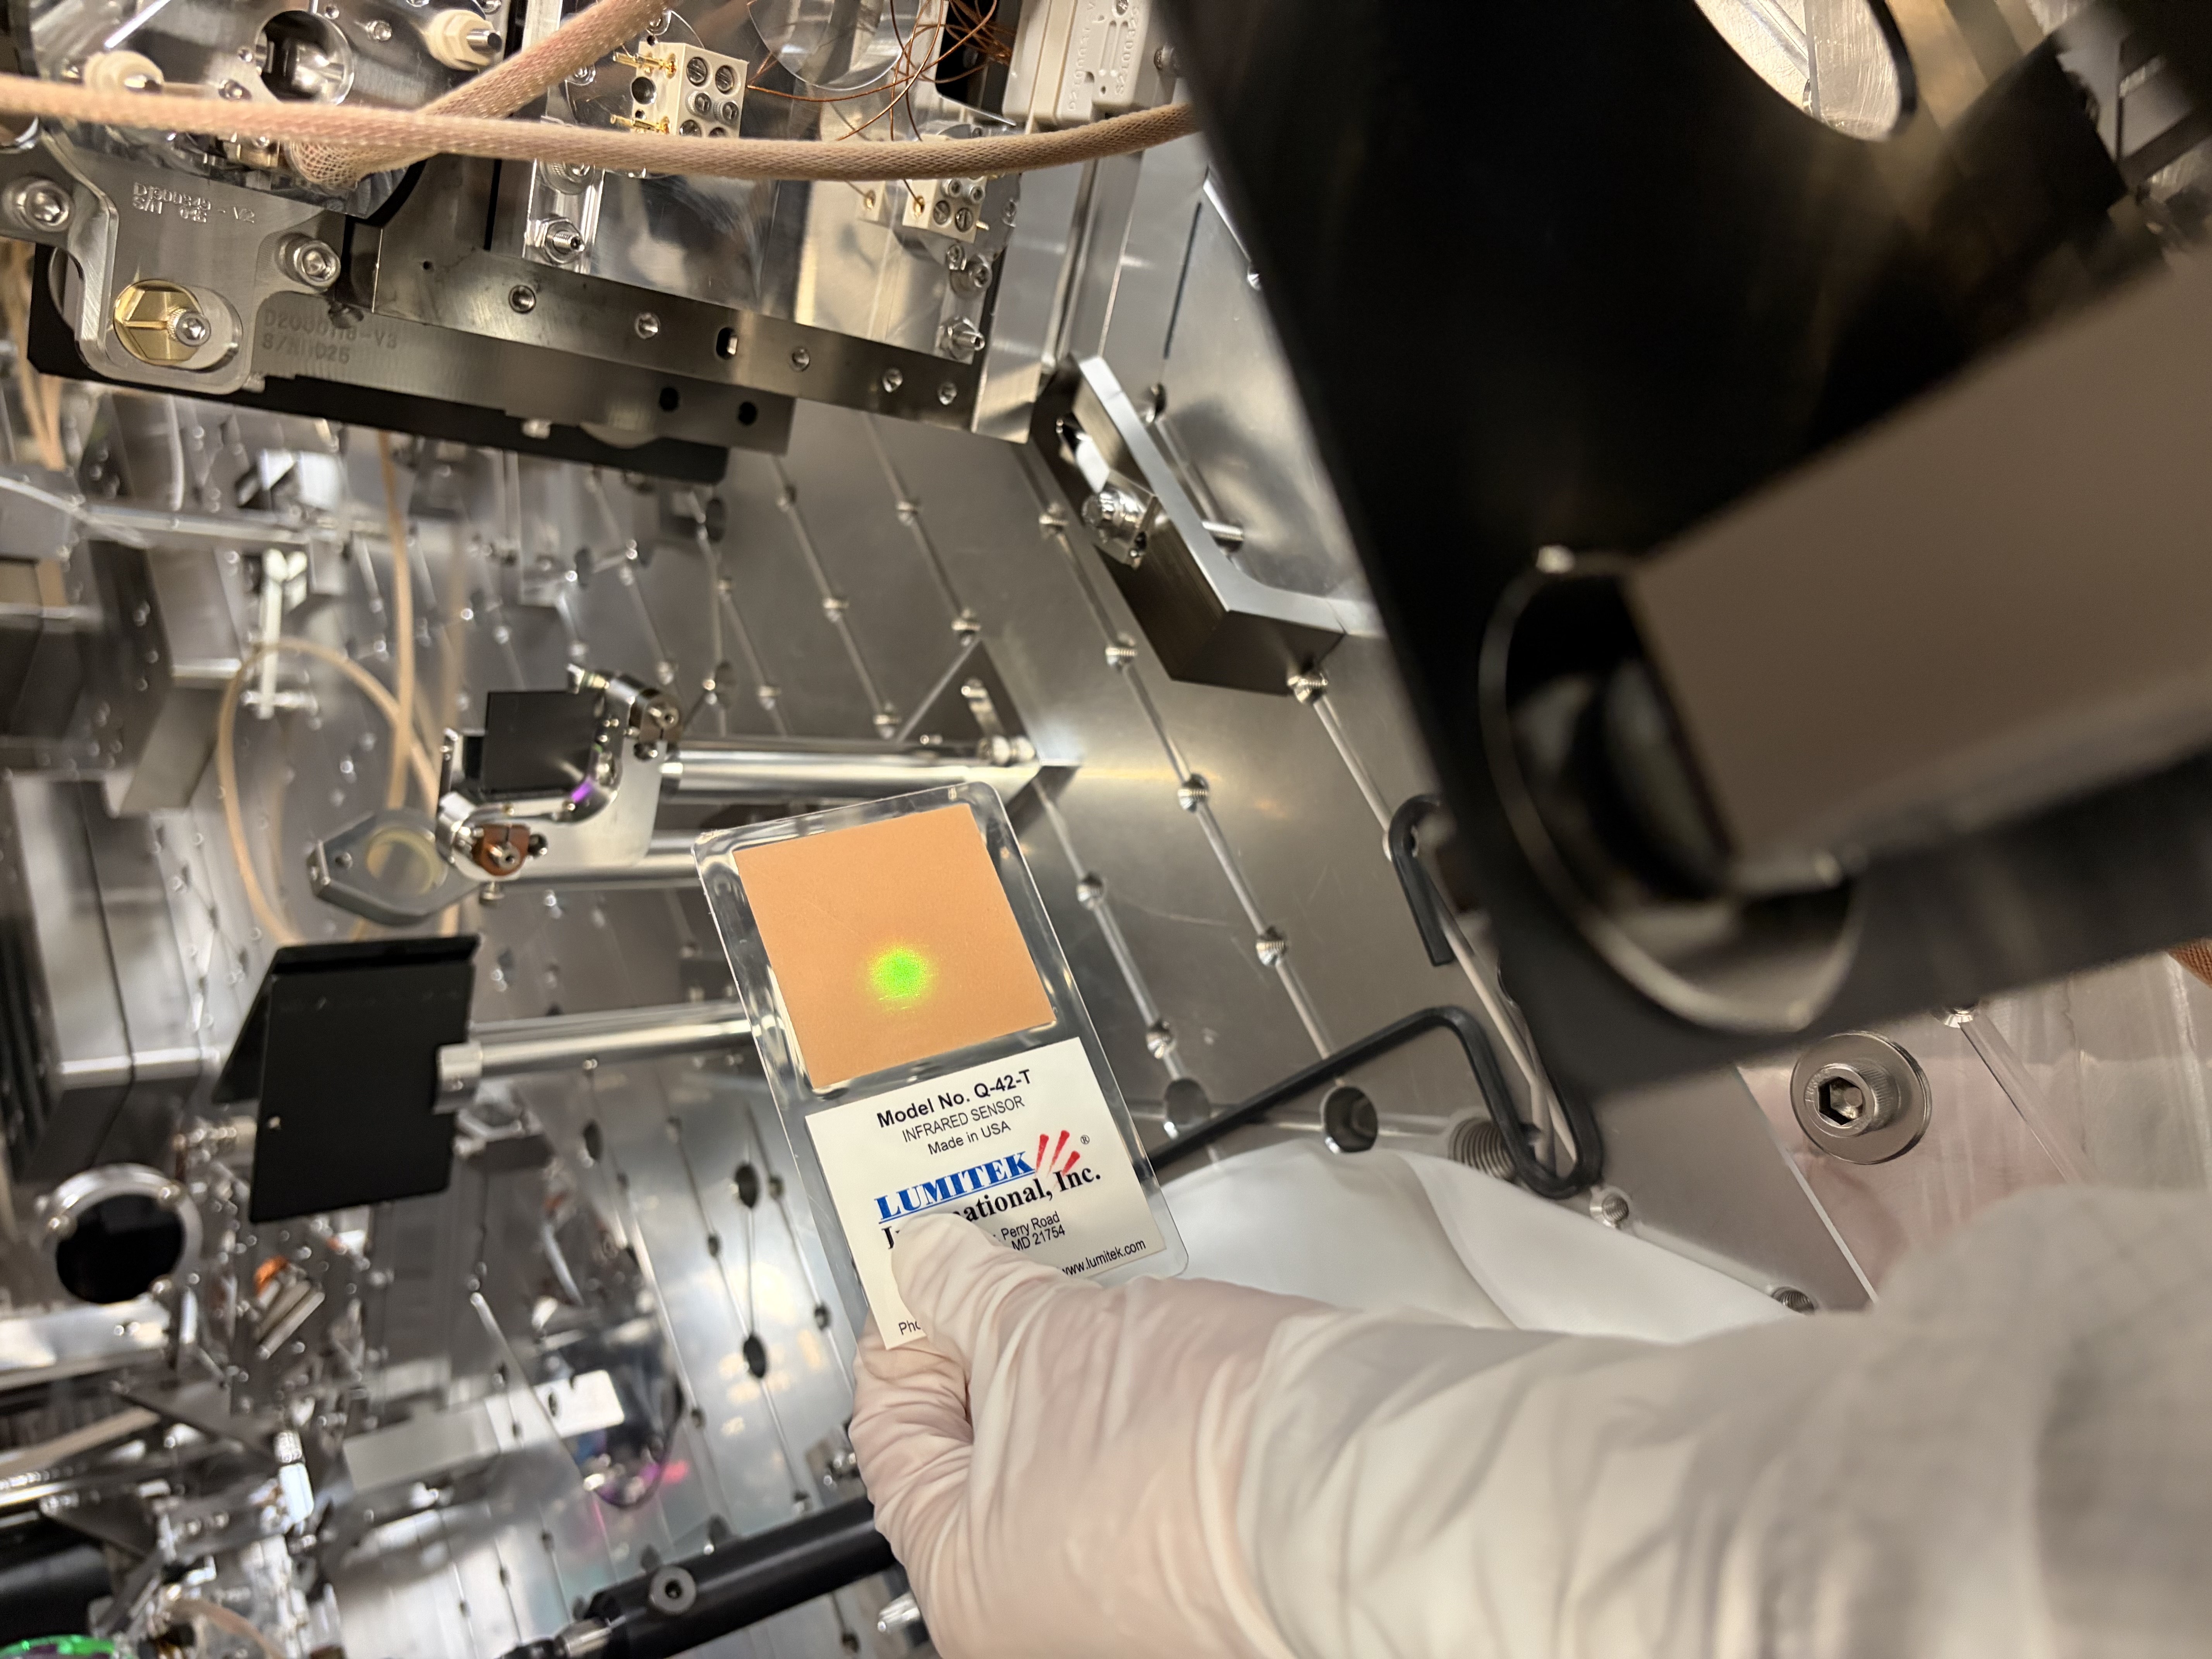
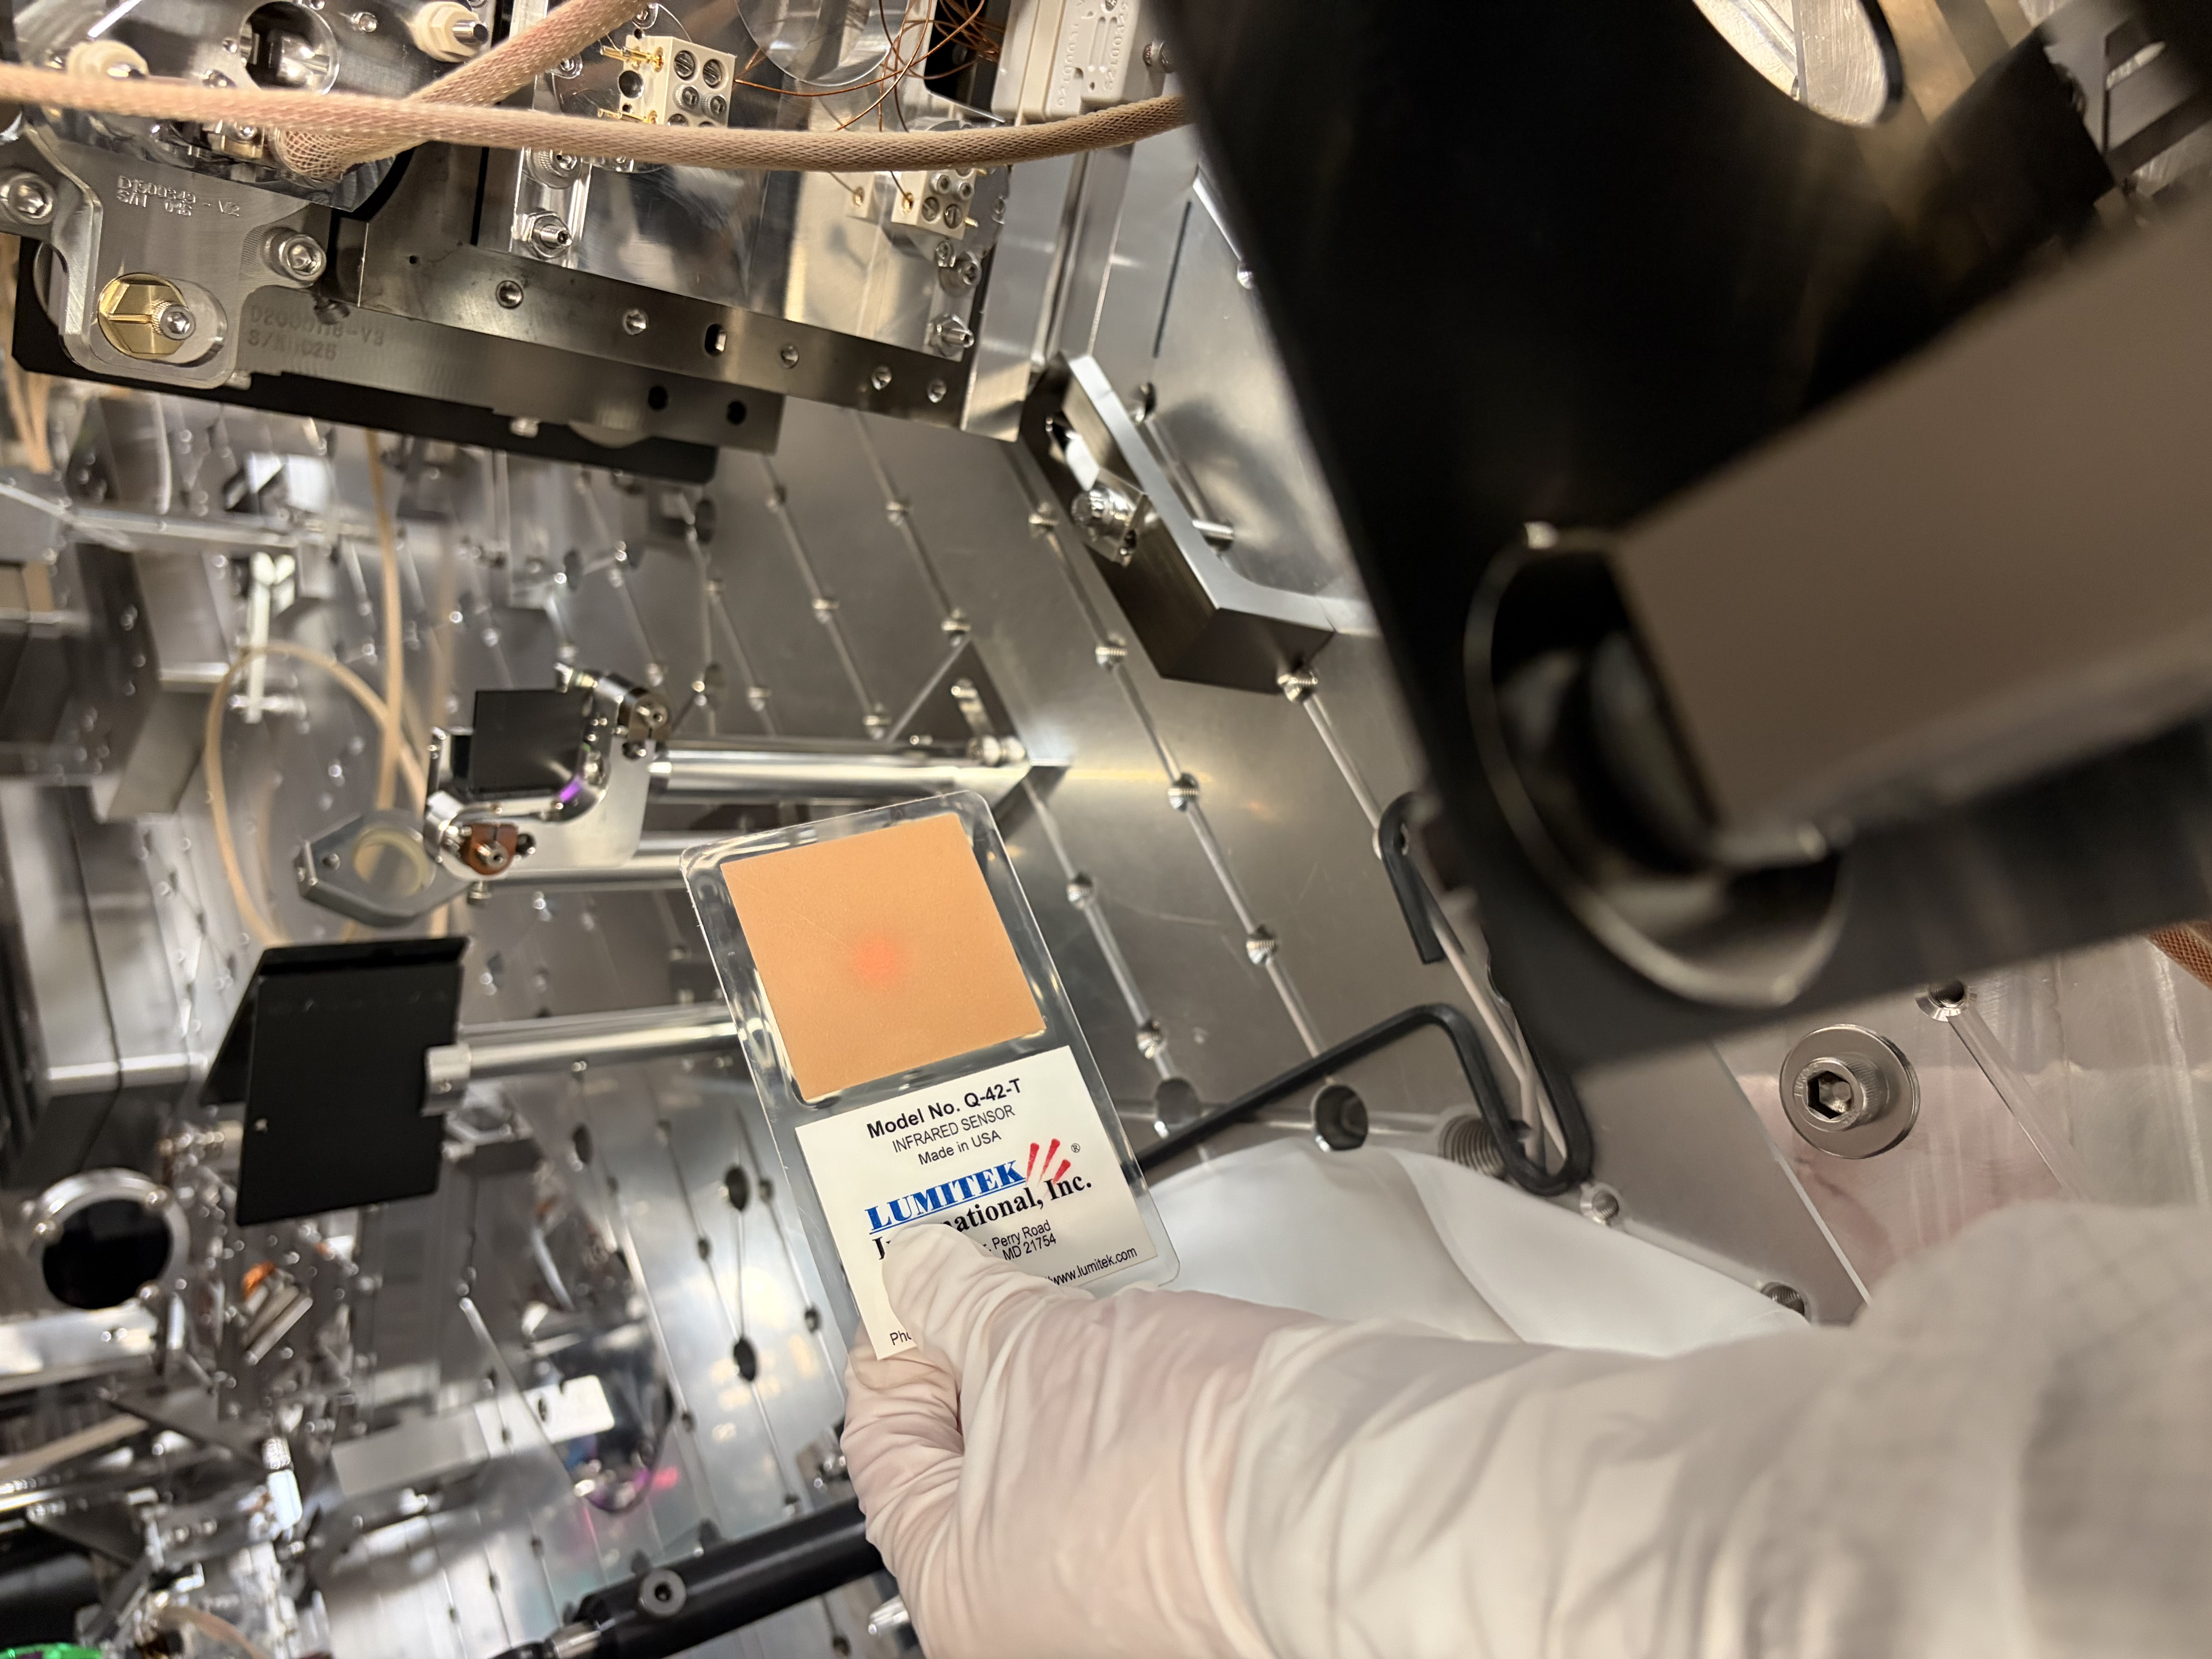
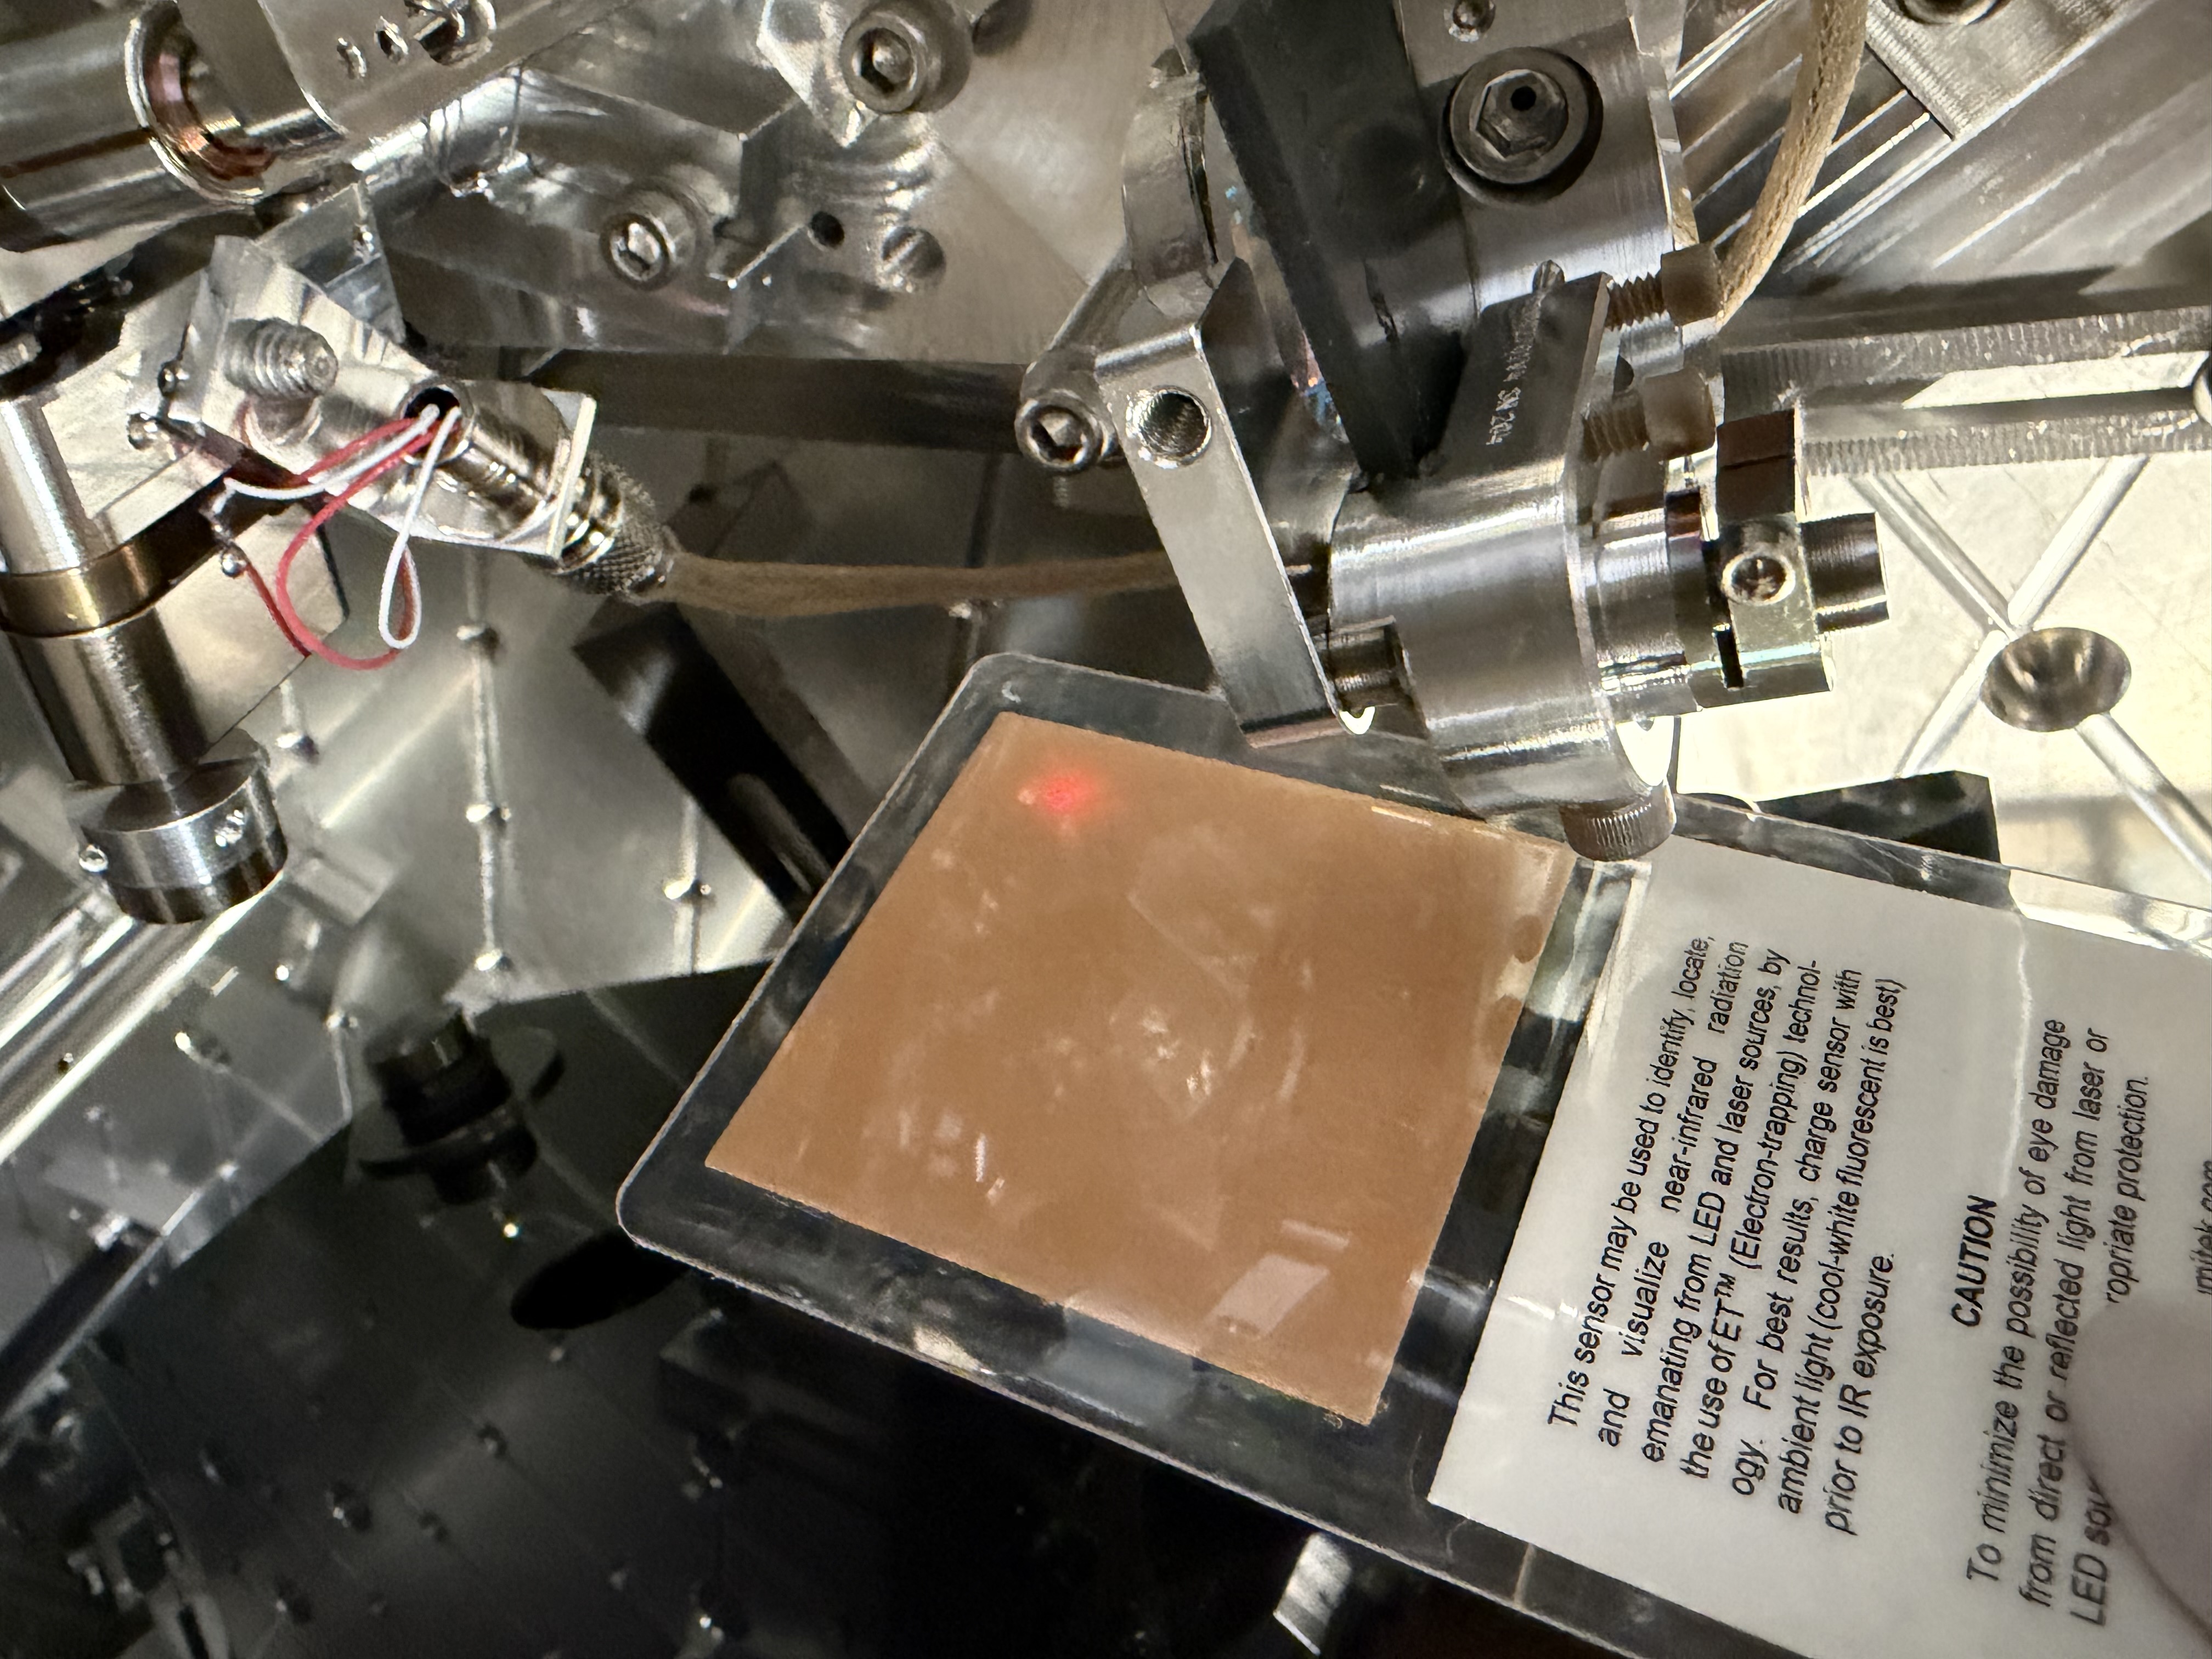
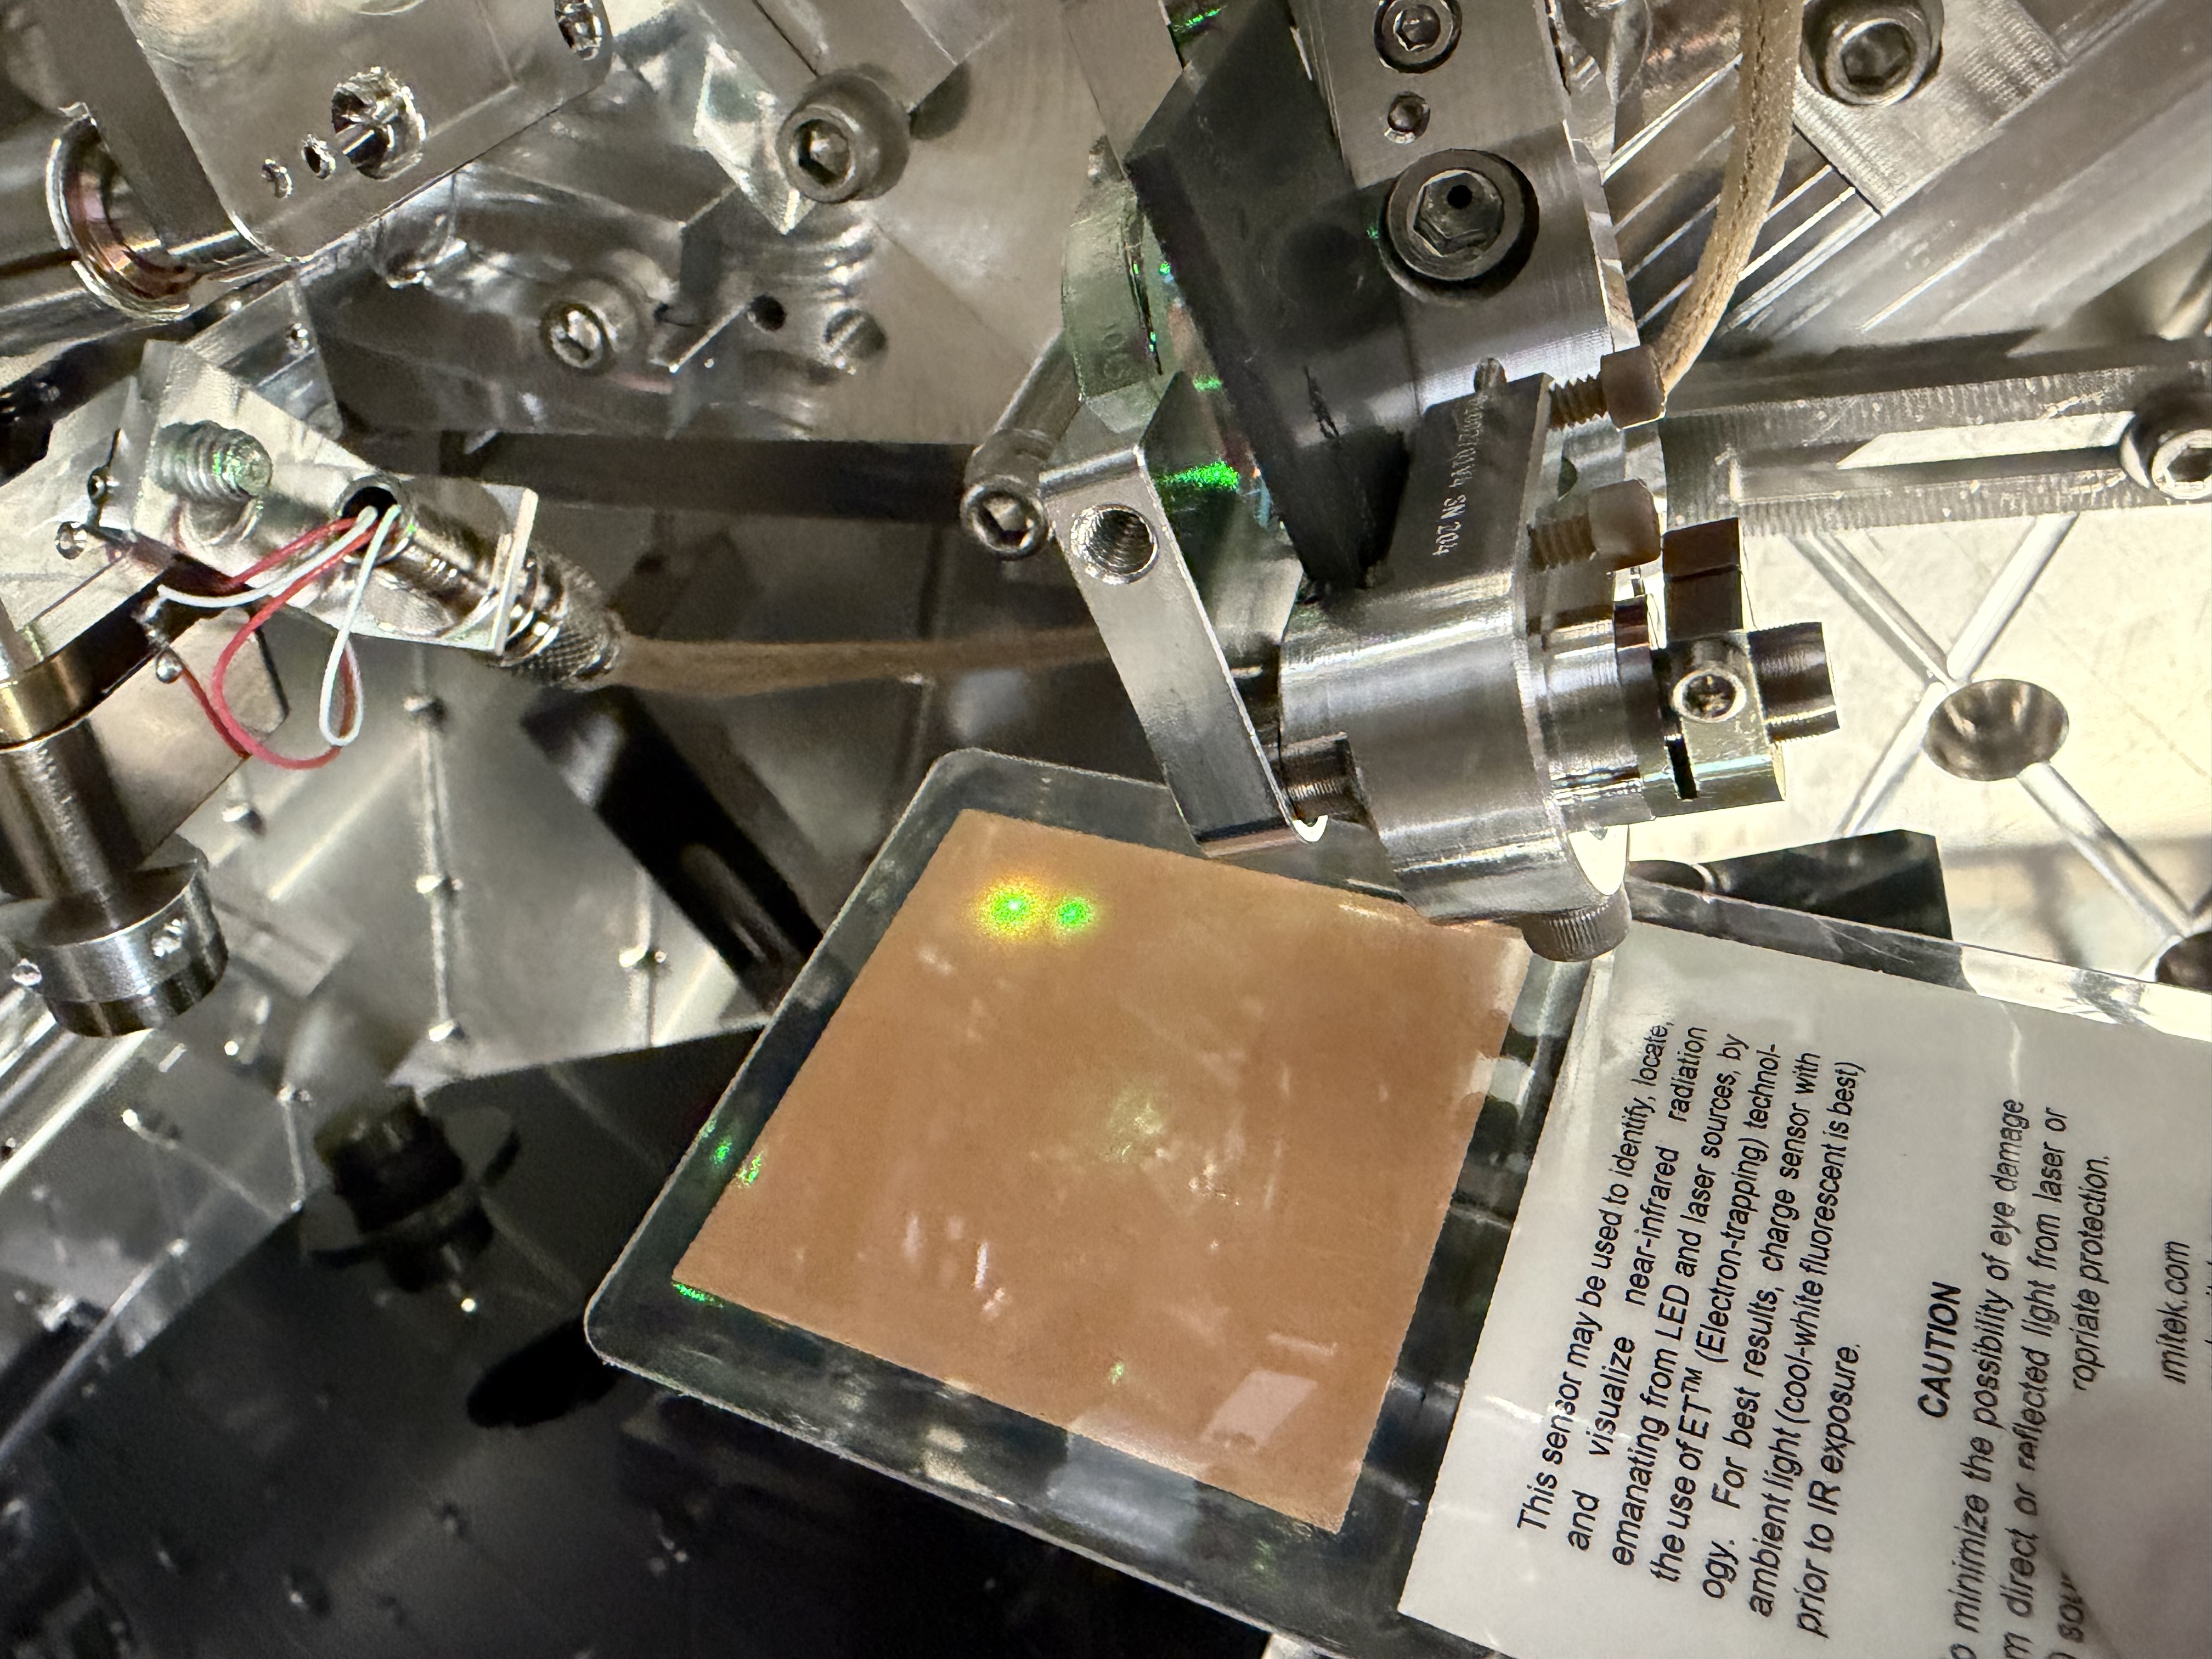
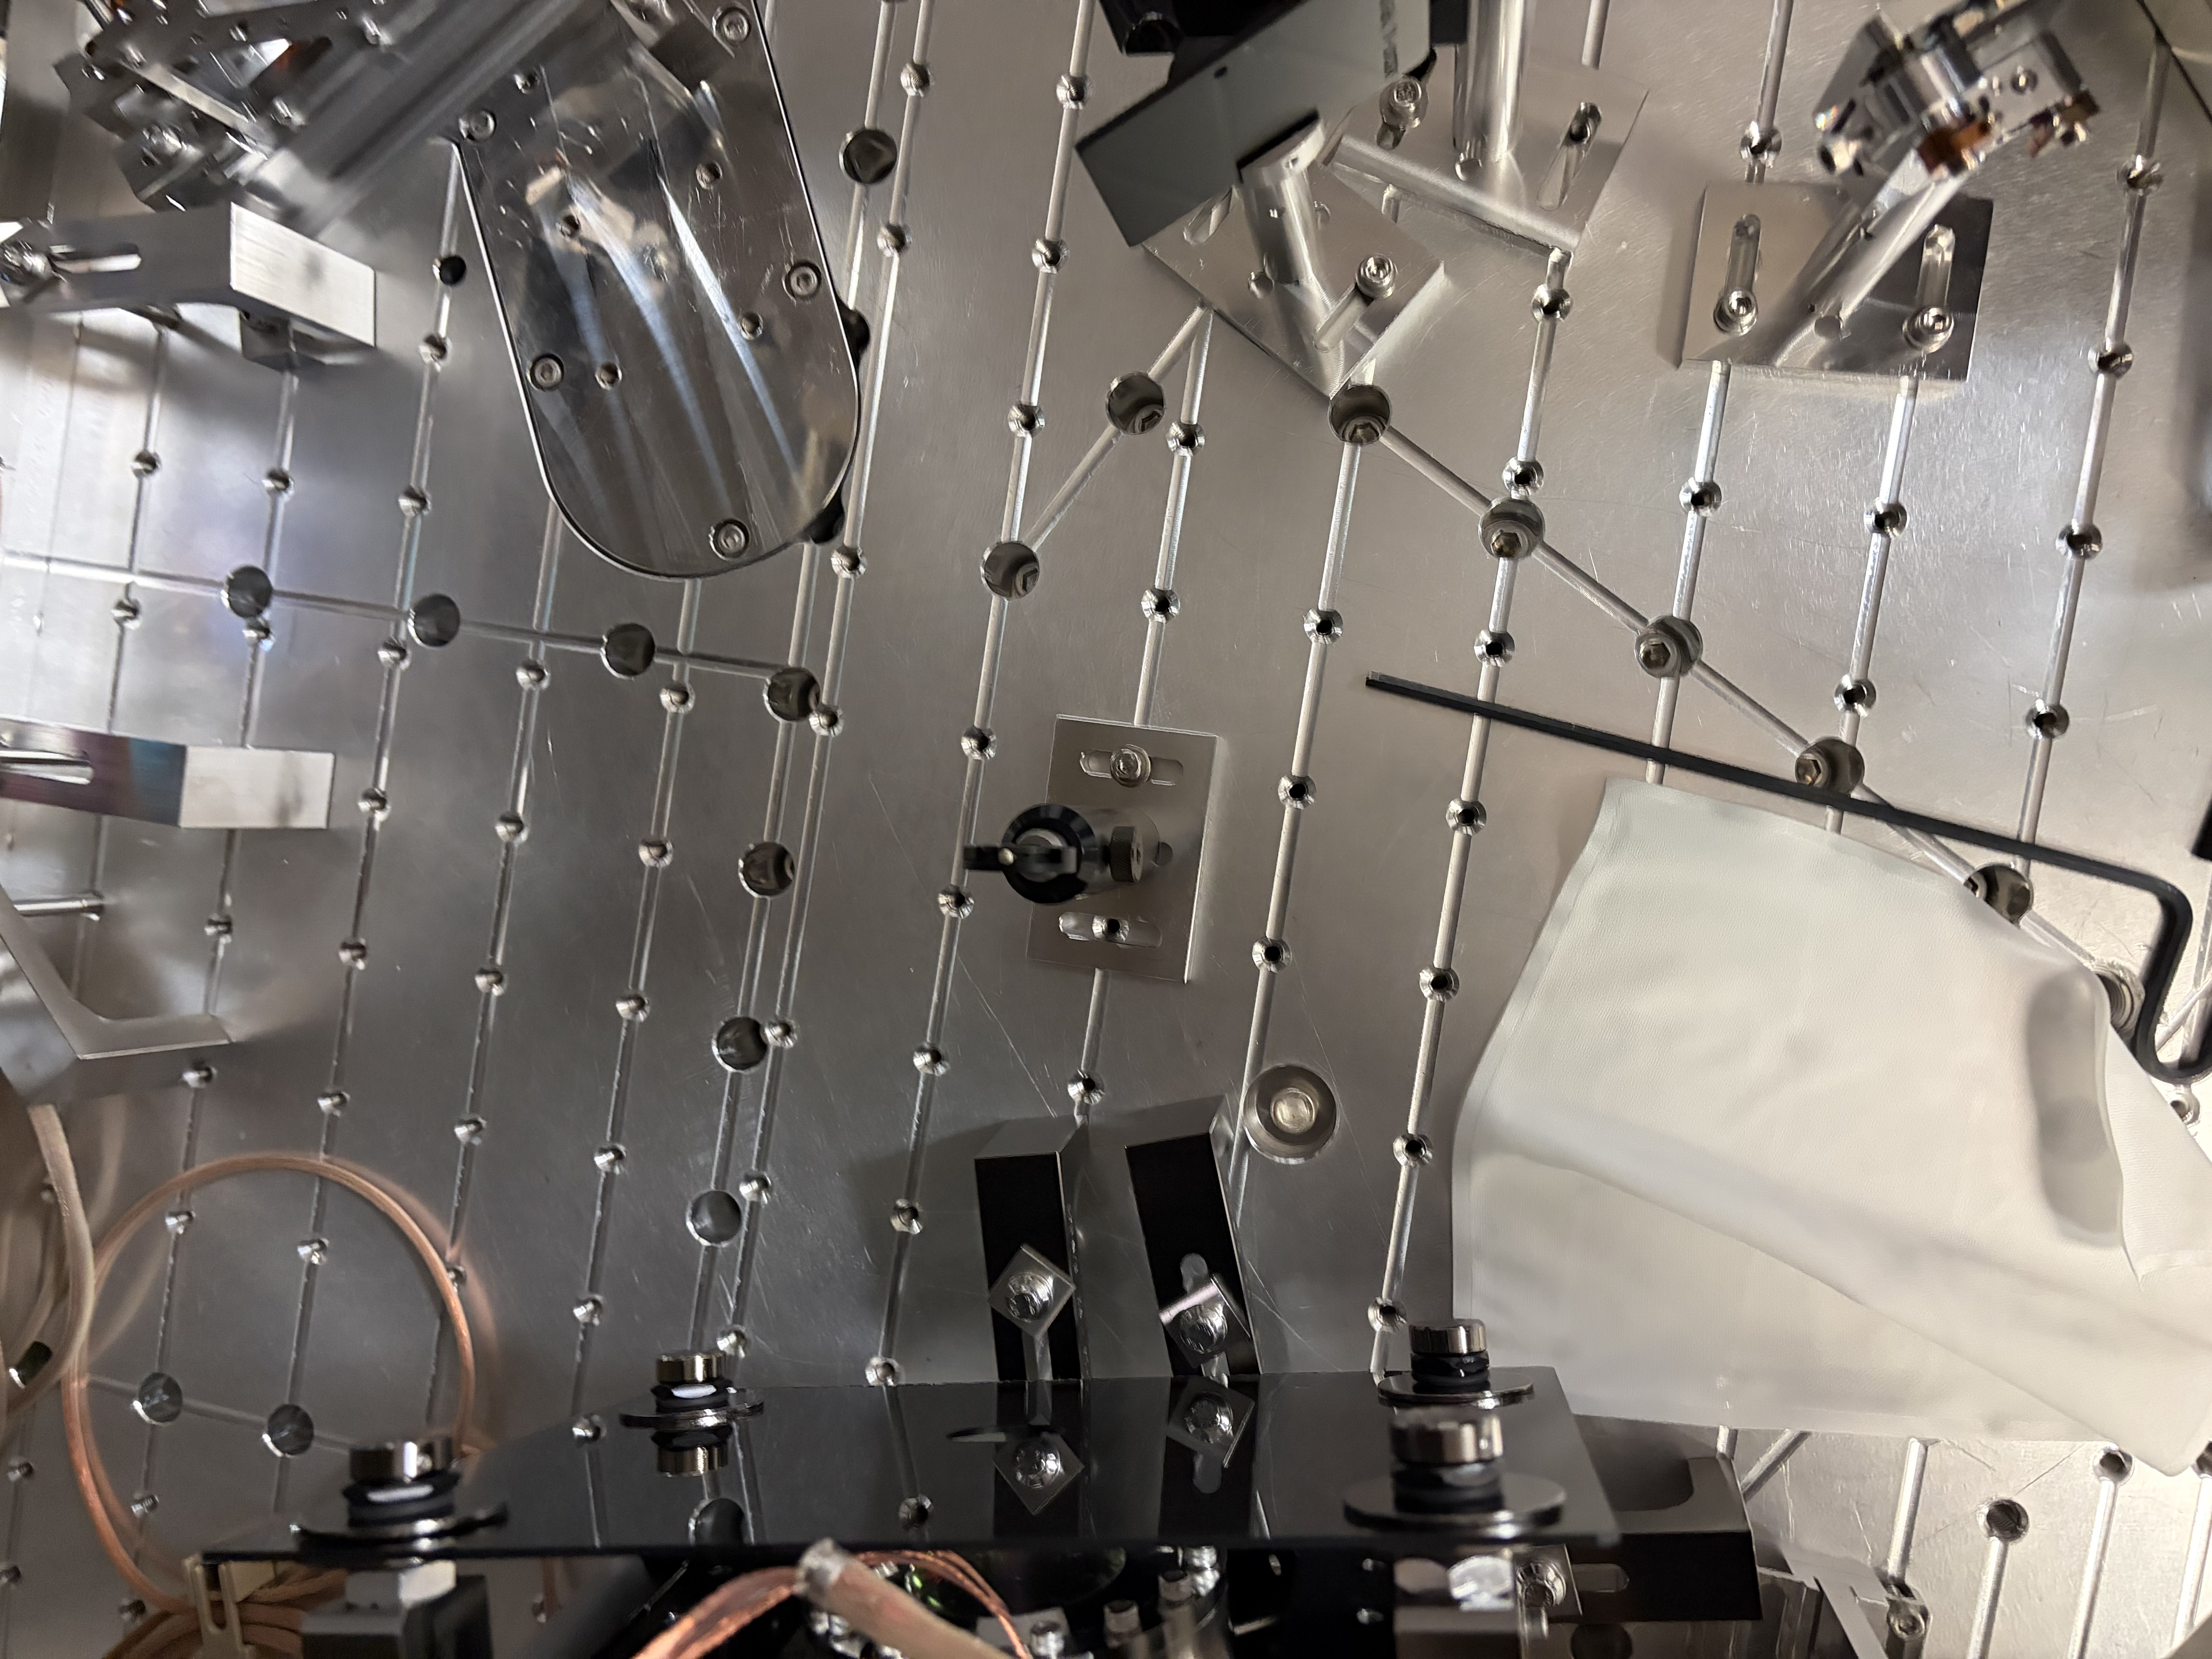
The retroreflection technique was nothing sophisticated, we used an IR card with a hole, put the card between the IFI output baffle and DKDP baffle, put the forward going beam in the hole in the card so it goes through. Rahul would make a huge (like 1.5mrad) YAW rotation for PRM, first positive YAW to find the reflected beam on one side of the hole in the card, and then negative YAW to find it in the other side of the hole, and find a good PRM YAW offset where the reflected beam for +1.5mrad positive and negative offsets are balanced on the card. The retroreflection accuracy is no better than +-500urad.
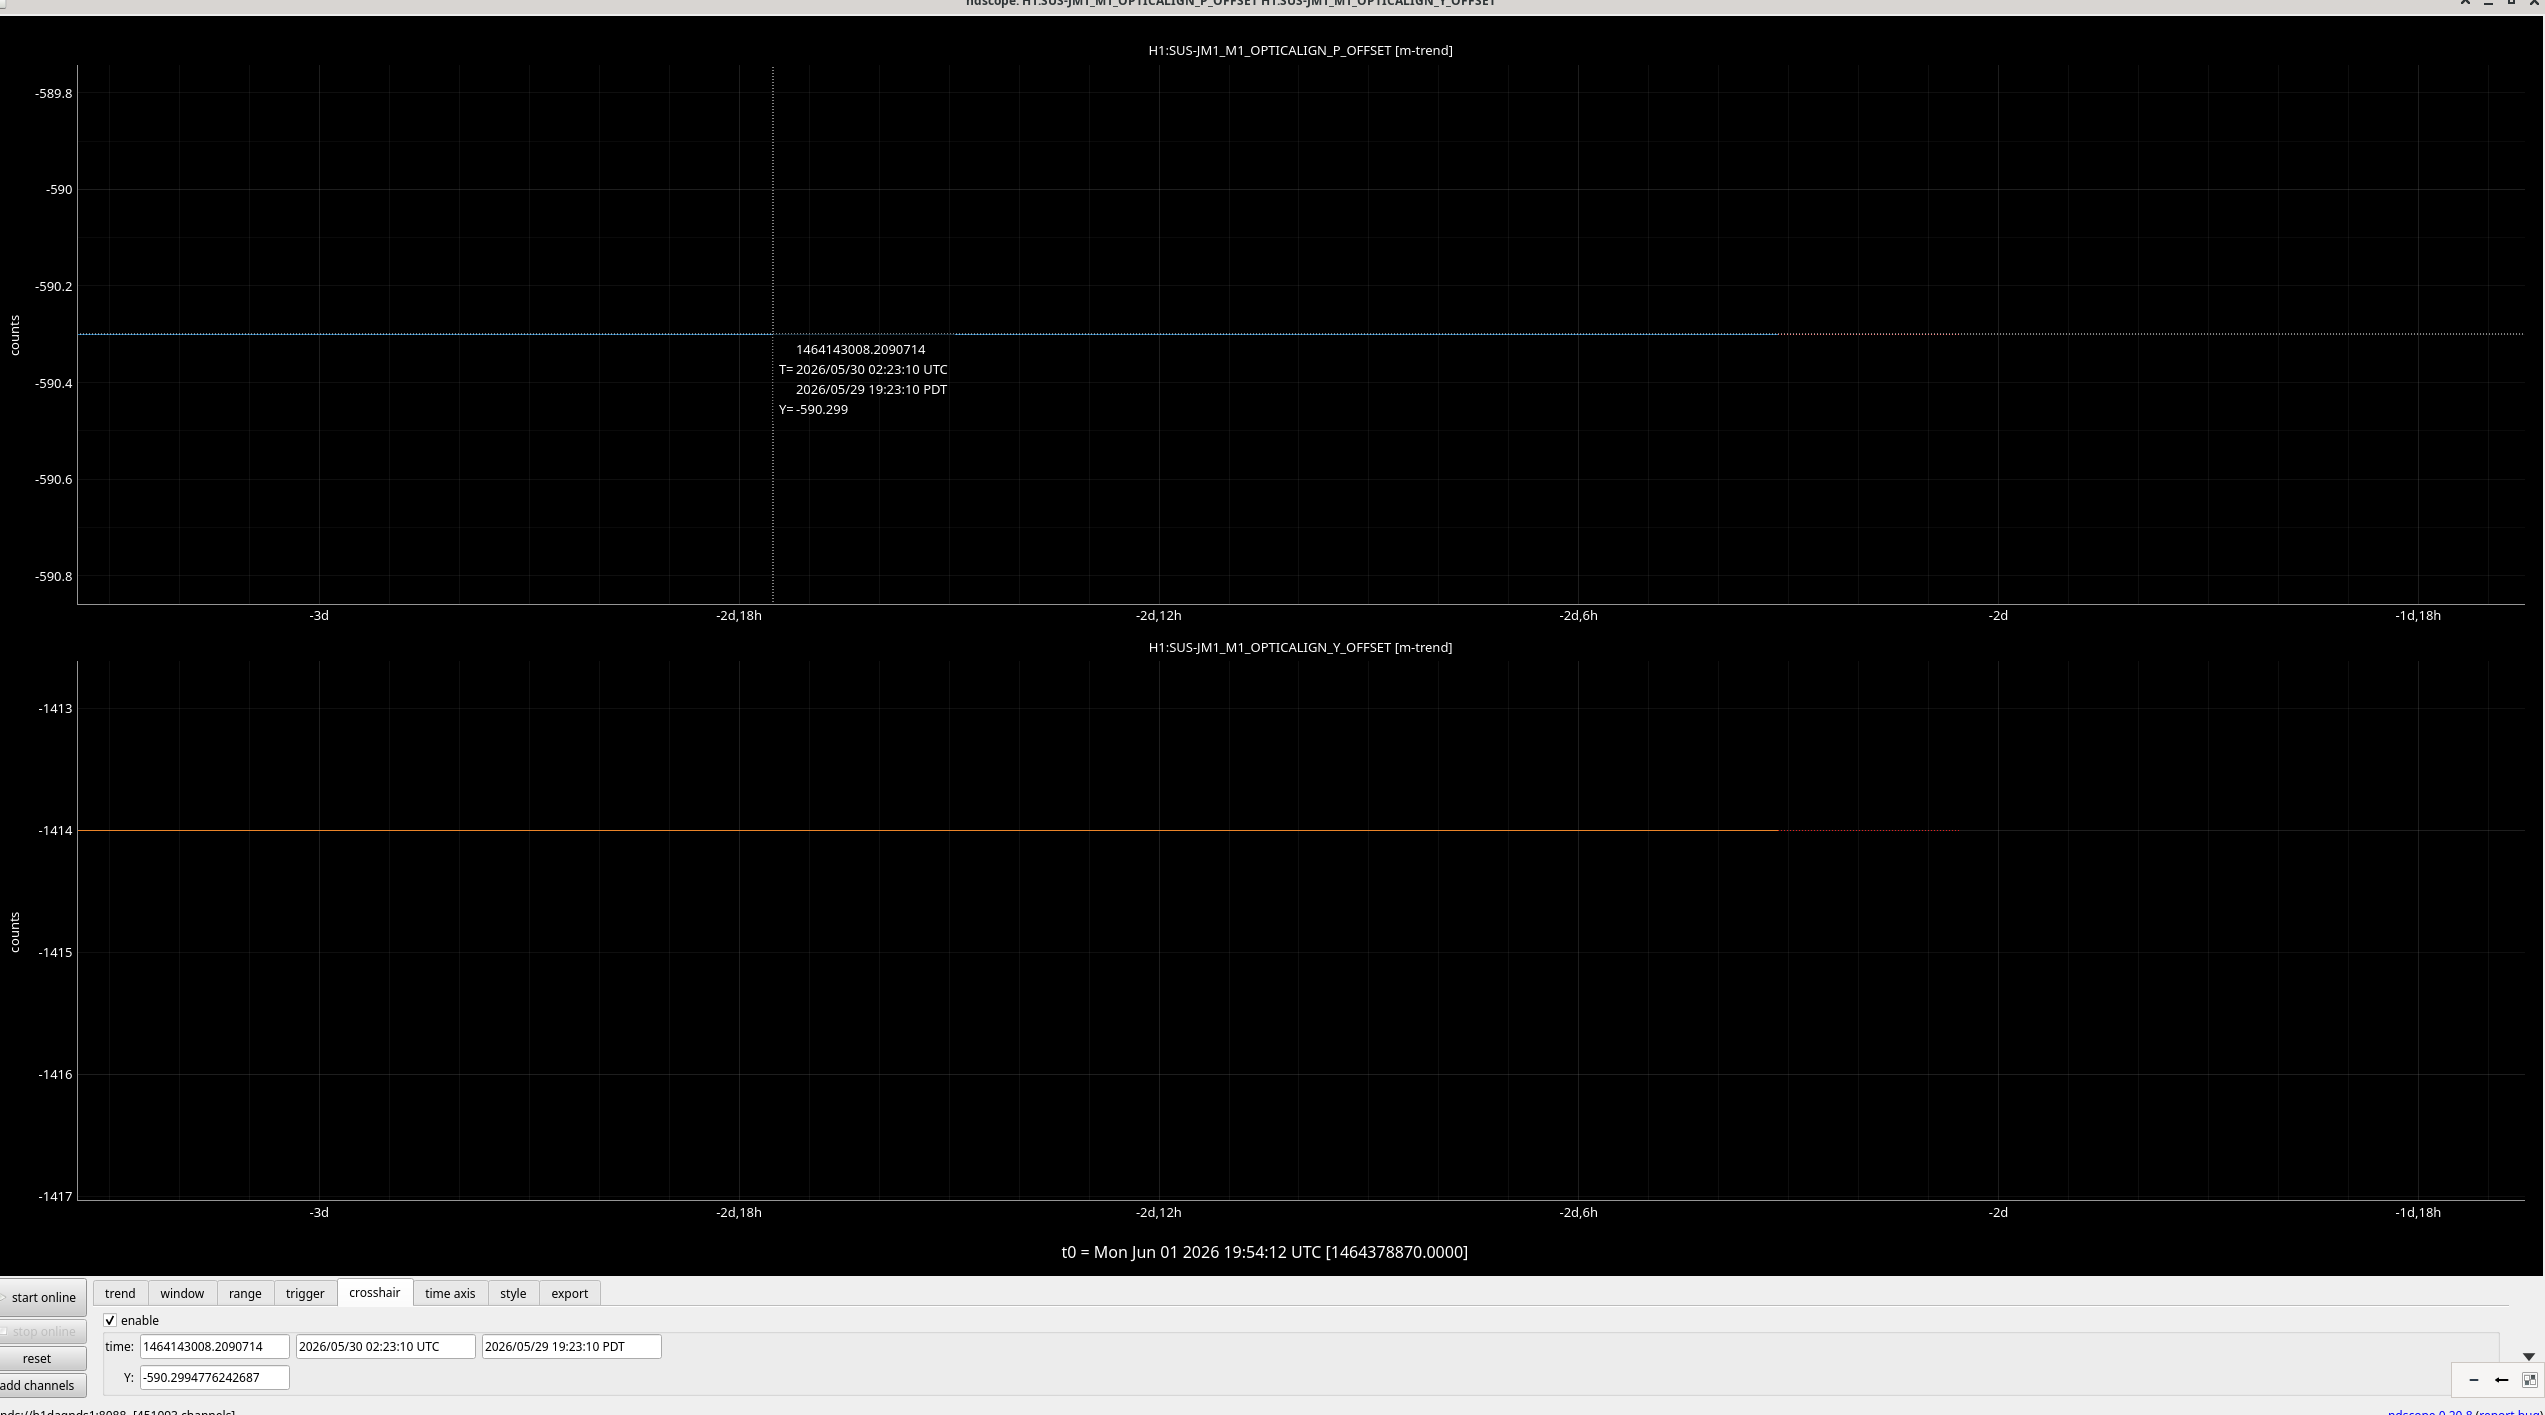
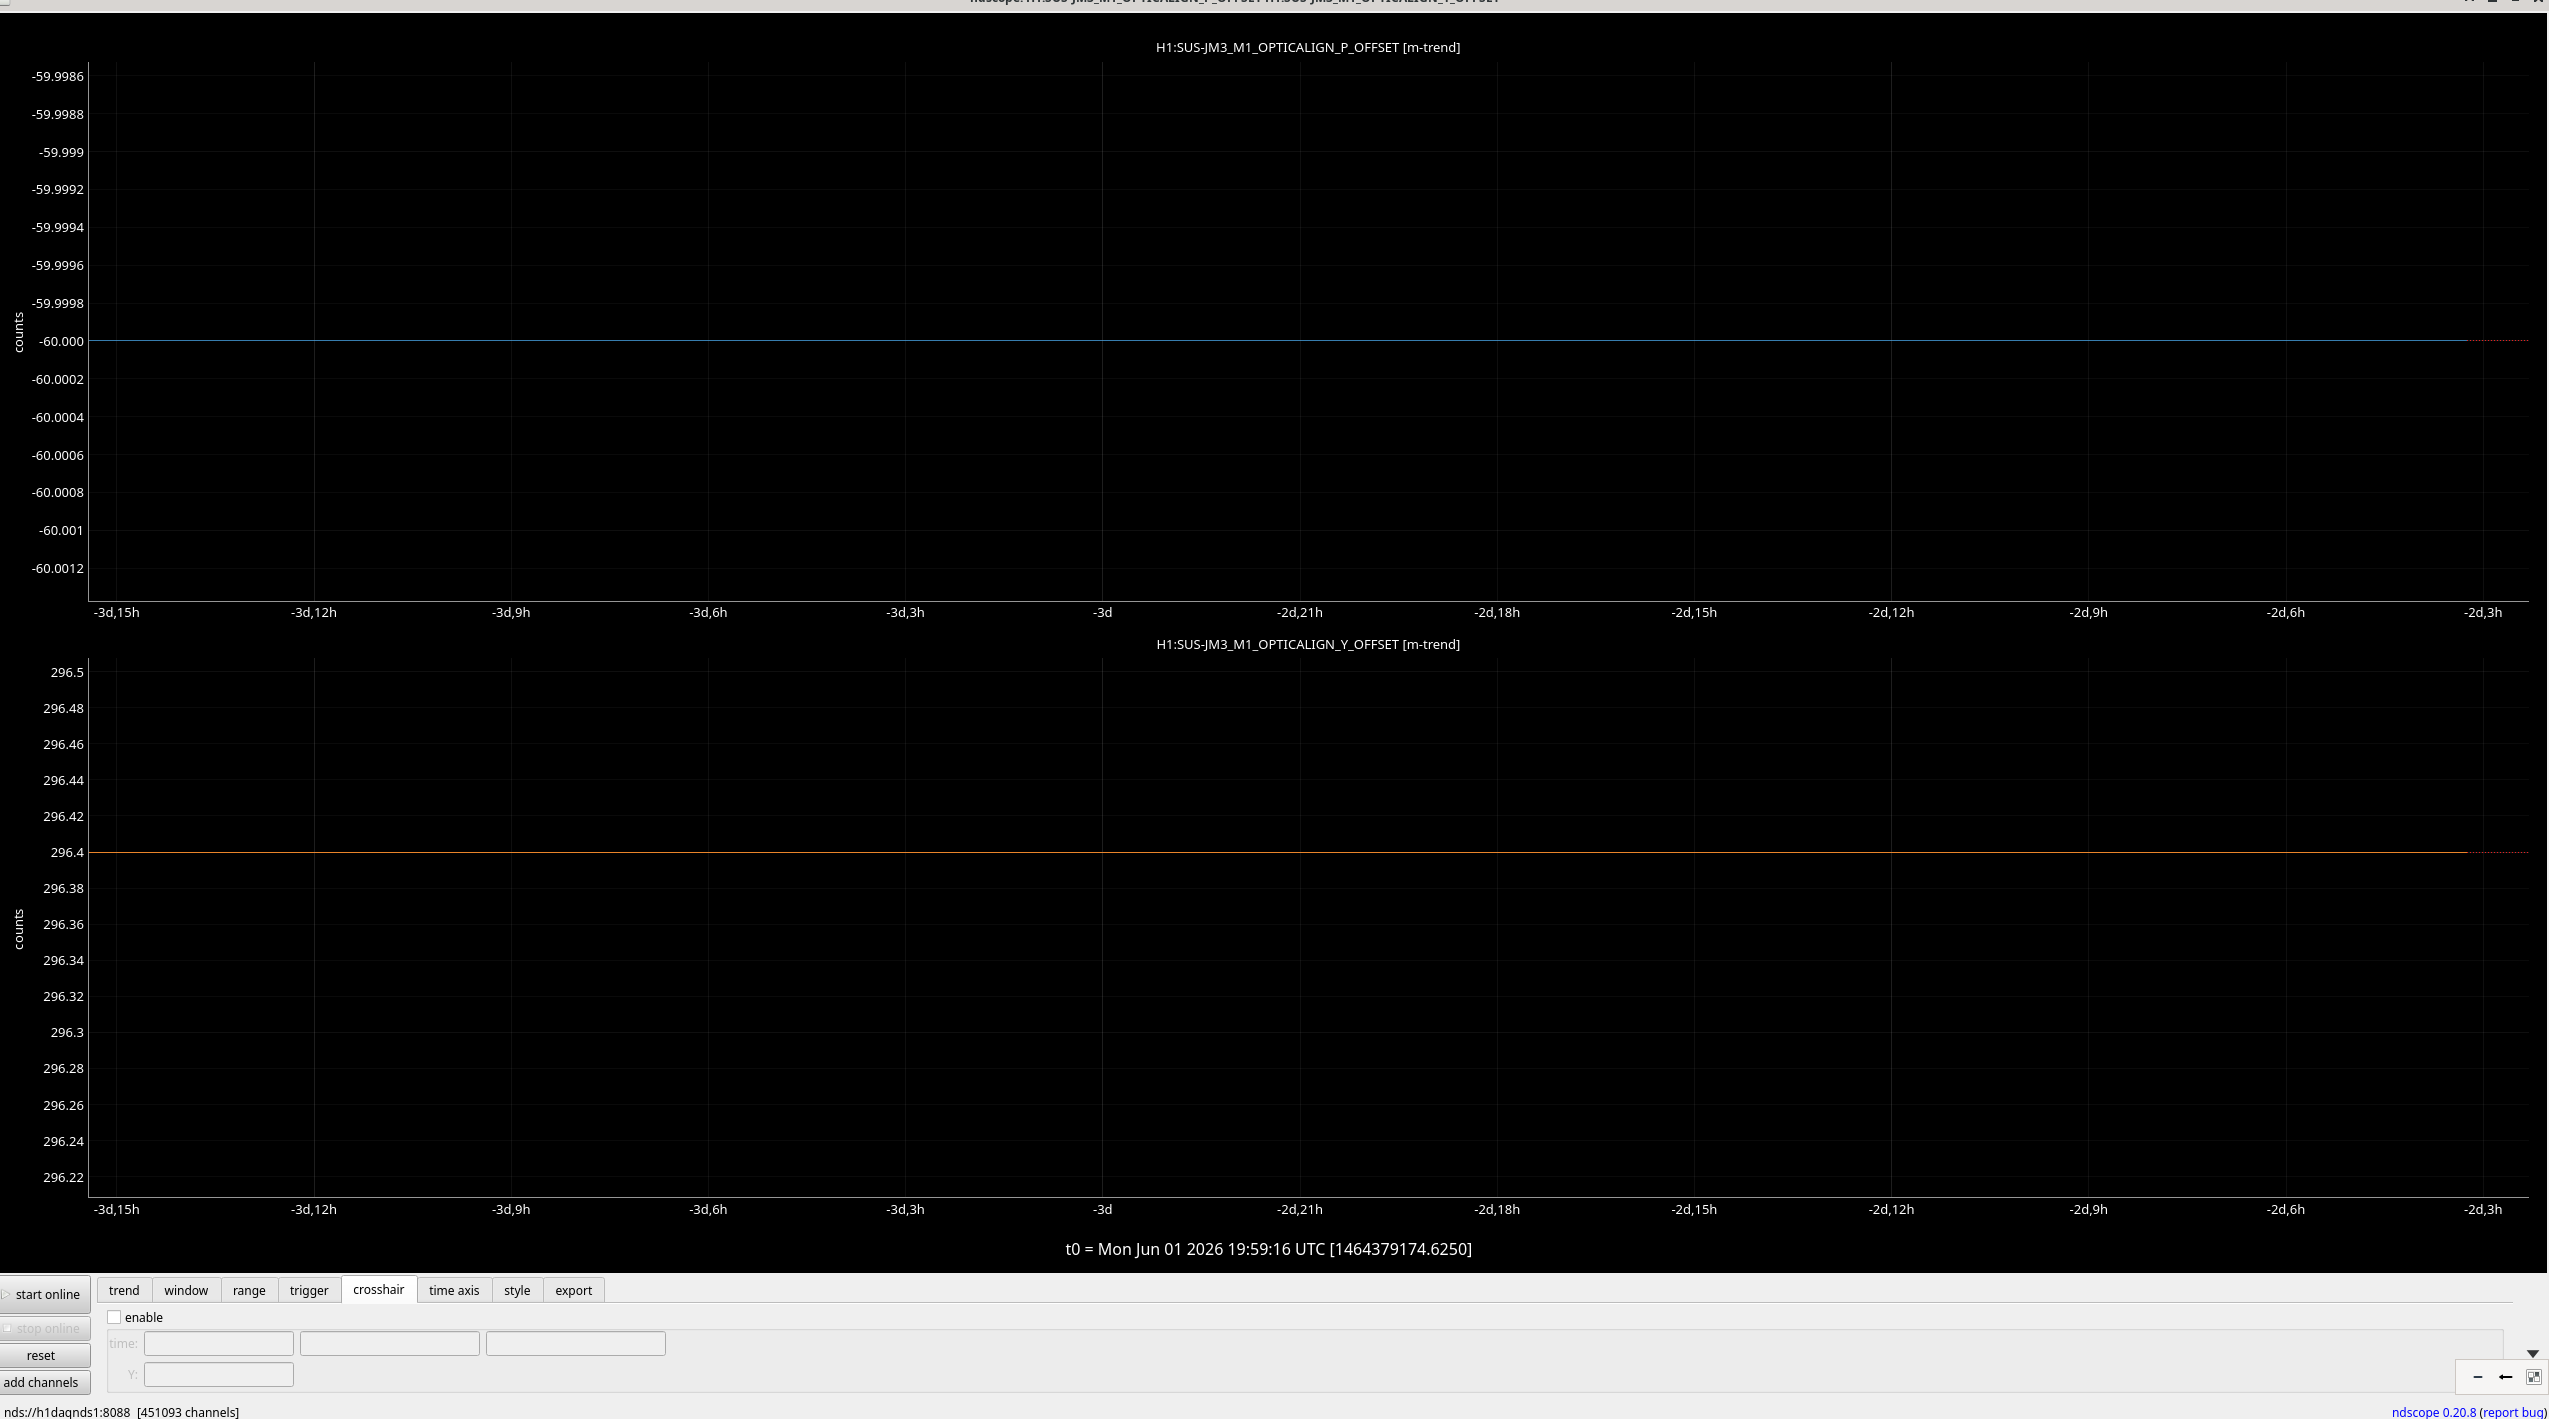
Anyway, using this technique we moved the PRM slider offset to [P, Y]=[-1165, +1000] (from [-1165, 20.5]).
Out of curiousity I changed the YAW offset of PRM from +1000 to +700 so [P,Y]=[-1165, +700], used RM1 to center REFL_B and RM2 to center REFL_A and it was easy without railing RM2 nor RM1. See attached.
I'll see if there's a space for an iris on IFI where both faces are clearly visible. If so we can probably use an IR sensitive camera as a better resolution viewer, center the iris for the forward going beam well, and observe the centering of the return beam on the iris.
(However, it's still a good idea to reduce the output impedance of the RM OSEM coil drivers. Small actuation range is fine if things are working well, but they're not.)


A ~2 week trend of the LVEA temperatures.
1610-1756 Covering Ops while RyanC does morning FARO work, and then handing off to TJ.
Have had a few connection drops for the EY Dust Monitor
LOG: