The security cover over the SPI Laser Prep Chassis is now locked. See alog 90585 for pictures. Keys are stored in the control room key box. A workpermit is required to unlock the security cover. Item should be added to LHO LVEA Laser Safe/Hazard Transition Procedure M1100115.
WP 13376
IOT2L field cabling reconnected. Picomotor driver chassis 5 was reinstalled.
WP 13069. "I found two instances of the EPICS IOC running on h0vaclx. I will close them both and start a single new one. I will also check the other Beckhoff vacuum machines and do the same for those if necessary." I also found two instances running on h0vacmx. Instead of closing both and opening one, I just closed one of the two instances on each of the two computers. Closed WP.
[Sheila, Camilla, Ryan, Eric]
We would like to verify that our recent mode measurements after ZM5 ( 90783) and before ZM4 (90815 ) make sense by connecting the two. We decided to use the q value from the measurement at the nominal ZM2 strain in 90815 (ZM2 strain = 3.15V) and propagate that mode through the path containing ZM4 and ZM5 and calculate the overlap with the q values from 90783 measured at different strain settings for ZM4/ZM5. The goals here are as follows:
First, I address item 1.
Mode Measurements with M2 > 1:
Our system seems to be adding some higher order abberations to the beam. As a result, our mode measurements indicate that we have an M^2 number significantly above 1 (between 1.2 - 1.5 depending on the PSAM settings). When M^2 is > 1, the presence of HOM content in the beam prevents one from focusing down to as tight of a waist, for the same divergence angle, the beam radius at the waist will be larger by a factor of M. The thorlabs beam profiler accounts for this by fitting the data to the following formula (which we confirmed by doing our own independent fit):
w(z)2 = wM2[1 +(z - z0)2 (pi*wM2/(M2*lambda))2]
Where wM2 = M2*w02 Is the waist for a beam with M2>1, and w0 is the waist for the TEM00 component of the beam (ie for M2 = 1).
The q parameter ends up the same as before:
q(z) = (z-z0) + i*zR
where zR = pi*w02/lambda = pi*wM2/(lambda* M2)
Knowing that M2 > 1 tells us that our beam is a mixture of TEM00 and some higher order mode content. However, from the M2 value alone we don't know which higher order modes are excited (in principle one might be able to make some rough projections using the surface abberation measurements of the PSAMs from Caltech, but that sounds tricky and is beyond the scope of today's post). If we want to do mode matching calculations, the only thing we can do at the moment is back propagate the TEM00 component and do all mode calculations for TEM00.
We use the same beam propagation matricies as always to back propagate the TEM00 component to determine what the TEM00 mode looks like in HAM 7.
Determination of the ZM4 and ZM5 ROCs
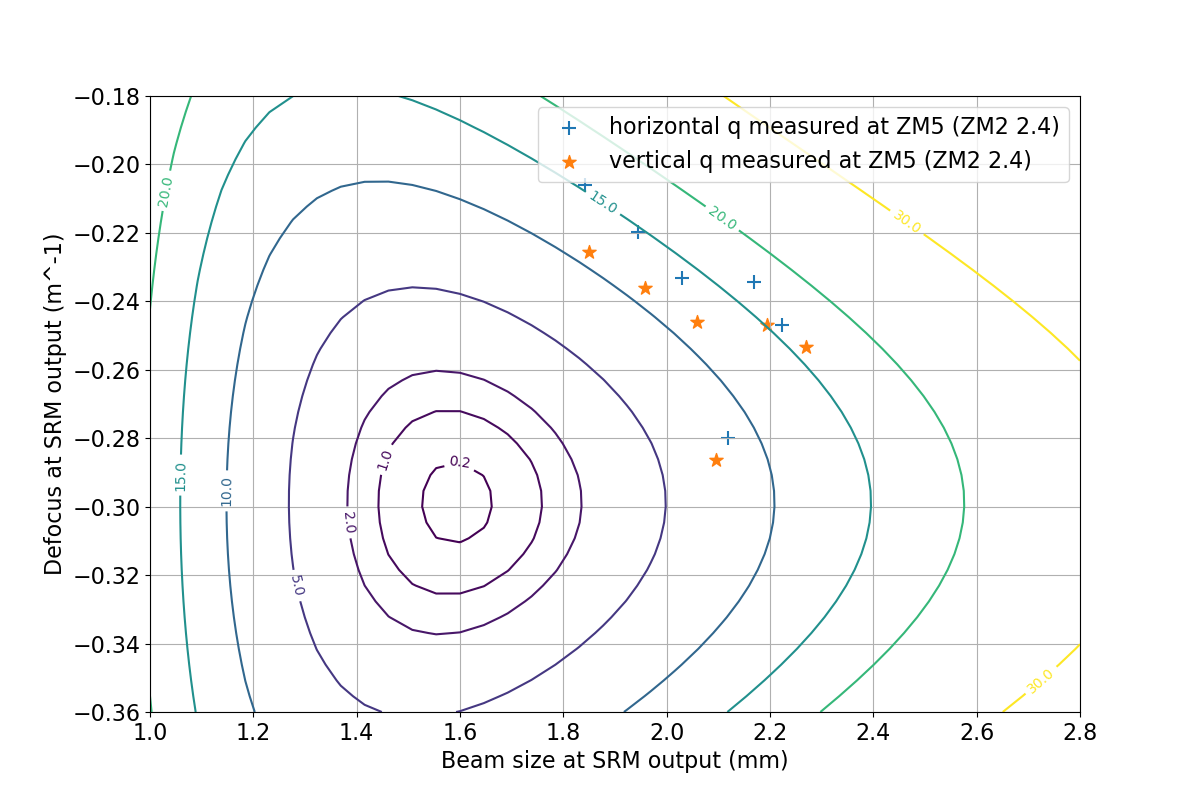
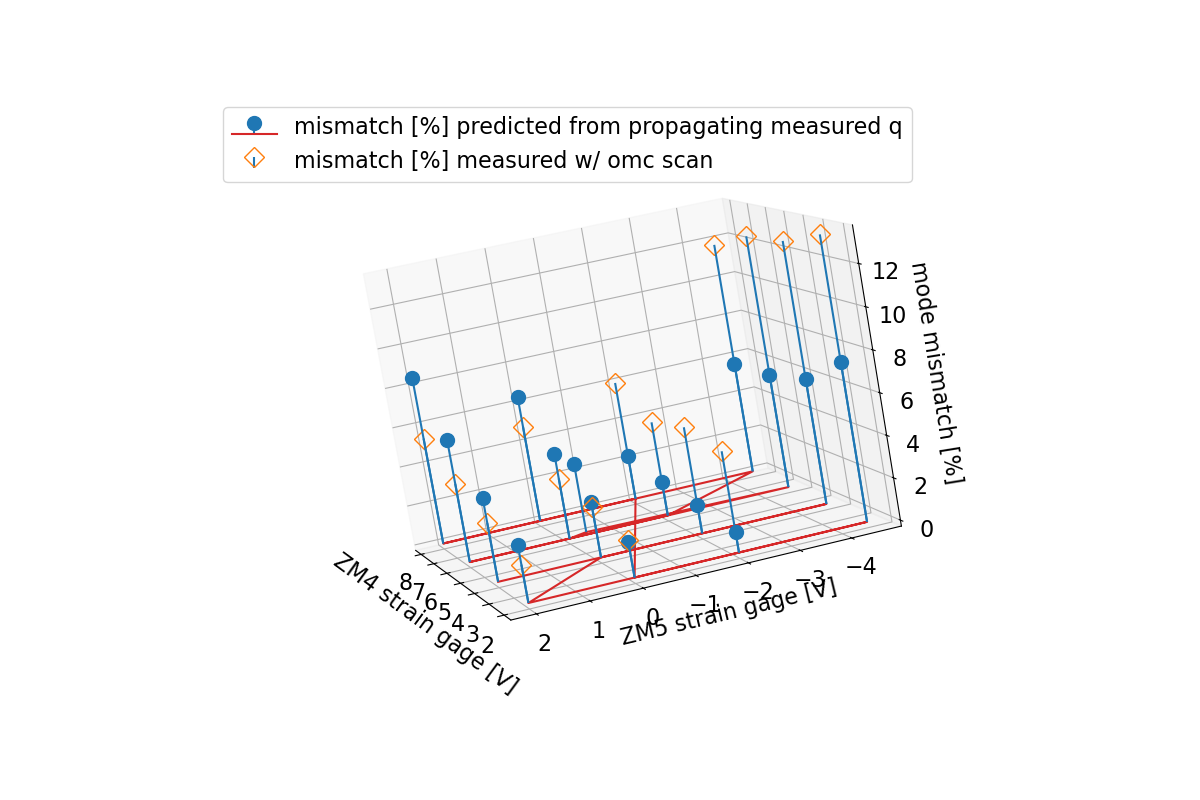
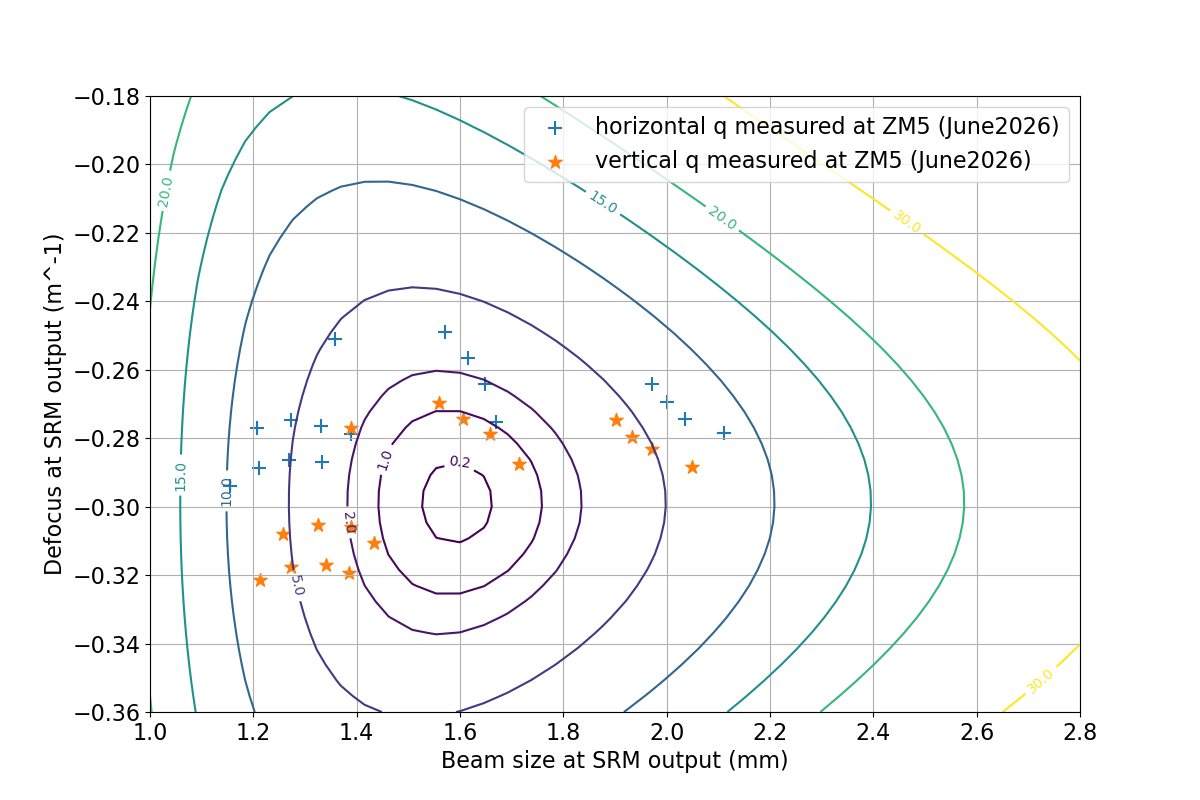
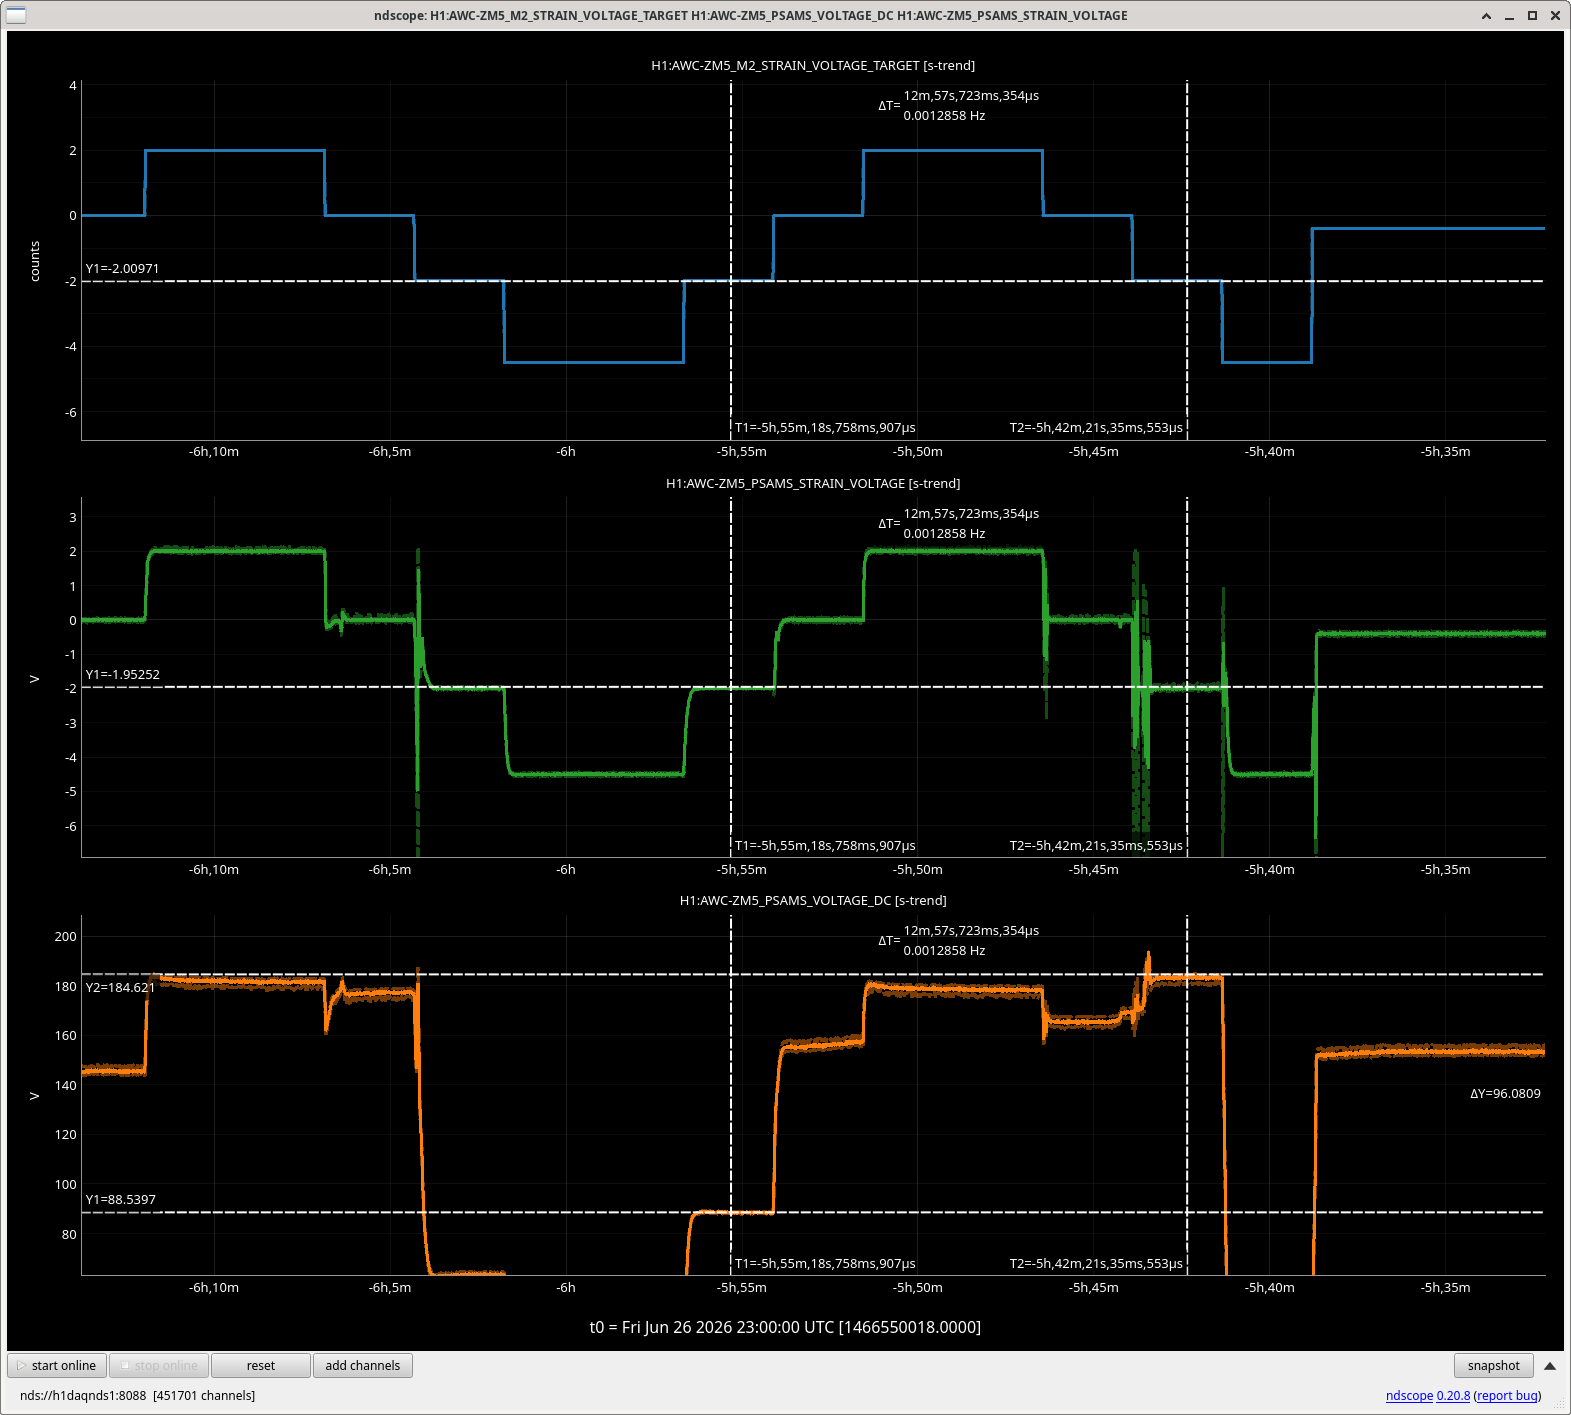
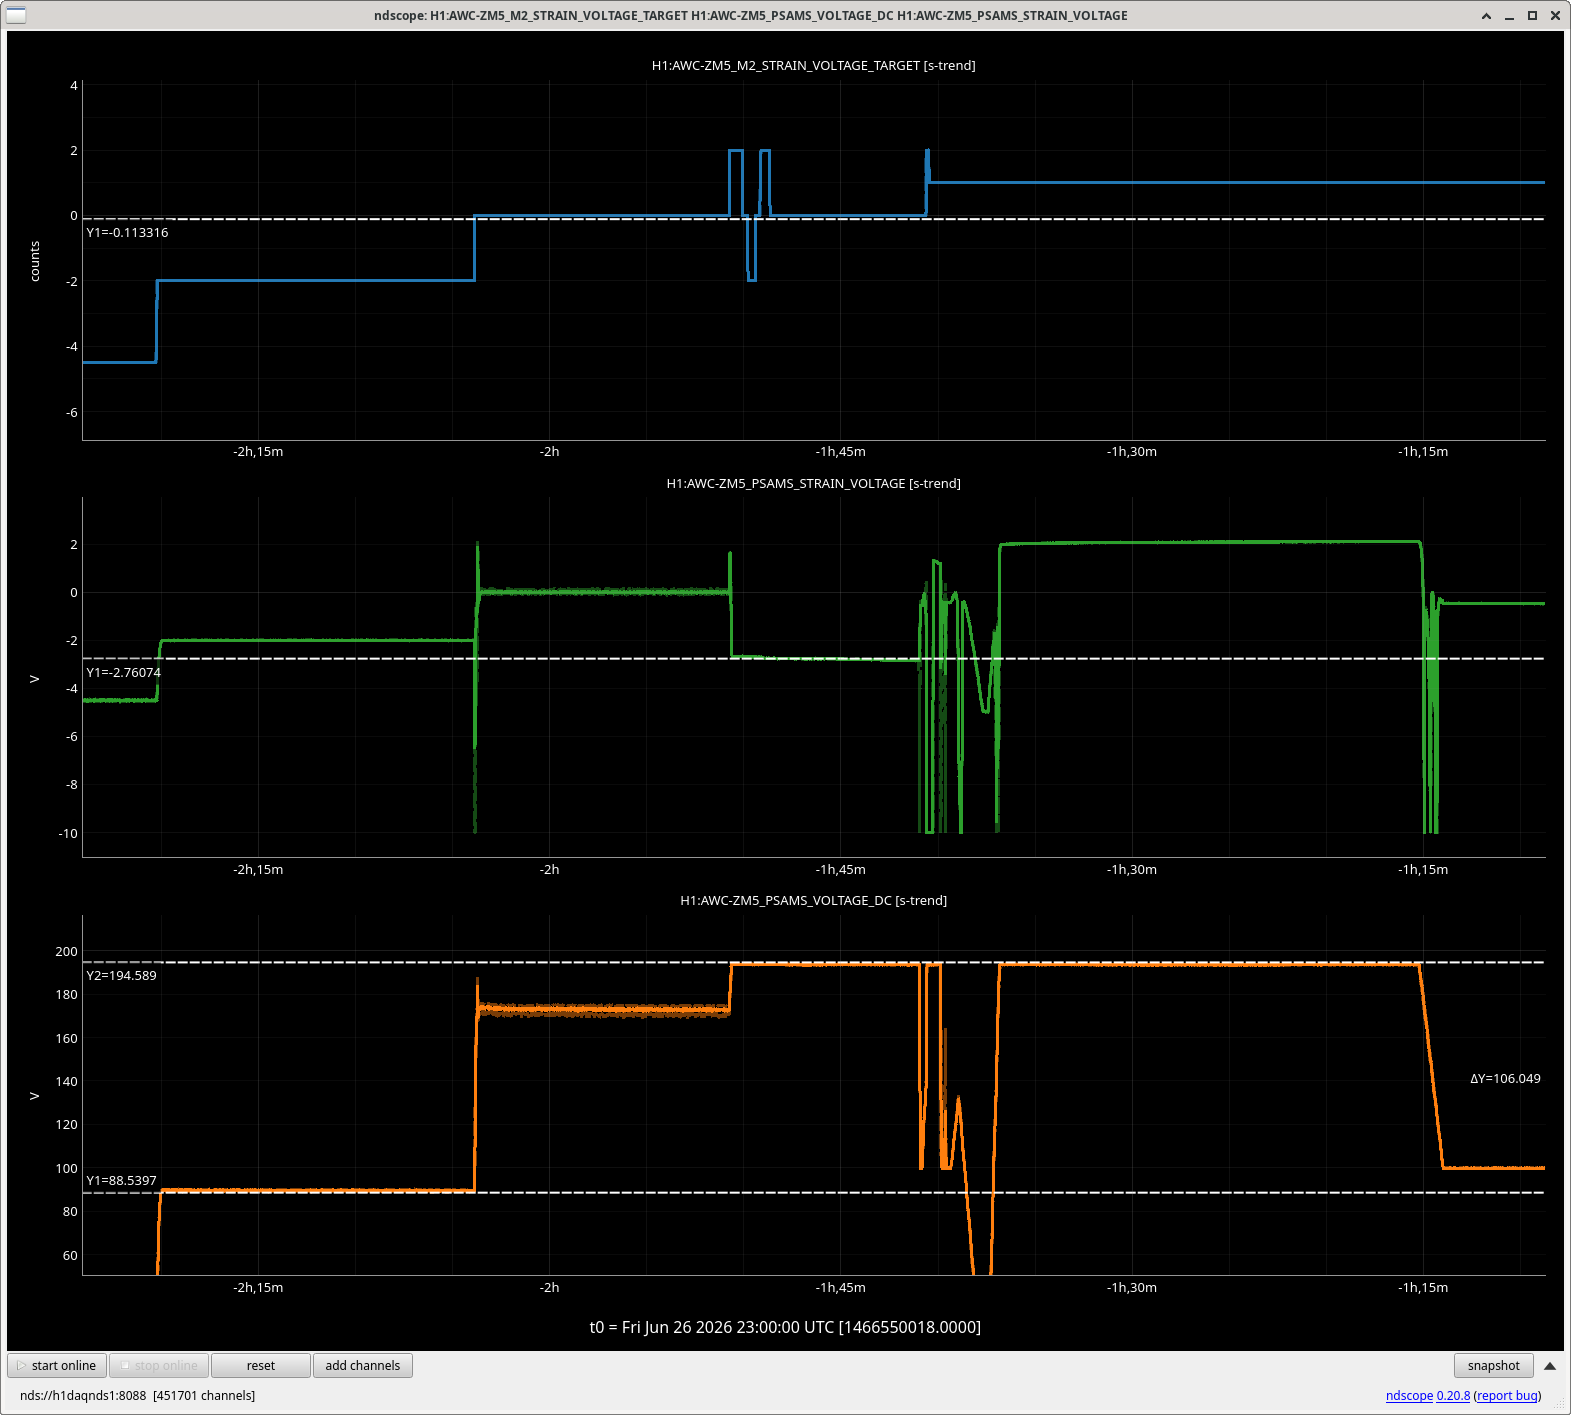
I then took the q value (for the nominal ZM2 = 3.15V) from the measurement before ZM4, back propagated it to ZM4 using our length measurements. I then propagated the q through ZM4 and ZM5 and calculated the overlap with the q values measured after ZM5 for various values of the ZM4/ZM5 strain gauge settings in ( 90783)
Then, the ROCs for ZM4 and ZM5 were chosen for each strain gauge settings to maximize the overlap. The overlap is => 98% over the entire 2D grid of ZM4/ZM5 strain gauge values, which gives us some confidence that the ROC values are accurate. One thing that gives us pause is that the change in ROC for ZM5 doesn't appear to change linearly in diopters with the strain gauge reading. ZM4, on the other hand is roughly consistant with a 5 mD/V change though because the beam spot is quite small on ZM4, we are relatively insensitive to its ROC value.
| ZM4 Strain (V) | ZM4 ROC (m) |
|---|---|
| 2.0 | -12 |
| 4.0 | -11 |
| 6.0 | -10 |
| 8.0 | -9 |
| ZM5 Strain(V) | ZM5 ROC (m) |
|---|---|
| -4.5 | 3.8 |
| -2.0 | 4.05 |
| 0.0 | 4.4 |
| 2.0 | 4.55 |
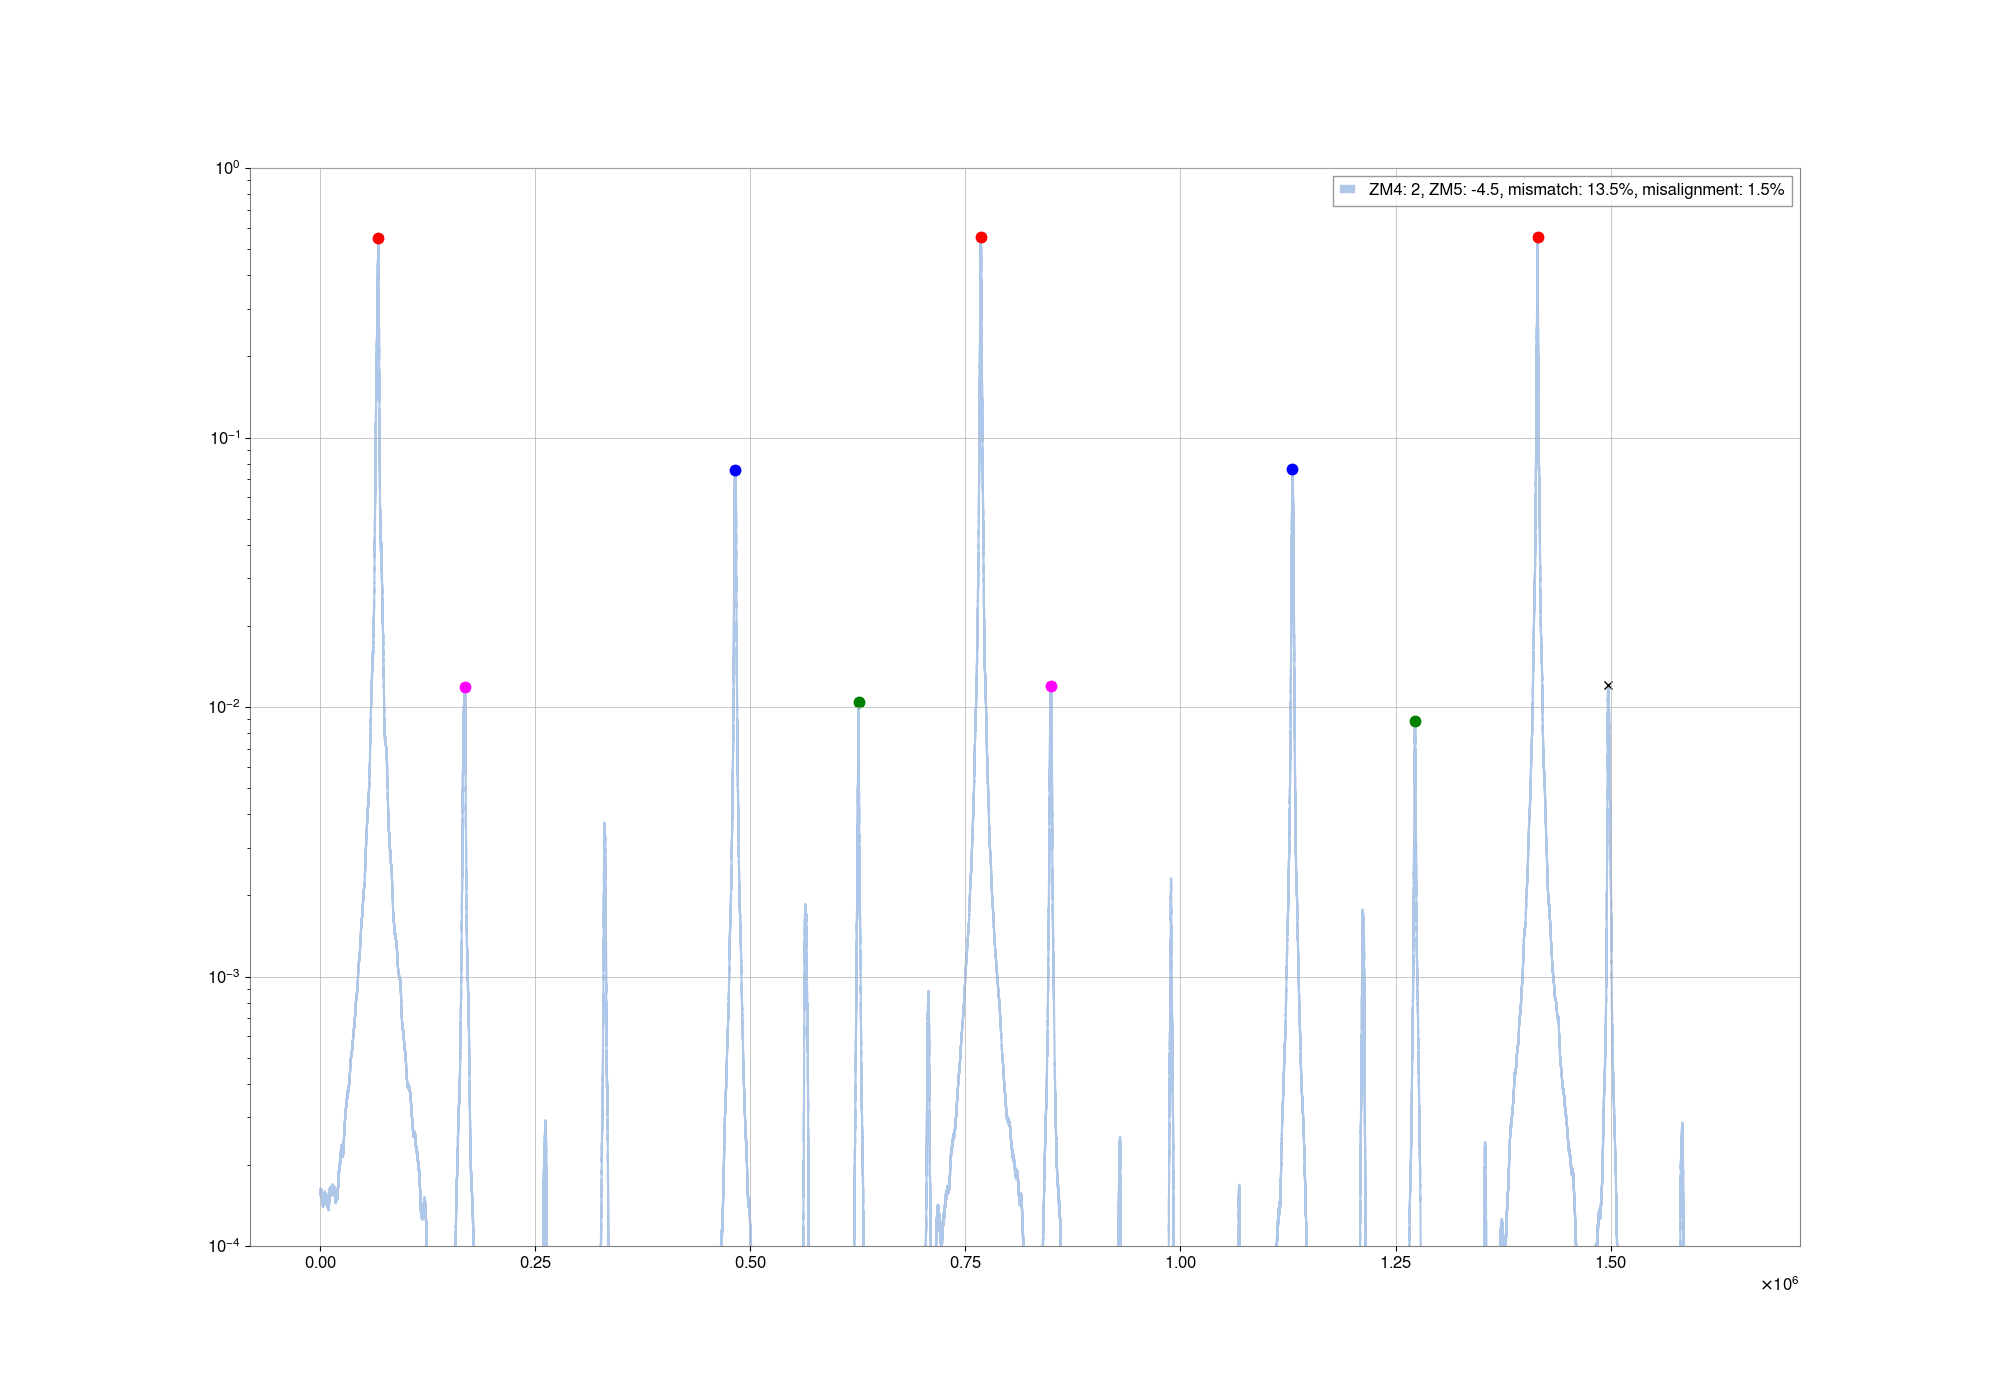
These values give the following overlaps for the x and y direction (our mode measurements indicate we have non-negligible asitgmatism on this path) for propagating the nominal q value from (90815 where ZM2 strain = 3.15) to the q vales from ( 90783) .
| ZM4 \ ZM5 | -4.5 | -2.0 | 0.0 | 2.0 |
|---|---|---|---|---|
| 2.0 | x = .994, y = .995 | x = .998, y = .997 | x = .990, y = .995 | x = .9874, y = .993 |
| 4.0 | x =.996, y = .997 | x = .994, y = .995 | x = .986, y = .992 | x = .983, y = .991 |
| 6.0 | x =.995, y = .997 | x =.992, y = .993 | x =.983, y = .989 | x =.980, y = .984 |
| 8.0 | x =.993, y = .995 | x =.990, y = .992 | x =.980, y = .984 | x =.977, y = .980 |
The fact that this set of ROC values gives good overlap over the entire 2D grid suggests that these ROCs are a resonable model for ZM4 and ZM5 at these strain gauge settings.
Attached is an a la mode file for doing the beam propagation. One could do some more intellegent fitting of the data to extract the best ROC estimates; I'm just sorta hand fitting it at the moment.
We have ZM5 SN4 installed now. Original data before we changed the preloading (E2100297) had the ROC range 3.0m to 3.9m. With at 0V applied 667mD optical power, with 200V applied 508mD.
In alog 75709 we increased the preload from 20 in lb to 47 in lbs. An estimated linear increase of 65mD as according to T2300426, changing the preloading changes the optical power by 2.4mD/in.lb.The preloading should make the magnitude of the optical power larger, so it should be increased to 667mD - 2.4mD/in lb * 27 in lbs = 602mD mD with 0 V on the PZT, 443mD with 200V on the PZT. This is an estimated ROC range of 3.3 to 4.5 meters for strain gauge -5.0 to +2.6V (it's range with 0V and 200V applied). This mostly agrees with Eric's data.
We have ZM4 SN1 installed now. Original data before we changed the preloading (E2100289) had the ROC range -19.3m to -9.0m. With at 0V applied -104mD optical power, with 200V applied -221mD.
In alog 75677 we increased the preload from 46 in lb to 75 in lb. An estimated linear increase of 70mD. This should be increased to -104mD - 2.4mD/in lb * 29 in lbs = -174mD mD with 0 V on the PZT, -291mD with 200V on the PZT. This is an estimated ROC range of -11.5 to -6.9 meters for strain gauge 1.0 to 8.3V. This mostly agrees with Eric's data.
I attempted to confirm these values by repeating this exercise with a second dataset from 90827. This was an additional set of q measurements made directly after ZM4. The idea here is that this should allow us to fit the ROC values for ZM5 only by taking these measured qs, propagating them through ZM 5 and comparing with the measurements from 90783. Unfortunately this did not proceed as smoothly. The fits and mode overlap values are tabulated below. This isn't too far from the old ROC range, but the agreement between the q values isn't nearly as good as before
Rough values for ZM5:
| ZM5 Strain (V) | ZM5 ROC (m) |
|---|---|
| -4.5 | 4.0 |
| -2 | 4.3 |
| 0 | 4.7 |
| 2 | 4.9 |
Mode overlap after propagating through ZM5 assuming the above ROC values. I was mostly optimizing the y value; the astigmatism seemed to be quite different in this dataset, leading to poor x/y agreement when propagating and comparing with the other data.
| ZM4 \ ZM5 | -4.5 | -2 | 0 | 2 |
|---|---|---|---|---|
| 2 | x = .975, y = .996 | x = .976, y = .990 | x = .954, y = .986 | x = .948, y = .982 |
| 4 | x = .981, y = .994 | x = .971, y = .986 | x = .956, y = .982 |
x = .947, y = .981 |
| 6 | x = .974, y = .992 | x = .969, y = .990 | x = .946, y = .977 | x = .937, y = .971 |
| 8 | x = .969, y = .990 | x = .955, y = .980 | x = .940, y = .970 | x = .930, y = .963 |
Madi, Camilla, TJ
Last week we changed the lenses in the HWS path, to get an unclipped beam from the OzOptic 532nm laser (installed 89993) through the transmon and back out. The lens chain was designed so that the beam matched the ALS beam at M11 ie the PBS (ALS beam measurements 90370). The goal is to verify lens design methods, as well as get another measurement of the 'badness' affecting the beam in-vacuum.
New lenses and positions:
L3: f = -559mm, position: 7cm from M4, between M4 and Pol
L2: f = 1000mm, position: 15cm from M3, between M3 and BS2
L1: f = 2200mm, position: 26cm from M3, between M3 and BS2
The into-vacuum beam was measured after M11 and picked off the path using the Pellicle beamsplitter, before being put through a lens to make the beam small enough to be measured by the Nanoscan. Nanoscan images attached. The ingoing beam is nice and round, no astigmatism.
The return-from-vacuum beam was measured in the same location, and again picked off using the Pellicle and focused through a lens in order to measure. Images attached. Once again, the two-lobed pattern was observed, consistent with the measurements taken of the ALS a few weeks ago ( 90370). This time without the ellipticity, which was due to the in-going ALS beam shape.
Next steps are to verify the design of the lens chain with the real life measurements, and determine if the shape of the return-from-vacuum beam is too 'bad' to be used in a HWS measurement.
We had two rounds of restarts. The first was a full models+EDC+DAQ restart with a longer TW outage to copy rawminute trends to preserve recent lookbacks. The second was an unplanned restart to add an IPC between CRS and ISIHAM3 which needed a DAQ restart.
WP13365 CRS and ISI HAM2,3,4,5
New models for h1isiham[2,3,4,5] were installed and the DAQ was restarted. I was then found that an IPC between h1crsproc and h1isiham3 was both not running and was the incorrect type (a PCIE channel which should be SHMEM). Jim fixed the h1crsproc sender and h1isiham3 receiver. Because this channel was already in H1.ipc as a PCIE, I hand edited this file to remove it so the build of h1crscproc added it back as a SHMEM channel.
WP13366 PEM add 5th ADC channels to DAQ
New h1pem[ex,ey] models were installed which acquire the first 8 channels of the recently added 5th ADC to the DAQ at 2kHz. DAQ restart was required.
WP13346 Remove CP1 Overfill
The EDC master file was edited to remove the H1EPICS_CP1.ini file. EDC+DAQ restart was required.
WP13304 New HEPI Pump Control IOC
Patrick installed a new EY HEPI pump control system which has new EPICS channel names. A new H1EPICS_HEPIPUMPEY.ini file was installed. 120 new channels had old channel equivalents, the raw minute trends for this files were copied to the new names as part of the trend writer restarts.
DUST LAB2 removal from EDC
A restart Lab Dust IOC removed the LAB2 channels from its IOC. As a temporary solution I had added these channels to the edc_green_ioc dummy IOC running as a the service-host container. Today these channels were removed from both the container and H1EPICS_DUST.ini, and then removed from the EDC as part of the DAQ restart.
DAQ Restarts
The first DAQ restart included a rawminute trend file copy on both trend writers:
1 Restart models
2 Stop TW0 and TW1
3 Run copy script on TW0 and TW1, some new hpipump channels will be starting from where the old channels left off
4 DAQ 0-leg plus EDC restart (also restarts TW0)
5 DAQ 1-leg restart (also restarts TW1)
No major issues with this restart.
The second DAQ restart was just a model restart, no EDC restart was required.
FW1 spontaneously restarted 53 minutes later.
Restart Log:
Wed01Jul2026
LOC TIME HOSTNAME MODEL/REBOOT
09:12:31 h1iscex h1pemex <<< add ADC channels
09:13:05 h1iscey h1pemey
09:16:07 h1seih23 h1isiham2 <<< New CRS components
09:16:33 h1seih23 h1isiham3
09:17:20 h1seih45 h1isiham4
09:17:48 h1seih45 h1isiham5
09:22:02 h1daqgds0 [DAQ] <<< first 0leg restart
09:22:06 h1susauxb13 h1edc[DAQ] <<< EDC restart
09:22:07 h1daqfw0 [DAQ]
09:22:07 h1daqtw0 [DAQ] <<< TW0 restart after file copy
09:22:08 h1daqnds0 [DAQ]
09:26:02 h1daqdc1 [DAQ] <<< first 1leg restart
09:26:11 h1daqfw1 [DAQ]
09:26:12 h1daqtw1 [DAQ] <<< TW1 restart after file copy
09:26:15 h1daqnds1 [DAQ]
09:26:21 h1daqgds1 [DAQ]
09:30:52 h1daqfw1 [DAQ] <<< spontaneous FW1 restart
10:05:40 h1seih23 h1crsproc <<< Fix CRS IPC
10:06:14 h1seih23 h1isiham3
10:06:52 h1daqgds0 [DAQ] <<< second 0leg restart
10:06:59 h1daqfw0 [DAQ]
10:07:00 h1daqnds0 [DAQ]
10:07:00 h1daqtw0 [DAQ]
10:10:54 h1daqdc1 [DAQ] <<< second 1leg restart
10:11:05 h1daqfw1 [DAQ]
10:11:06 h1daqtw1 [DAQ]
10:11:11 h1daqnds1 [DAQ]
10:11:15 h1daqgds1 [DAQ]
10:11:59 h1daqgds1 [DAQ] <<< GDS1 needed a restart
11:02:37 h1daqfw1 [DAQ] <<< spontaneous FW1 restart
I found a copy-paste error in h1pemey with its ADC_4 bus selector. This was fixed and the model restarted at 14:01. No DAQ restart was required.
The filtermodules feeding the new ADC_1_[00-07]_OUT_DQ channels were set to pass the signal through and the SDF safe.snap files were updated.
TITLE: 07/01 Day Shift: 1430-2330 UTC (0730-1630 PST), all times posted in UTC
STATE of H1: Planned Engineering
OUTGOING OPERATOR: None
CURRENT ENVIRONMENT:
SEI_ENV state: MAINTENANCE
Wind: 13mph Gusts, 7mph 3min avg
Primary useism: 0.02 μm/s
Secondary useism: 0.11 μm/s
QUICK SUMMARY:
Potential work according to the trello schedule:
BSC2 - Alignment check w/SQZ beam
BS - Re-center OPLEV (Jason)
TUES - BSC2 - ground loop checks and fixes (Fil, Oli, Betsy)
BSC2 - L4C install at dome level (Mitchell, Jim)
TUES - HAM3 - ground loop checks (Fil)
BSC2 & 3 - B&K testing (TJ, Ibrahim, Rahul)
HAM3/BSC2 - In chamber work, after FARO/HEPI work - Suspend, TFs (Ibrahim, Betsy, Oli)
HAM7 - In-chamber SQZ work continued, local laser Haz
Potential CDS work not listed on the trello:
Longer than normal model restarts for PEM, & CRS to include new channels , and new camera channels & maybe some HEPI beckhoff channels.
This afternoon Ryan Short, Jackie, Maya and Camilla took another set of measurements with the M2 profiler for different ZM4 + ZM5 strain gauge values. We wanted to change ZM2 psams to be somewhere in the middle of the voltage range that looks good based on Begum's 5th attachment to 90613, the measurements were mostly taken with ZM2 at 37 volts on the PZT and the ZM2 strain gauge at 2.4V.
I've attached the data that Ryan sent here, and a preliminary plot of where the mode is on an Sw plot at SRM with the changed ZM2 psams. This can be compared to the same plot with ZM2 at 3.15V and it looks quite different.
Most of these points were taken with ZM2 at 2.4V on the strain gauge as the legend says, there is one outlier which was at 3.15V ZM2, ZM4 2.0V. and ZM5 -4.4V. This point does seem to be in the same area as the same point taken last Friday.
So, it seems that by moving the ZM2 psams to better mode match to the filter cavity we are moving the mode out of ZM5 by a lot more than the range of ZM4 and ZM5. So, we will need to set the preloading and lens positions for a particular choice of ZM2 psams.
Just finished tfs for BSC2 ISI, they seem ok given the purge situation. I think I will have to wait until the dome is on to try to get better resolution tfs. Still have a couple other tests I want to do before sign off on the chamber, like some quick checks of HEPI range of motion. Should be done shortly.
A couple other checks I have done: a quick range of motion test on HEPI (driving +/-100um in x,y&z and +/-30urad in rx,ry,rz), locked spectra of seismometers (mostly checking the H1 L4C Mitch and I replaced this afternoon looked like the others), and free swinging cps spectra of the unlocked table. This last one somewhat suggests that the rubbing that BSC2 had may have been fixed (I found a st2 actuator cable grazing st2 where it shouldn't have been), previous ones taken in vac show the St2 corner 1 cps were seeing a bunch of extra motion below 1hz, this is no longer visible, as shown in attached spectra.
I'm heading out in a second to lock HEPI and ISI to prep for dome install.
Fil, Ibrahim, Betsy, Oli
Fil conducted grounding loop checks for the BBSS M1, M2, and M3 satamps. Grounding was found for SUS_BS_82 pin 23 and pin 10. After some issues, we managed to replace the grounded QOSEM with a working one, which we later aligned (see Ibrahim's alog 90838). BS M1 F3: was S2600013, now S2600016
SUS_BS_82 is the cable for CH3 (F3) and CH4 (SD), and pins 23 -> 10 are the coils for F3, so there was an issue somewhere between the satamp and F3.
Cables that Fil tested that aren't grounded are:
Testing SUS_BS_82, all pins looked good except for Pins 23 and 10. Below are their readings:
Checking wrt Chamber:
Checking wrt Rack:
Flipping the pos/neg leads and checking wrt Rack:
After we found out that F3 is grounded to the chamber somewhere, we went in and unplugged F3. Once it was unplugged, we tested the cables to see if we were still grounded to determine if it was an issue in the wiring or in the QOSEM. The cables were not grounded, which told us that the issues was with the QOSEM. The installed QOSEM at the time was S2600013. We removed it and installed S2600025, which did not have any grounding issues, but the LED wasn't working on it, so we had to remove it. We then installed S2600016, which was not grounded and was also working fine. Later we centered it in X (90838).
Ibrahim, Oli, Betsy
Today, alog 90834 found a ground loop issue with QOSEM SN 13 so we had to swap and center. We then swapped it with QOSEM SN 25, which immediately yielded noise. The red LED was not on, so this QOSEM was broken (despite 25 not being an unlucky number). We then swapped it with QOSEM SN 16, and centered it.
We will recenter everything else tomorrow or after.
TITLE: 06/30 Day Shift: 1430-2330 UTC (0730-1630 PST), all times posted in UTC
STATE of H1: Planned Engineering
INCOMING OPERATOR: None
SHIFT SUMMARY:
Busy Maintenance Day with lots of activity in/at/around BSC2 to help make Dome install tomorrow happen. B&K, SQZ, CRS activities also continued.
LOG:
Rahul, Ibrahim, and I B&K'd the BBSS and ITMX today. Rahul and Ibrahim were in chamber managing the cables and covers, while I was on the laptop outside. I still need to process the results, but this alog's existence means that it happened.
Per ECR E2600223, a ZV-800 style viewport was installed on the G11 port (+X, +Y, middle port) of BSC2. The First Contact that was applied after inspection was removed. No smudges were noted except the outside edge, ~1/4" from the metal flange where the FC didn't cover.
A scratch was noted on the chamber conflat flange (see pic), but the actual knife edge ding associated was very small.
End X BRS has been drifting more out of rang over the past week. The BRS originally got out of range a month ago (LINK ALOG) I'm boosting the drift control (H1:ISI-GND_BRS_ETMX_HEATCTRLIN) from 4V-->8V to try and get it back to the temperature the plate was before it started to get out of range.
The original temperature is ~36, and right now H1:ISI-GND_BRS_ETMX_HEATTEMPL is reading 27.0, but I'm hesitant to max out the drift control as it was set to 6V when it was last in range.
I'll check back in on it later today/this week
Moved the heat control down to 6V because 8V increased it up to 41
I ended up using the pico motor and remote mass adjuster to try and re-balance. Here are some of the relevant alogs: 76888 75802 80183 84434
From an earlier alog we had calculated ~3.2 counts per step, currently DRIFTMON=~12220, so it should move 3.8k steps, but from other times it's been moved it seems like the steps per count might be less, so I'm going to start with a smaller step amount and check back in later today or tomorrow morning.
Channel 5 of ISC_CUSST_PICOMOTOR_CONTROLER_SIMPLE
To couple :-1.5k in steps of 100, waited a couple of minutes for it to damp down
-2k in 100 step chunks, I don't know if moving in smaller chunks did anything, but it somehow felt better
+1.25k to decouple
Total moved: -2250 steps
Over shot the center, now the BRS is too far in the minus direction, turning the drift control to 0 (6V->0V) to try and bring it back towards the center and if that doesn't zero it I'll move the mass adjuster back a bit
Eric, Ryan S, Camilla, Sheila
All week we have been working on getting a set of OMC scans and beam profile measurements for different psams. We have both sets of data now, with plots and scripts coming soon next week.
OMC scans
We started with a script that Begum gave us from HAM6 work at LLO. We set up ASC loops to go from ASA and AS B DC signals to ZM4 and ZM5 (as described in 90742). We struggled a while to lock the OMC on the seed beam in air, hampered by 90754. With that noisy OMC lock, yesterday Camilla manually aligned OM3 and the OMC suspension carefully to maximize the 00 transmission. We then added offsets to H1:OMC-ASC_QPD_{A,B}_{PIT,YAW}_OFFSET, which is not the usual location for OMC QPD offsets. We will need to get rid of these offsets before we go back to locking.
OMC A offset: PIT 0.088 YAW: 0.133 OMCB offset: PIT 0.27 YAW: -0.22
We found that we were able to move the psams, whih misaligns the OMC terribly, run the centering loops to the ZMs, then run the OMC QPD loops to bring the 1st order peaks back down to a couple % of the 00 peak repeatedly. We spent some time modifying and then debugging the script that Begum shared with us.
It takes in a list of ZM4 and ZM5 strain gauge values, moves the psams servos target to that point and waits 30 seconds with the ZM centering loops on (it doesn't check the acutal value of the strain gauge, perhaps this would be a good thing to add next time). It then turns on the OMC QPD loops for 20 seconds. It then takes a 100 second ramp of the OMC PZT, and saves the times and ZM strain gauge targets into a yaml file.
There is a template you can use to watch all this at userapps/sqz/h1/Templates/ndscope/OMC_psams_scans_monitor.yml The script that runs these sweeps is at sqzutils, or /ligo/gitcommon/squeezing/sqzutils/omc_scans_sweep_psams.py There is also a script there that loads the data, identifies the peaks and estimates mode mismatch and misalignment there, analyze_psam_omc_sweeps.py. A preliminary plot is attached (apologies for the color choices and linear y scale here).
M2 profile measurements
Eric and Ryan S took a series of M2 profiler measurements of the beam on SQZT 7 today, doing the alignment procedure at each strain gauage setting (they didn't adjust ZM alignments). Their data is in here, we will post some plots of this next week.
Note about ZM5 strain guage
While Eric and Ryan were making beam profile measurements, they ran into a situation where ZM5 would not go the strain guage setting of 2. I was able to get it to go to 2 manually, but noticed that there were times when the strain gauge voltage dropped to zero, similar to a problem seen at LLO HAM6 recently. We should follow up on this next week.
More on the ZM5 strain gauge issues -
While Eric and I were taking beam profiles and moving to the last step for the ZM5 PSAM (requesting 2V), the strain gauge readback voltage fell to -2.8V and got stuck, shown at the T-cursor in the first attached ndscope. Changing the requested voltage away from 2V did not affect the strain gauge's behavior or the voltage sent to the PZT, which looked to be railed close to 200V. Eventually Sheila was able to unstick the voltage and get the strain gauge back to 2V by stopping the servo and clearing its history.
This is reminiscent of behavior seen at LLO with one of their new HAM6 PSAMS, OMA2, where after scanning the PZT to the edge of its range, the strain gauge would show open loop for a few seconds, then return to normal (LLO:alog80740 and FRS 37456). We haven't run the repeated scans with ZM5 like LLO did with their OMA2, but we looked for other times recently when the ZM5 PSAM showed weird behavior and found a time earlier that day during one the the OMC scans; see the second ndscope. It's possible that when this happened to Eric and I on Friday, the strain gauge would have fixed itself after a few seconds like in LLO's case, but the integrators in the servo kept the voltage railed.
LLO's solution for this was to fully swap out the optic and its attached PZT/strain gauge assembly, so while we think about this, we are assessing what spares exist that could potentially be swapped in.
ome information about these data:
The first attachment shows the beam parameters measured on SQZT7 propagated to the AR side of SRM (after reflecting off SRM), this can be compared to the second attachment to 90345. These results are different from what we had back in May while the chamber was under vacuum and before our realignment.
THe next two plots show the measured OMC scans, with the same data as plotted above. In the scans with ZM5 strain gauge at -4.5V the 4th order mode is large, so I've also identified it for those scans where it is above 0.005 mA.I'm estimating the mismatch as ( mean height of 2nd order + mean height of 4th order)/(sum of mean heights of 0, 1, 2, 4 orders) in the legend in this second plot, which makes the mode mismatch worse for the ZM5 -4.5 V plots than what is listed above.
The last attachment is an attempt to summarize this data. The bottom two panels show the same data as in the stem plot. The the left panel shows the M^2 value as a function of strain gauge, this does seem to have a dependence on ZM5, which visually looks correlated with the values for which the propagation model is underestimating the mode mismatch for ZM5. Eric will add some thughts about M^2 and the OMC scans. The top right panel shows the overlap between the vertical and horizontal measured qs. Our worst astigmatisms are in the same region of psams settings as the best mode matchings. If this is 1%, and the overlap in one direction is perfect the overall mode matching would be 100*(1-sqrt(1*0.99))=0.5%.
During this PSAMS strangeness, at two times when the ZM5 strain gauge was reading -2V, the applied PSAMS voltage was 88V and 184V, see attached. This seems to be too big of a difference in applied voltage to be only caused by hysteritis. We are not the sure -2V strain gauge reading while there was 184V applied is reliable. This happened twice, the second time the strain gauge read -2.7 while the applied voltage was 194V, attached.
We then did some ramps: 0-200V over 30s, 200V to 0V over 50s and then 0V to 100V over 50s. In each of these ramps, the ZM5 PSAMS strain gauge seemed to behavior strangely, sometimes in the center of the range. See attached
Ibrahim, Oli
Today we re-centered M2 BOSEMs and M3 AOSEMs following BBSS alignment work.
These were centered with OpticAlign Offsets of P = 107, Y = 441. These are thought to be a "good" alignment.
We also replaced AOSEM 771, which had bad counts (14k OLG) with AOSEM 770 (high counts at 25.5k - at open light 22.2k - the OLG would change in-chamber depending on whether it's backed out or in my hand).
Then, we also re-attached the LL AOSEM - see picture of cabling - we will likely redo all cabling.
The replaced OSEM was UL
Below is the analysis for data taken on the FC path: between ZM1 and ZM2 and between ZM2 and ZM3, with Nanoscan, see Camilla's log 90573. As a reminder, ZM1 are flat optics, ZM2 is a PSAM with variable curvature, FC1 HR side is flat, AR side is curved with RoC ~1m.
The data suggest that the OPO mode is slightly different from O4 OPO, and also strongly suggest a new optimal ZM2 PSAM voltage can be found within the range.
We measured the beam profile at 5 different points after ZM1 with A:L2 lens at its nominal 0 position (sled that the lens lives on is flush to its translation stage on both front and back edges). At the last point with A:L2 at 0, we realized it would be pertinent to measure beam profiles for the two extremities of the A:L2 translation stage: -13 mm, which is closer to ZM1 by 13 mm and +17 mm, which is 17 mm further from ZM1. We then proceeded to take 5 measurements (again downstream from ZM1) for each of these lens positions. The nanoscan screenshots for each measurement are attached in the .zip folder.
The attached gif shows the beam waist position estimation extracted from the beam profile scans downstream ZM1, for all three A:L2 positions. The "target" and "O4 x/y" come from Keita's log 59515. The overlap plot attached shows the field overlap in percentage for all three A:L2 positions, with target and O4 beam parameters. With A:L2@0, the overlaps are above 99%, which bodes well for the FC mode matching prospects. There could potentially be a better mode matching solution to the "target" or "O4" for A:L2 between 0 pos and -13mm pos. However, the following measurements betwen ZM2 and ZM3 suggest fine-tuning of A:L2 position will not be necessary.
We also measured beam profile between ZM2 and ZM3 for three different points, setting ZM2 PSAM voltage to 4 different values at each point. The "nominal" O4 strain gauge (S.G.) for ZM2 has been 3.15 V, which corresponds to ~ 60 or 90 V pzt supply voltage depending on which direction one scans from. The edges of the psam range are 0 V and 196 V, which corresponds to ~1.2-1.3 V and ~6.04 V S.G. respectively. In the interest of more uniform sampling of the available psam curvatures, we also chose to sample 4.5 V S.G. (~120 V or 150 V).
This table shows experimental data mapped to radii of curvature of the ZM2 mirror, using Camille's E2100298. The exact PZT strain gauge/ PZT supply voltage that gives a certain RoC is affected by the hysteresis curve i.e. sweep direction.
| Strain Gauge (V) | PZT Supply Voltage (V) | RoC (m) with increasing scan | RoC (m) with decreasing scan |
| 1.3 V | 0 | 0.8211 | 0.82202 |
| 6.0x V | 196 | 0.8911 | 0.89114 |
| 3.1x V | 60 (d) or 90 (i) V | 0.8523 | 0.85025 |
| 4.4x V | 120 or 150 V | 0.87534 | 0.87242 |
Attached gif for propagation between FC1 and ZM2 show esimated beam parameters for all four SG cases: 1.3, 3.1x, 4.4x and 6.0x V. The exact values for the strain gauge varied from one beam profile position to the next, however it should be good enough to tell if we have enough range on ZM2 or not.
The gif switches between different SG values once every 2 second, the lefthand plot is useful in looking at the beam divergence near FC1 while the righthand plot is a zoom-in around the beam waist. Looking at the estimated beam waist position for 1.3 V and 3.1x V cases switching across the "FC x/y waist", "VOPO target waist", ''O4 x/y waist", we can guess there could be a better mode matching solution between these two SG values. "FC x/y waist" comes from the Finesse eigenmode solution for the FC path (thanks Kevin Kuns!), target and O4 values are the same from the above-mentioned Keita log, assuming ZM2 curvature to be 0.85025 m (3.15V SG), and the following distances between the optics: A:M3 --> ZM1: 158.2 mm, ZM1--> ZM2: 1498.625 mm, ZM2 --> ZM3: 1821.497 mm, ZM3--> FC1: 1000.261 mm. Camilla extracted these distance values from D1900365-v1.
Knowing the applied PZT voltage and the corresponding RoC, we can use the measurements at 3.1x V and 1.3 V to estimate the mode matching we would obtain if we swept the RoC between that of these strain gauge values. The attached FC mode matching projection plot is computed by taking beam parameter estimated from the beam size measurements for 3.1x V, propagates the beam back to ZM2, unapplies the estimated RoC (decreasing RoC value was used informed by data, indicated in bold in the above table), then reapplies the RoC between these two values, after the overlap with the FC eigenmode is calculated. This projection suggests that mode-matching points with >99% overlap for both x and y axes are accessible. Clearly, there is varying astigmatism with strain gauge setting, see beam profile plots where 3.1x and 6.0x V shows beams with smaller astig. than the other two points. Since the PSAM characterization data gives only a single RoC number rather than separate x/y effective curvatures, the projection should be interpreted as approximate. In practice, the final optimization should be done empirically.
The effect of the astigmatism is also apparent in this defocus vs beam size at FC1 plot that shows mode matching contours. The calculation is made at the FC1.p2.o plane in Finesse.
The beam width data kindly tabulated by Camilla, the R(V) data from Camille's dcc E2100298, and the analysis code .py are attached, in the .zip. Fair warning, the analysis code also makes a bunch of plots I find useful to look at but another user may find irritating :)
Code for the data points upstream of ZM2 attached. The measured beam widths and their corresponding position are listed in the script. The real raw data with the screenshots from the beam profiler UI is attached to the main log.
I wanted to try to get an idea of what sort of astigmatism we're seeing on the FC path. I was able to get good fits of Begum's data right after ZM1. This indicates that the astigmatism coming right off of the VIP looks quite good ( 99.9 +/- 0.1% overlap between X and Y). Plots of the fits are attached for each lens position.
I wasn't able to get particularly convincing fits of the data after ZM2. The points are several Rayliegh ranges away from the waist and I found that the fits were quite sensitive. I could get answers anywhere between 98%-100% mode overlap between X and Y depending on what parameters I used in a la mode for the seed waist. Someone might be able to do a more sophistocated fit of the data, but I think one would want to measure closer to the waist to better constrain the fit and get a more precise estimate of the astigmatism added by ZM2.
I've been reading through the design document about the FC path and ZM2. One thing imay be important to note when making projections about the correct strain gauge setting for ZM2: According to the design document the mode matching is quite sensitive to the exact value of the FC1 AR surface ROC. One might find that, if we change our assumption about the ROC for S2 of FC1, our target strain gauge setting for ZM2 changes significantly. In fact, the discussion makes it sound like most of the point of having ZM2 be adjustable was to compensate for our uncertainty in the ROC of S2 for FC1.
See LIGO-T1900649 and the discussion on Page 18 as well as Figure 10.
A note on the FC1 ROC sensitivity question: a scalar FC1 ROC sweep alone would be only partially informative, because the projection also depends on the FC-path distances and the voltage-dependent x/y astigmatism of ZM2 (see plots for the mode space and projected overlap with eigenmode from the original log). This is why the original log interpreted the projection as approximate and stated that the final optimization should be done empirically.
The more meaningful check right now is therefore a return-beam measurement between ZM1 and ZM2 while stepping the ZM2 strain-gauge setting. This can be done by placing a beam splitter between ZM1 and ZM2 and matching the return beam to the input beam by varying ZM2 curvature.
The modeling exercise could be a nice little real life vs model analysis later on.