-Brice, Sheila, Camilla
We are looking to see if there are any aux channels that are affected by certain types of locklosses. Understanding if a threshold is reached in the last few seconds prior to a lockloss can help determine the type of lockloss, which channels are affected more than others, as well as
We have gathered a list of lockloss times (using https://ldas-jobs.ligo-wa.caltech.edu/~lockloss/index.cgi) with:
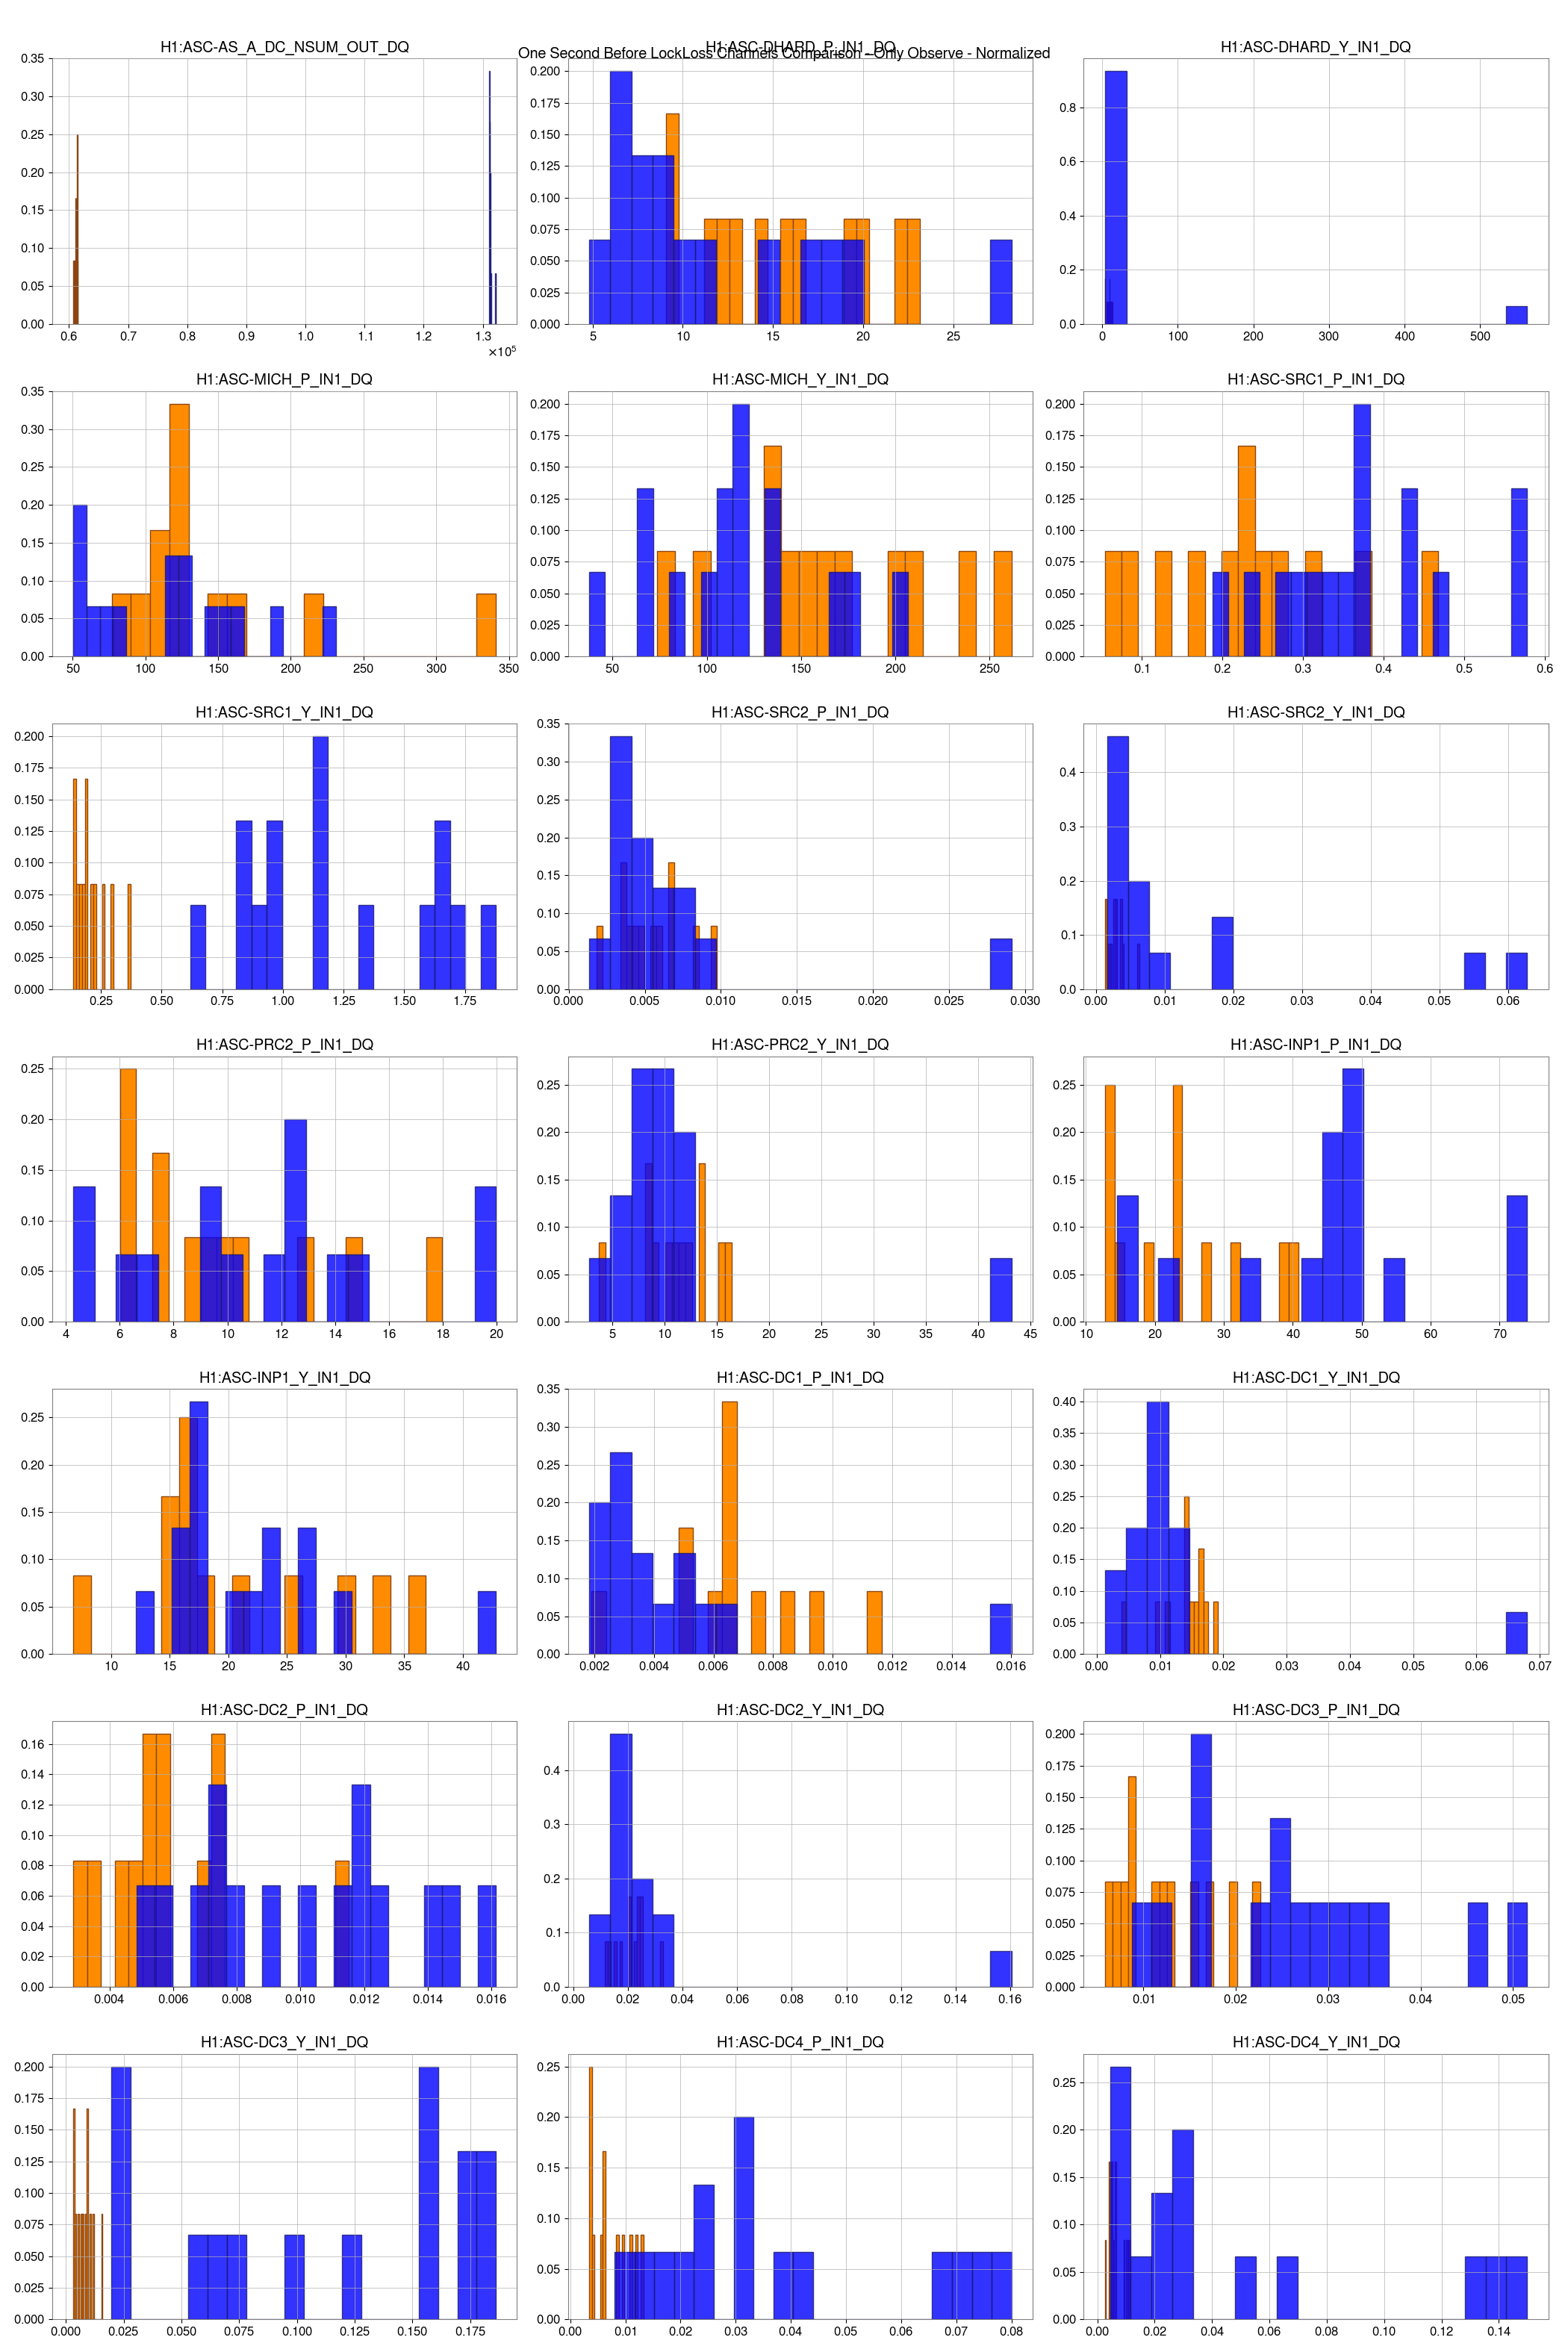
- only Observe and Refined tags (plots, histogram)
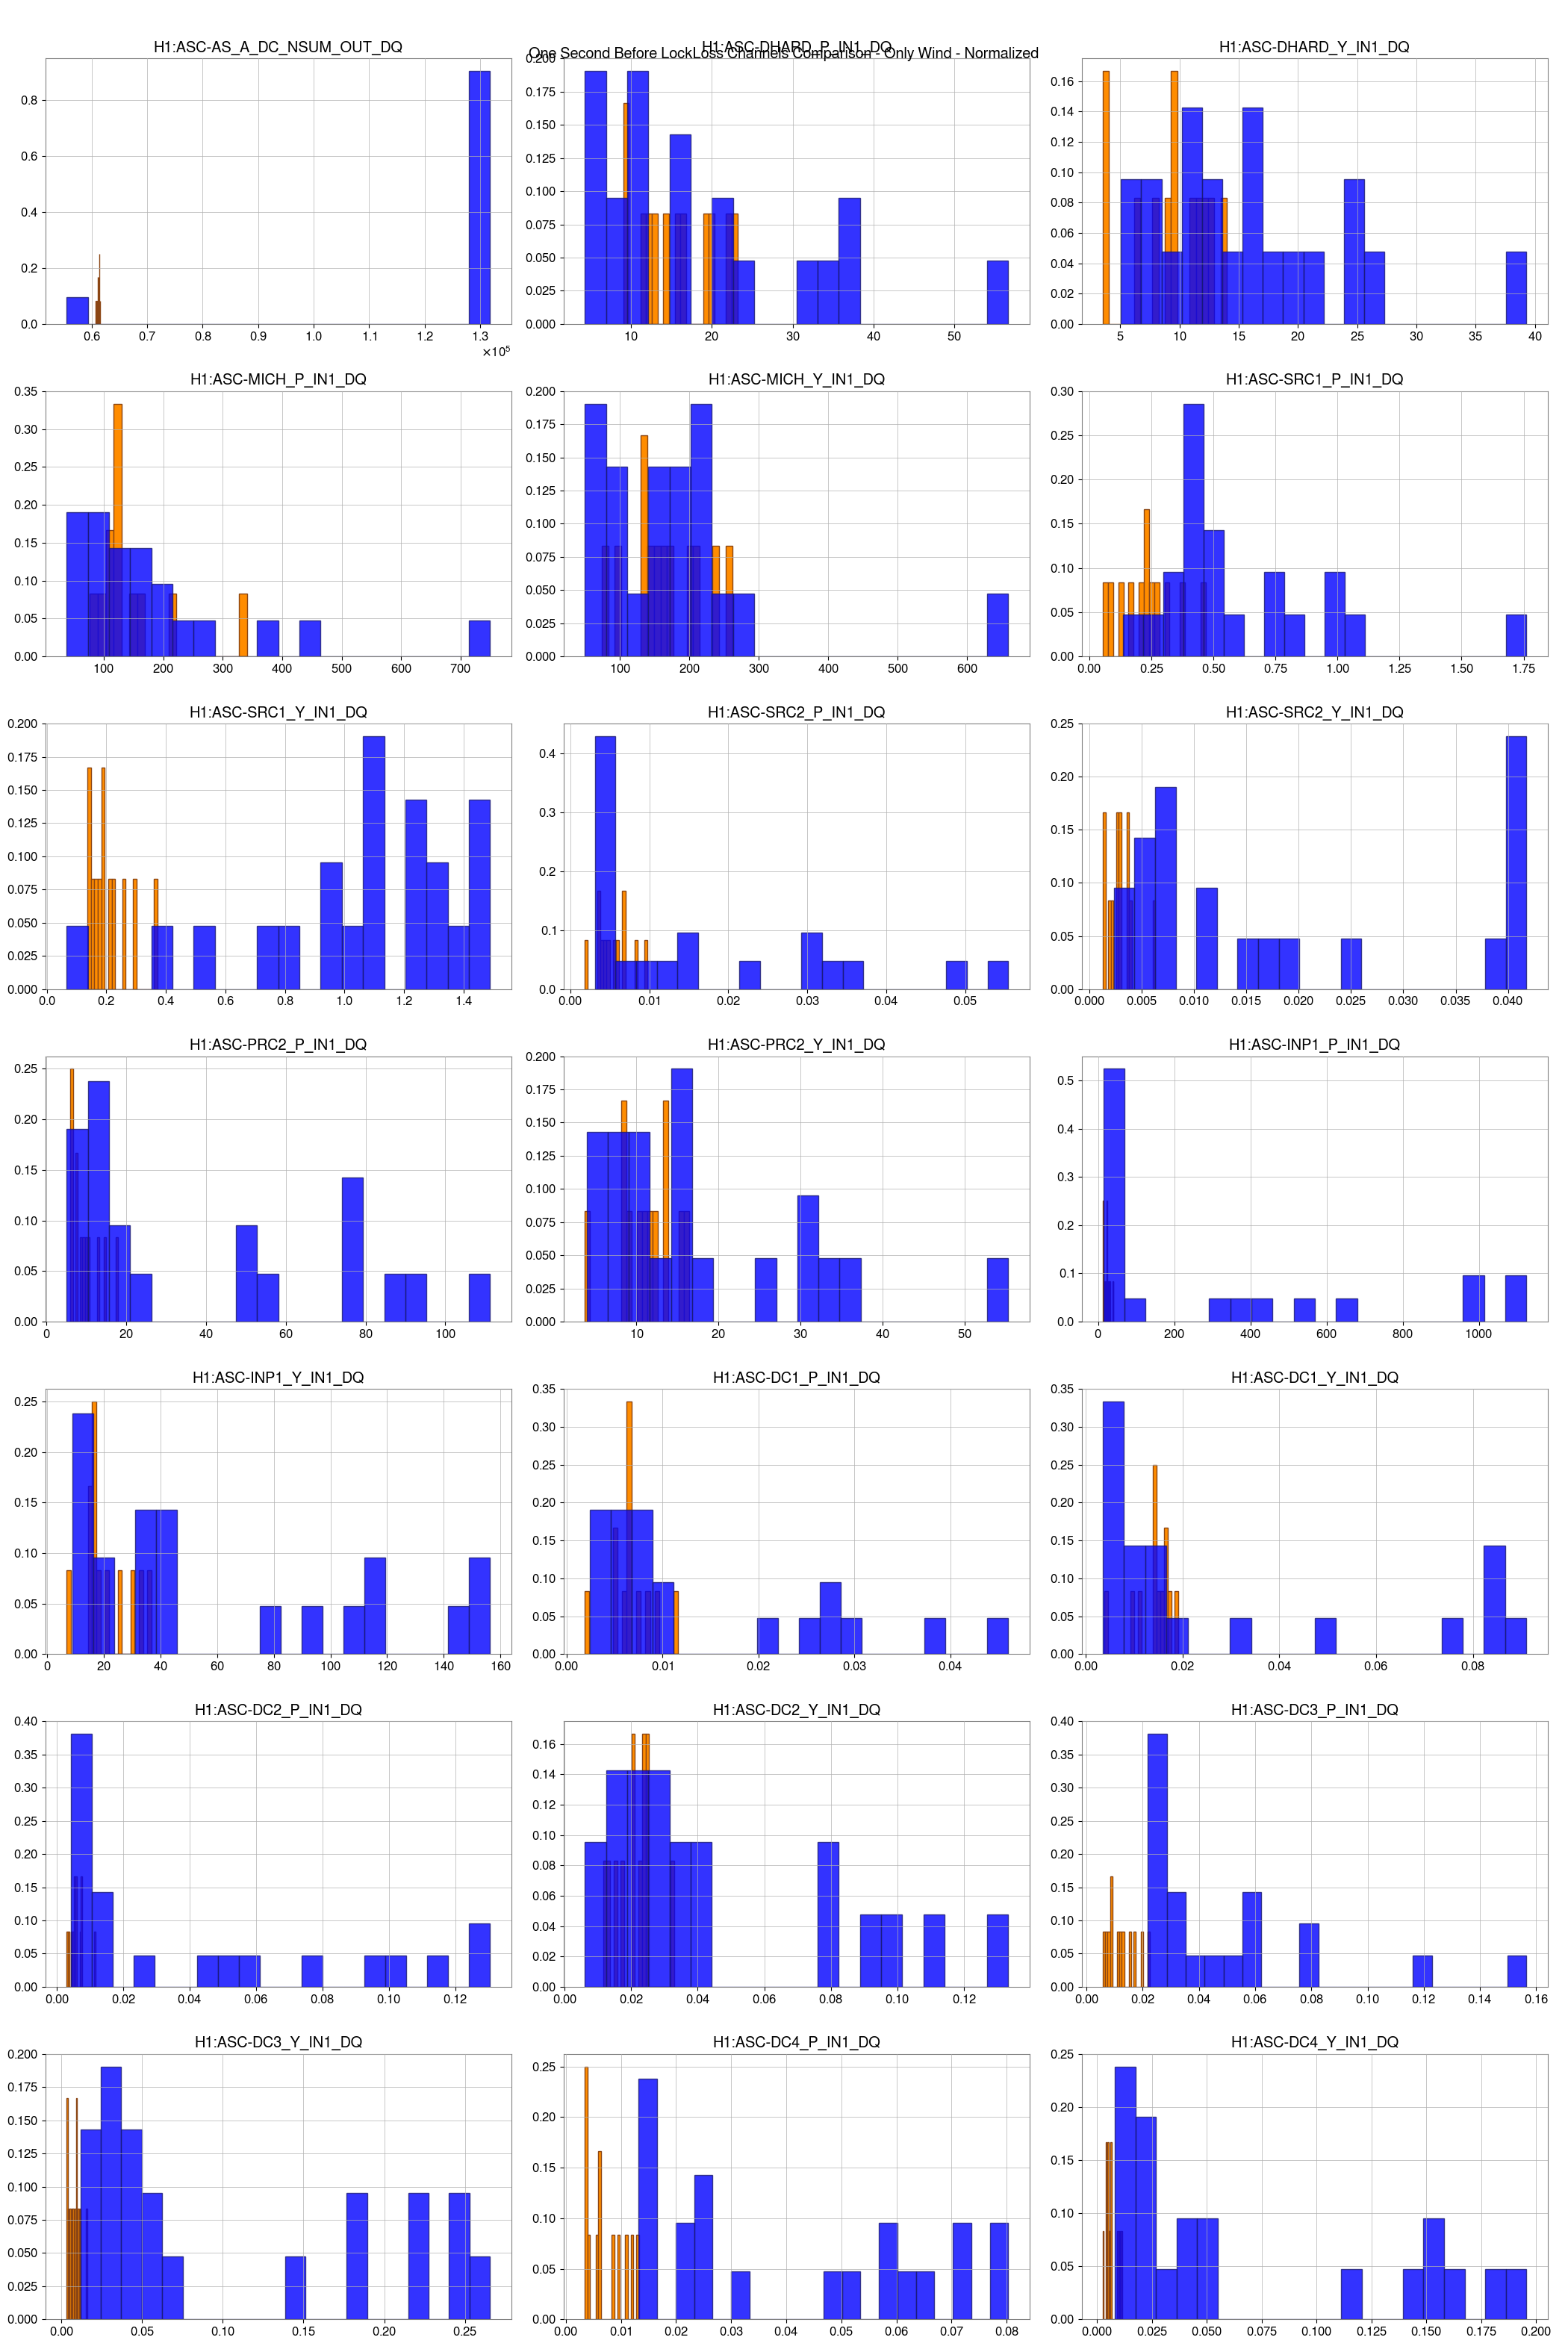
- only Observe, Refined, and Windy tags (plots, histogram)
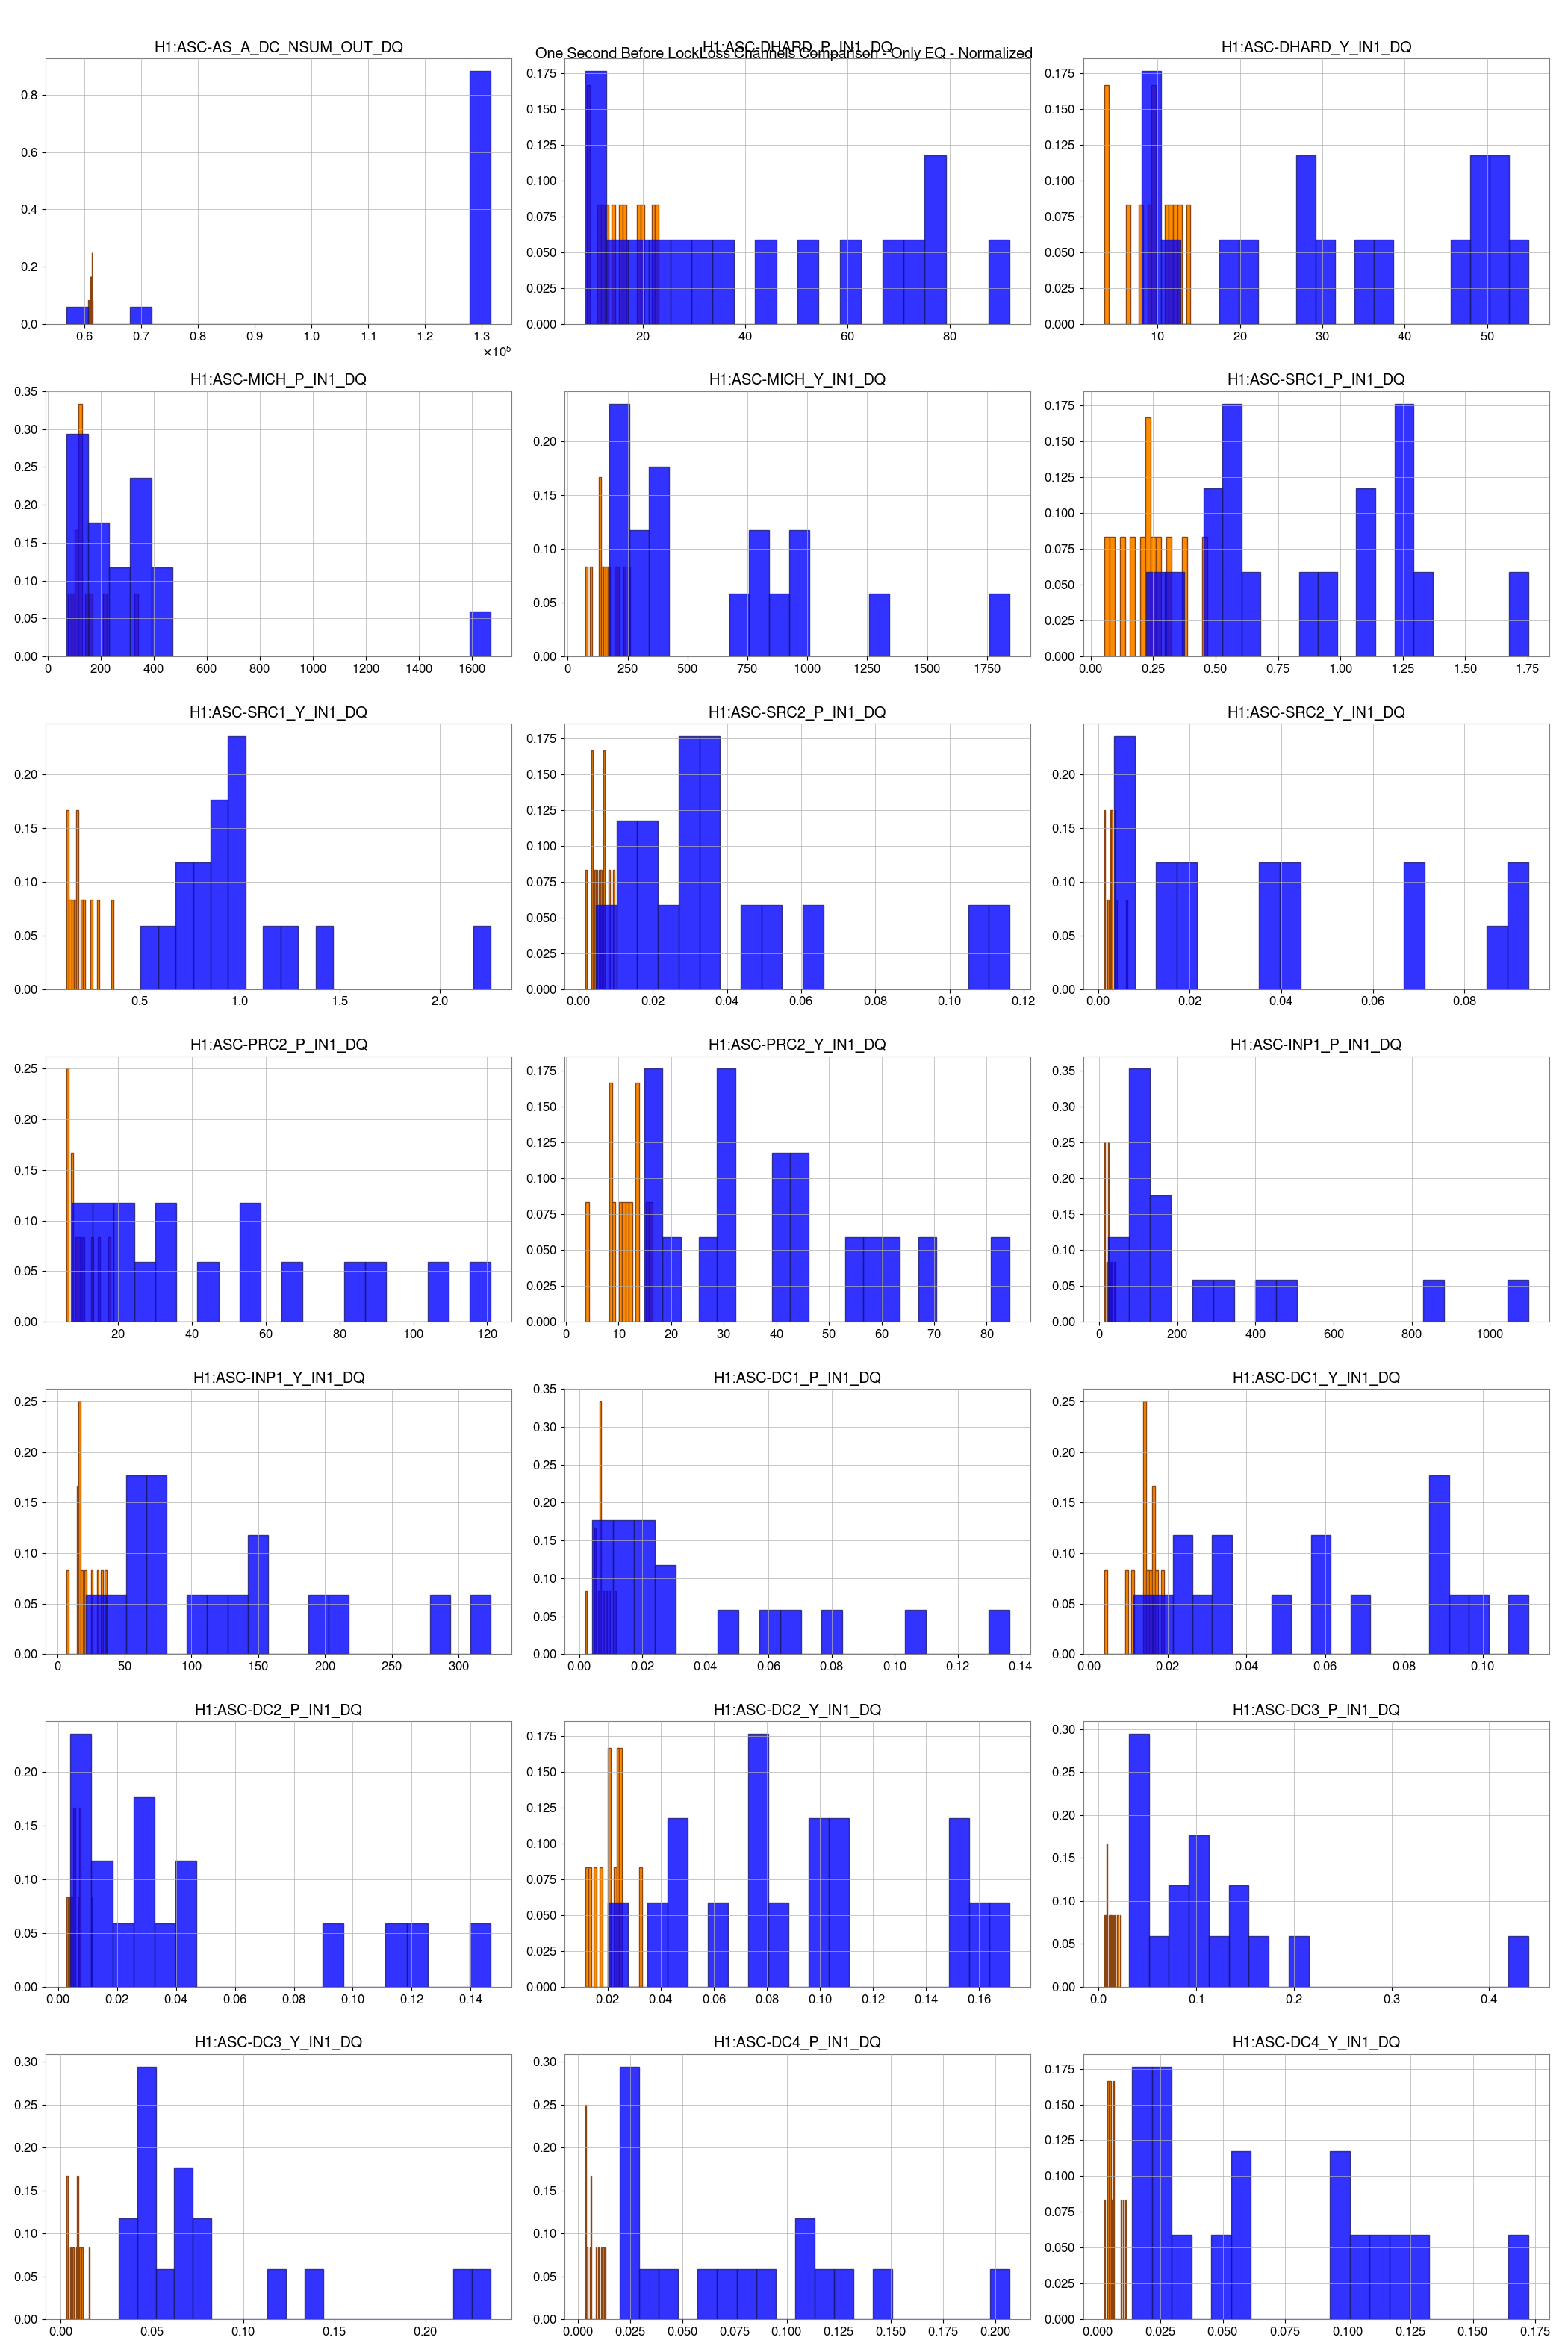
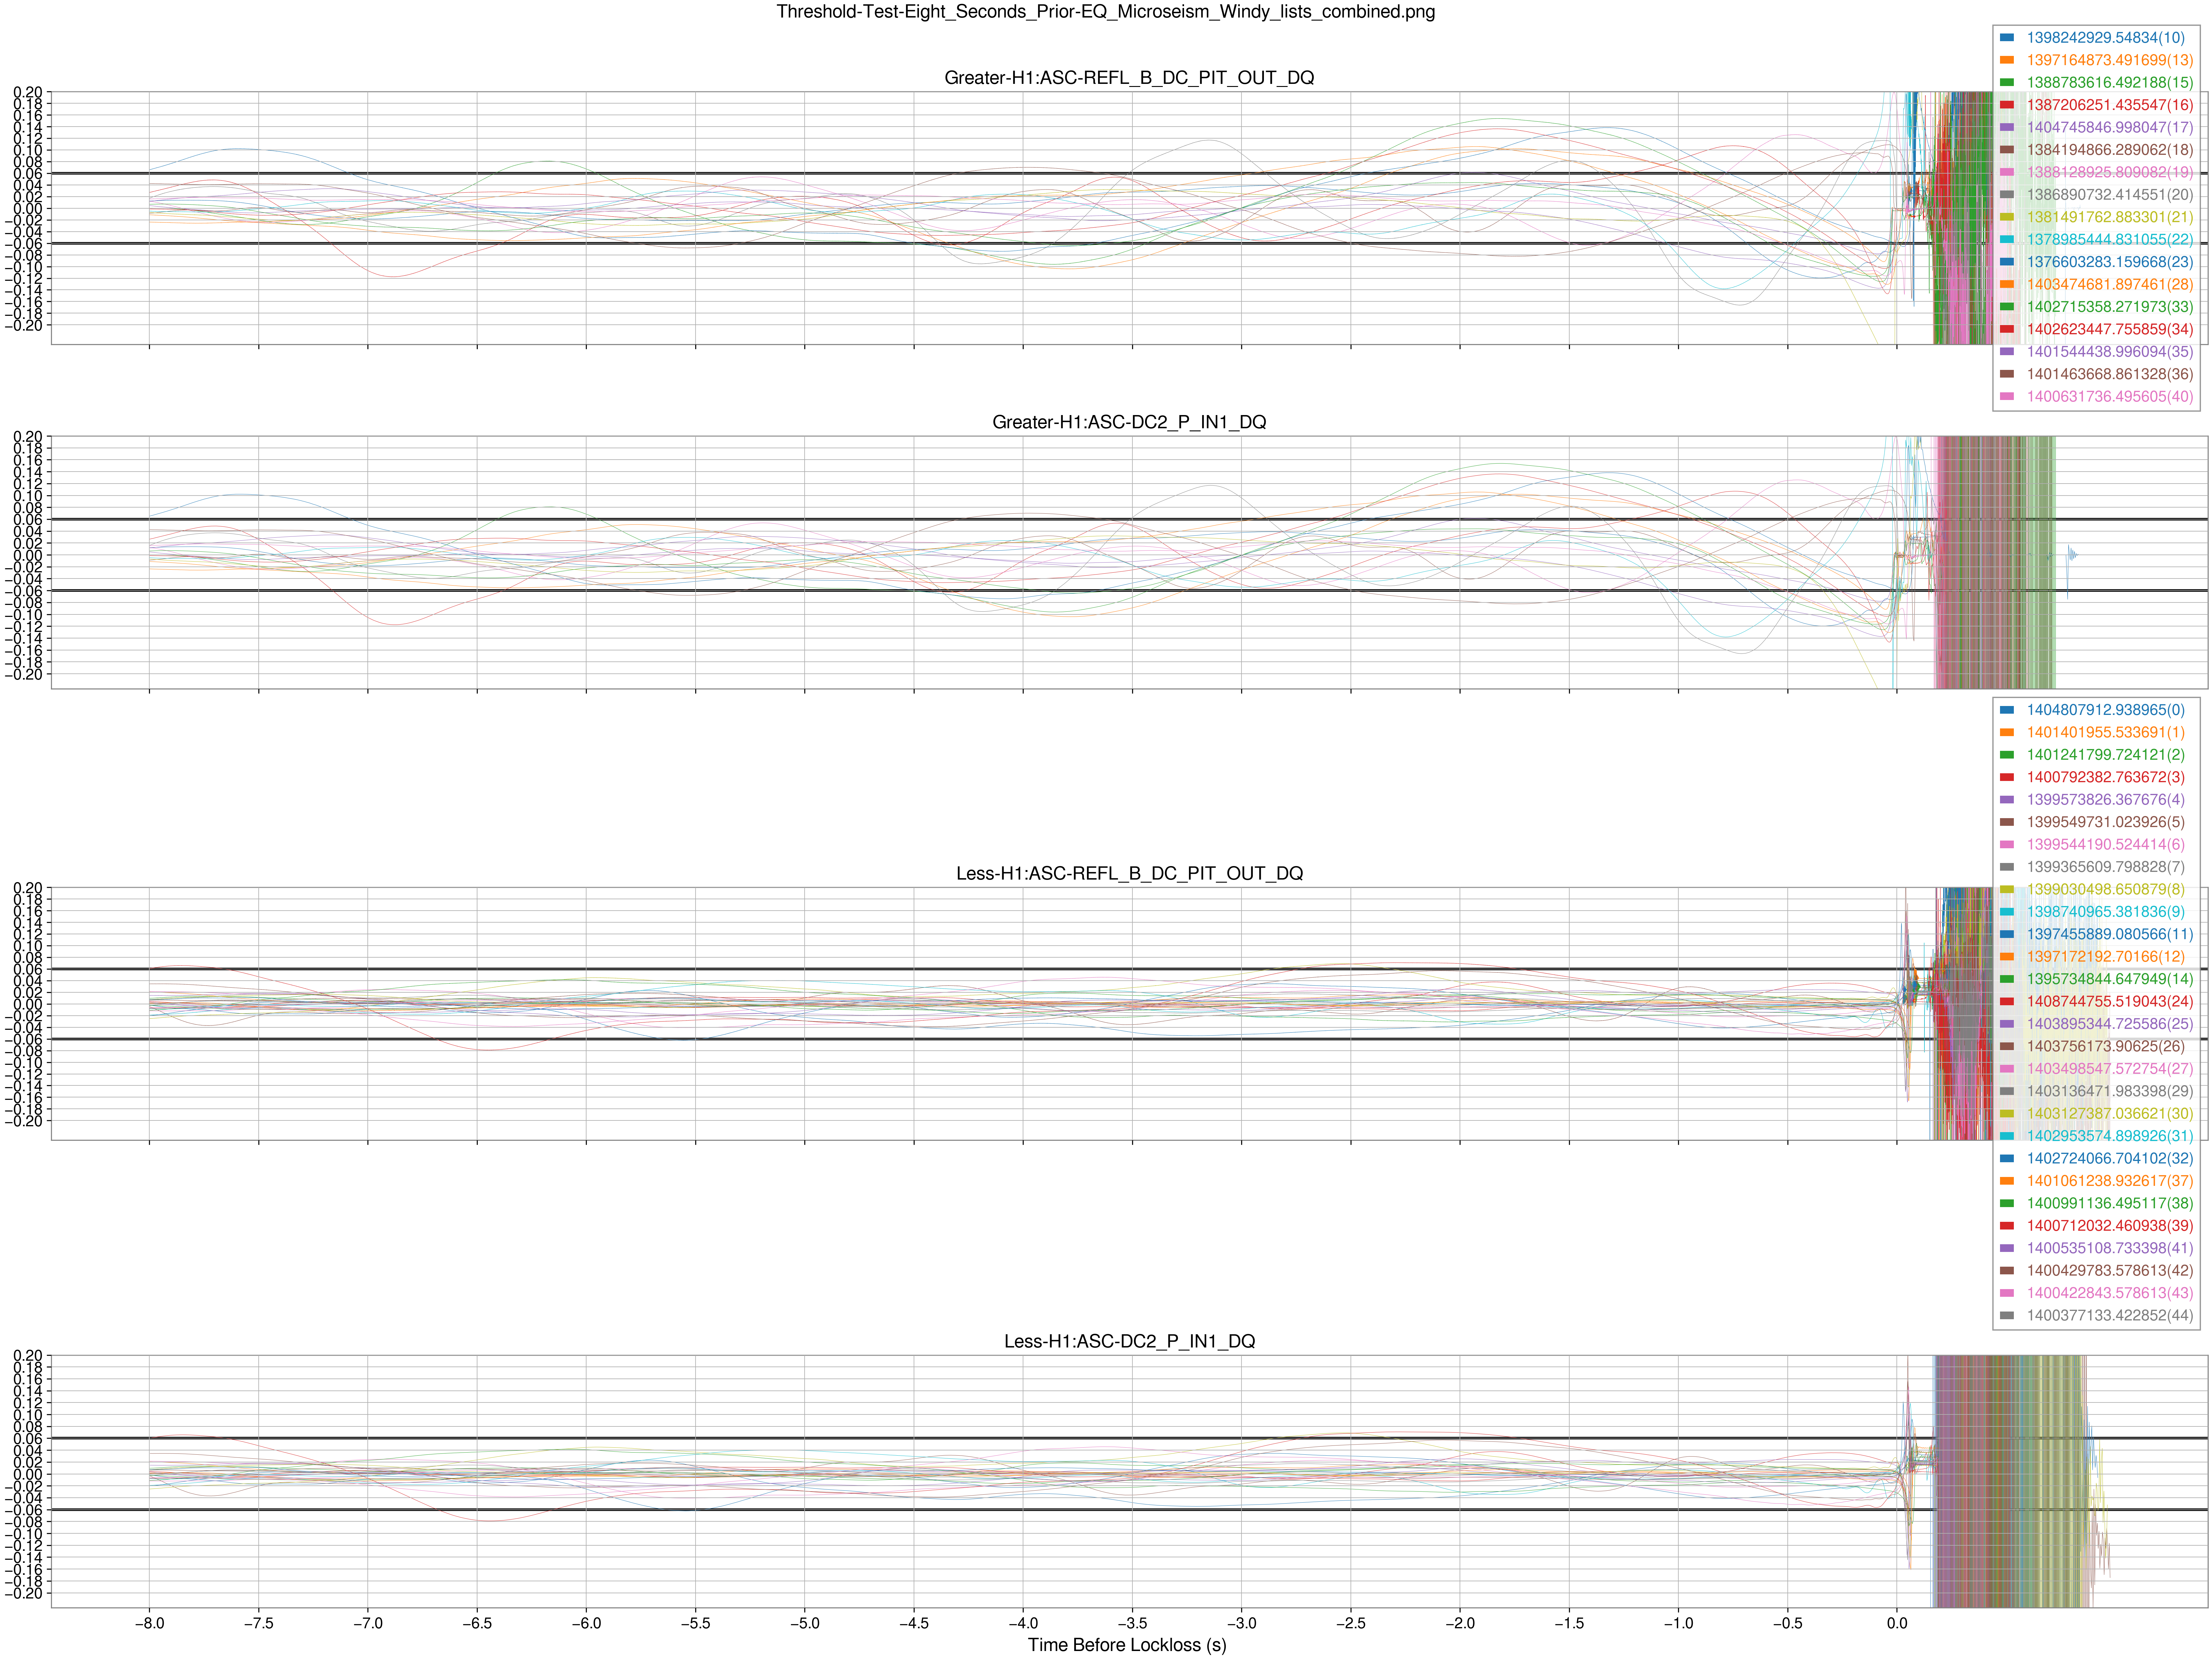
- only Observe, Refined, and Earthquake tags (plots, histogram)
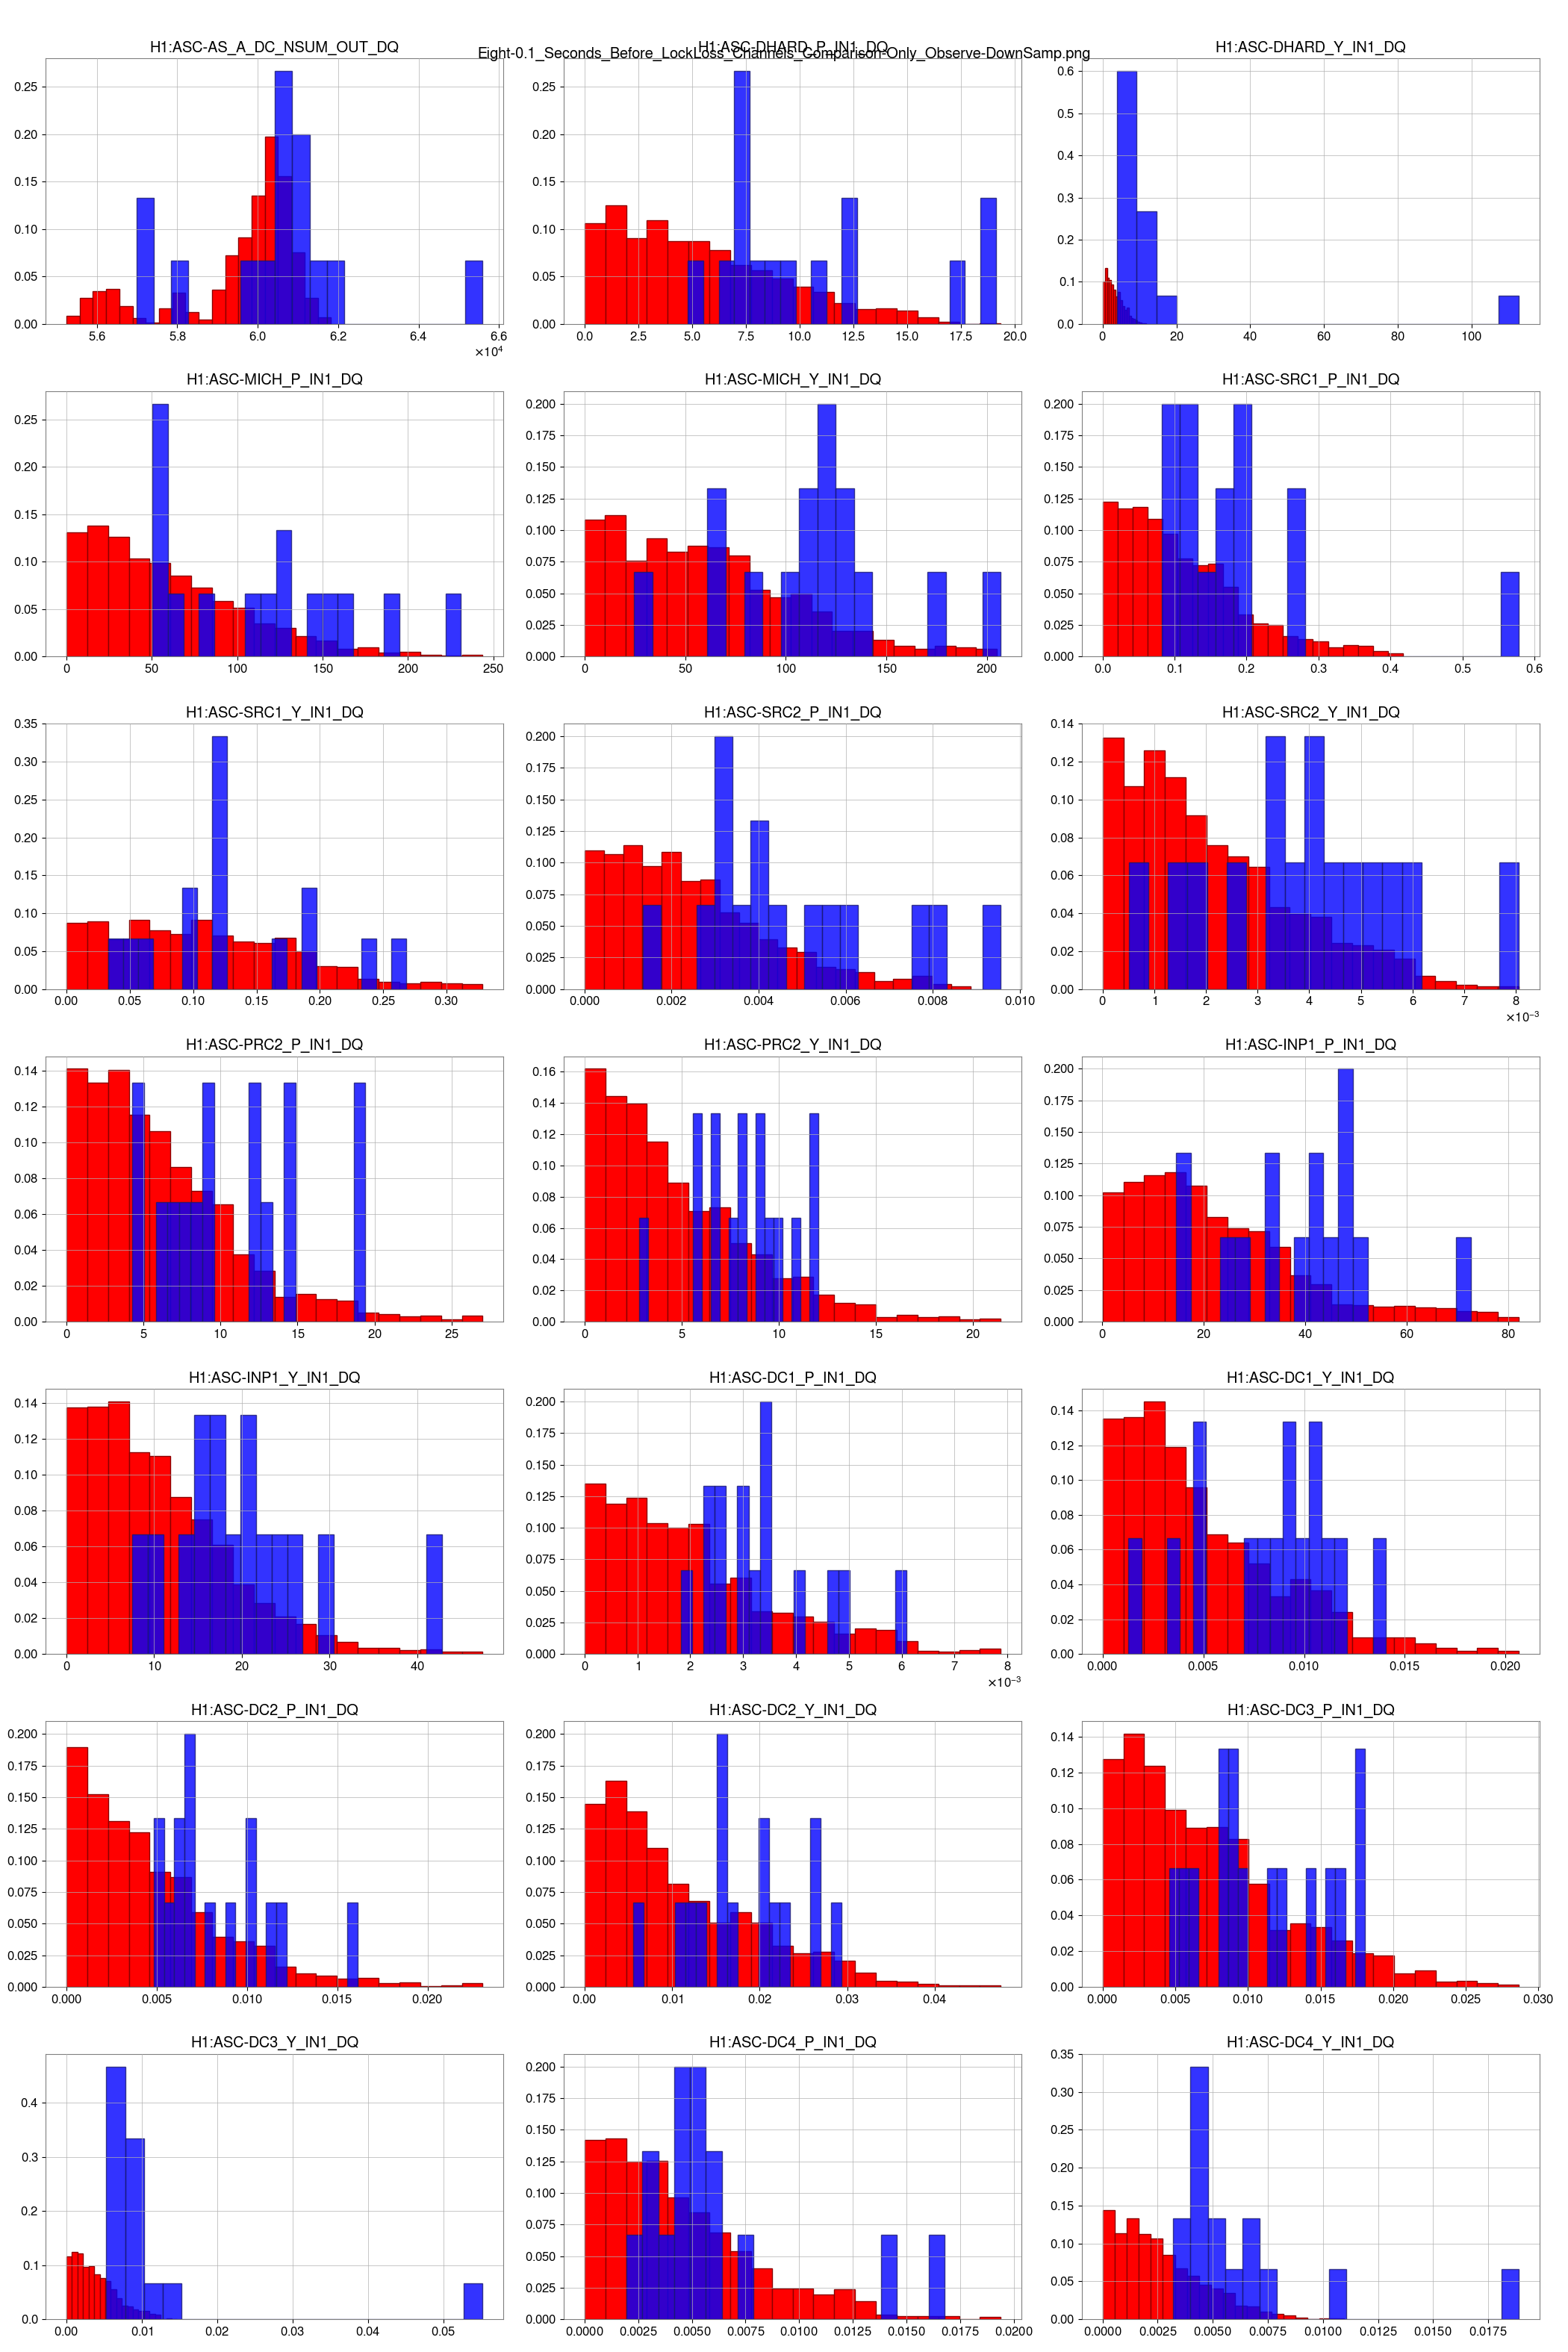
- Observe, Refined, and Microseism tags (note: all of these also have an EQ tag, and all but the last 2 have an anthropogenic tag) (plots, histogram)
(issue: the plots for the first 3 lockloss types wouldn't upload to this aLog. Created a dcc for them: G2401806)
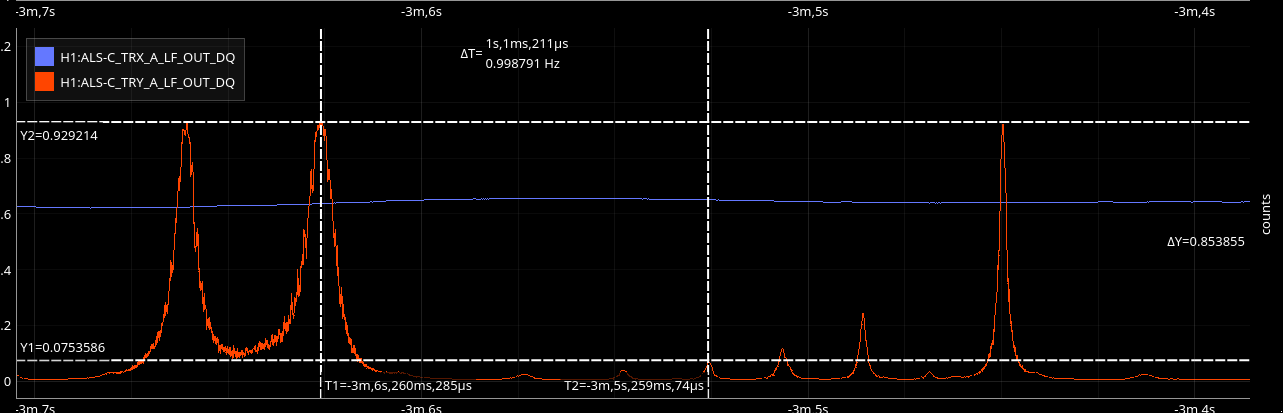
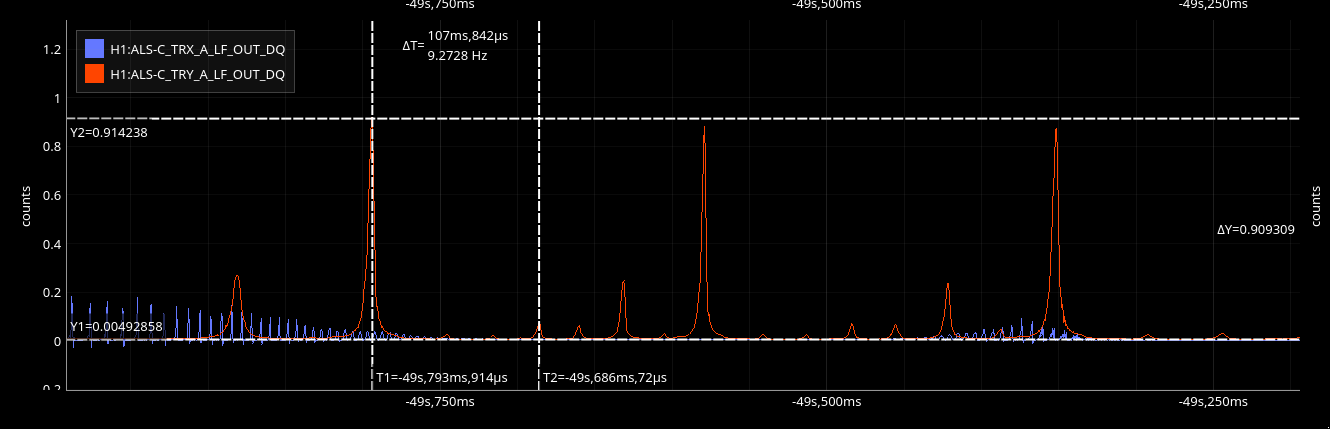
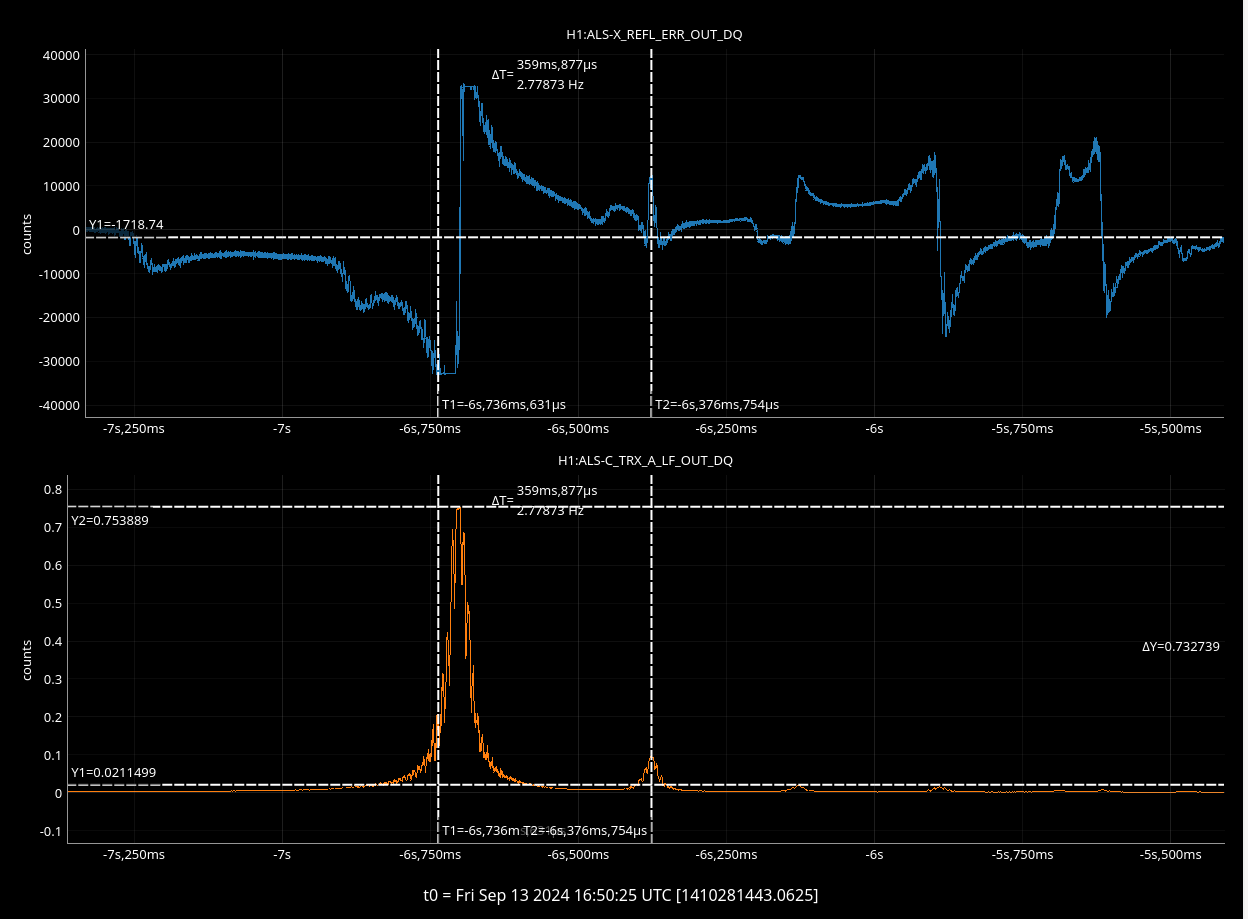
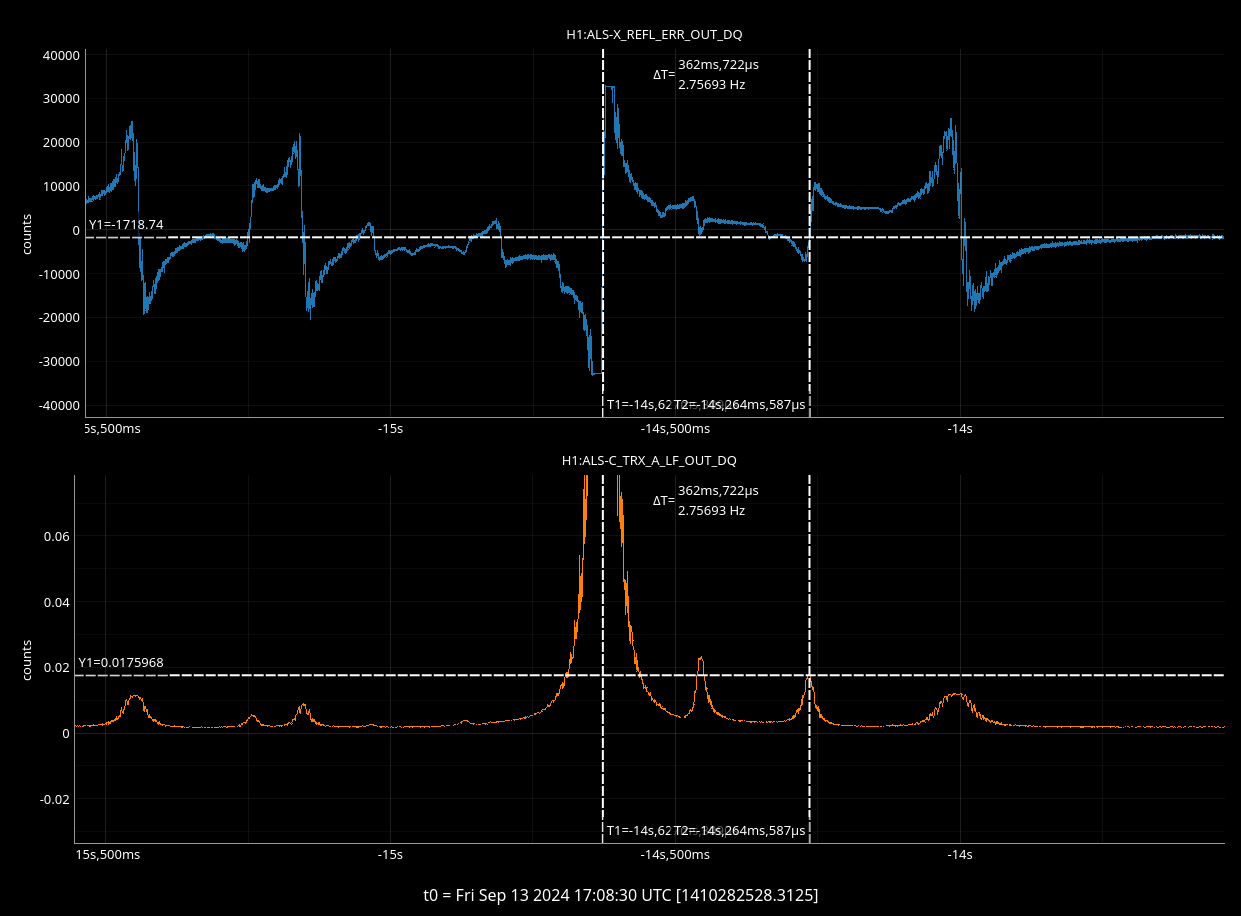
We wrote a python code to pull the data of various auxilliary channels 15 seconds before a lockloss. Graphs for each channel are created, a plot for each lockloss time are stacked on each of the graphs, and the graphs are saved to a png file. All the graphs have been shifted so that the time of lockloss is at t=0.
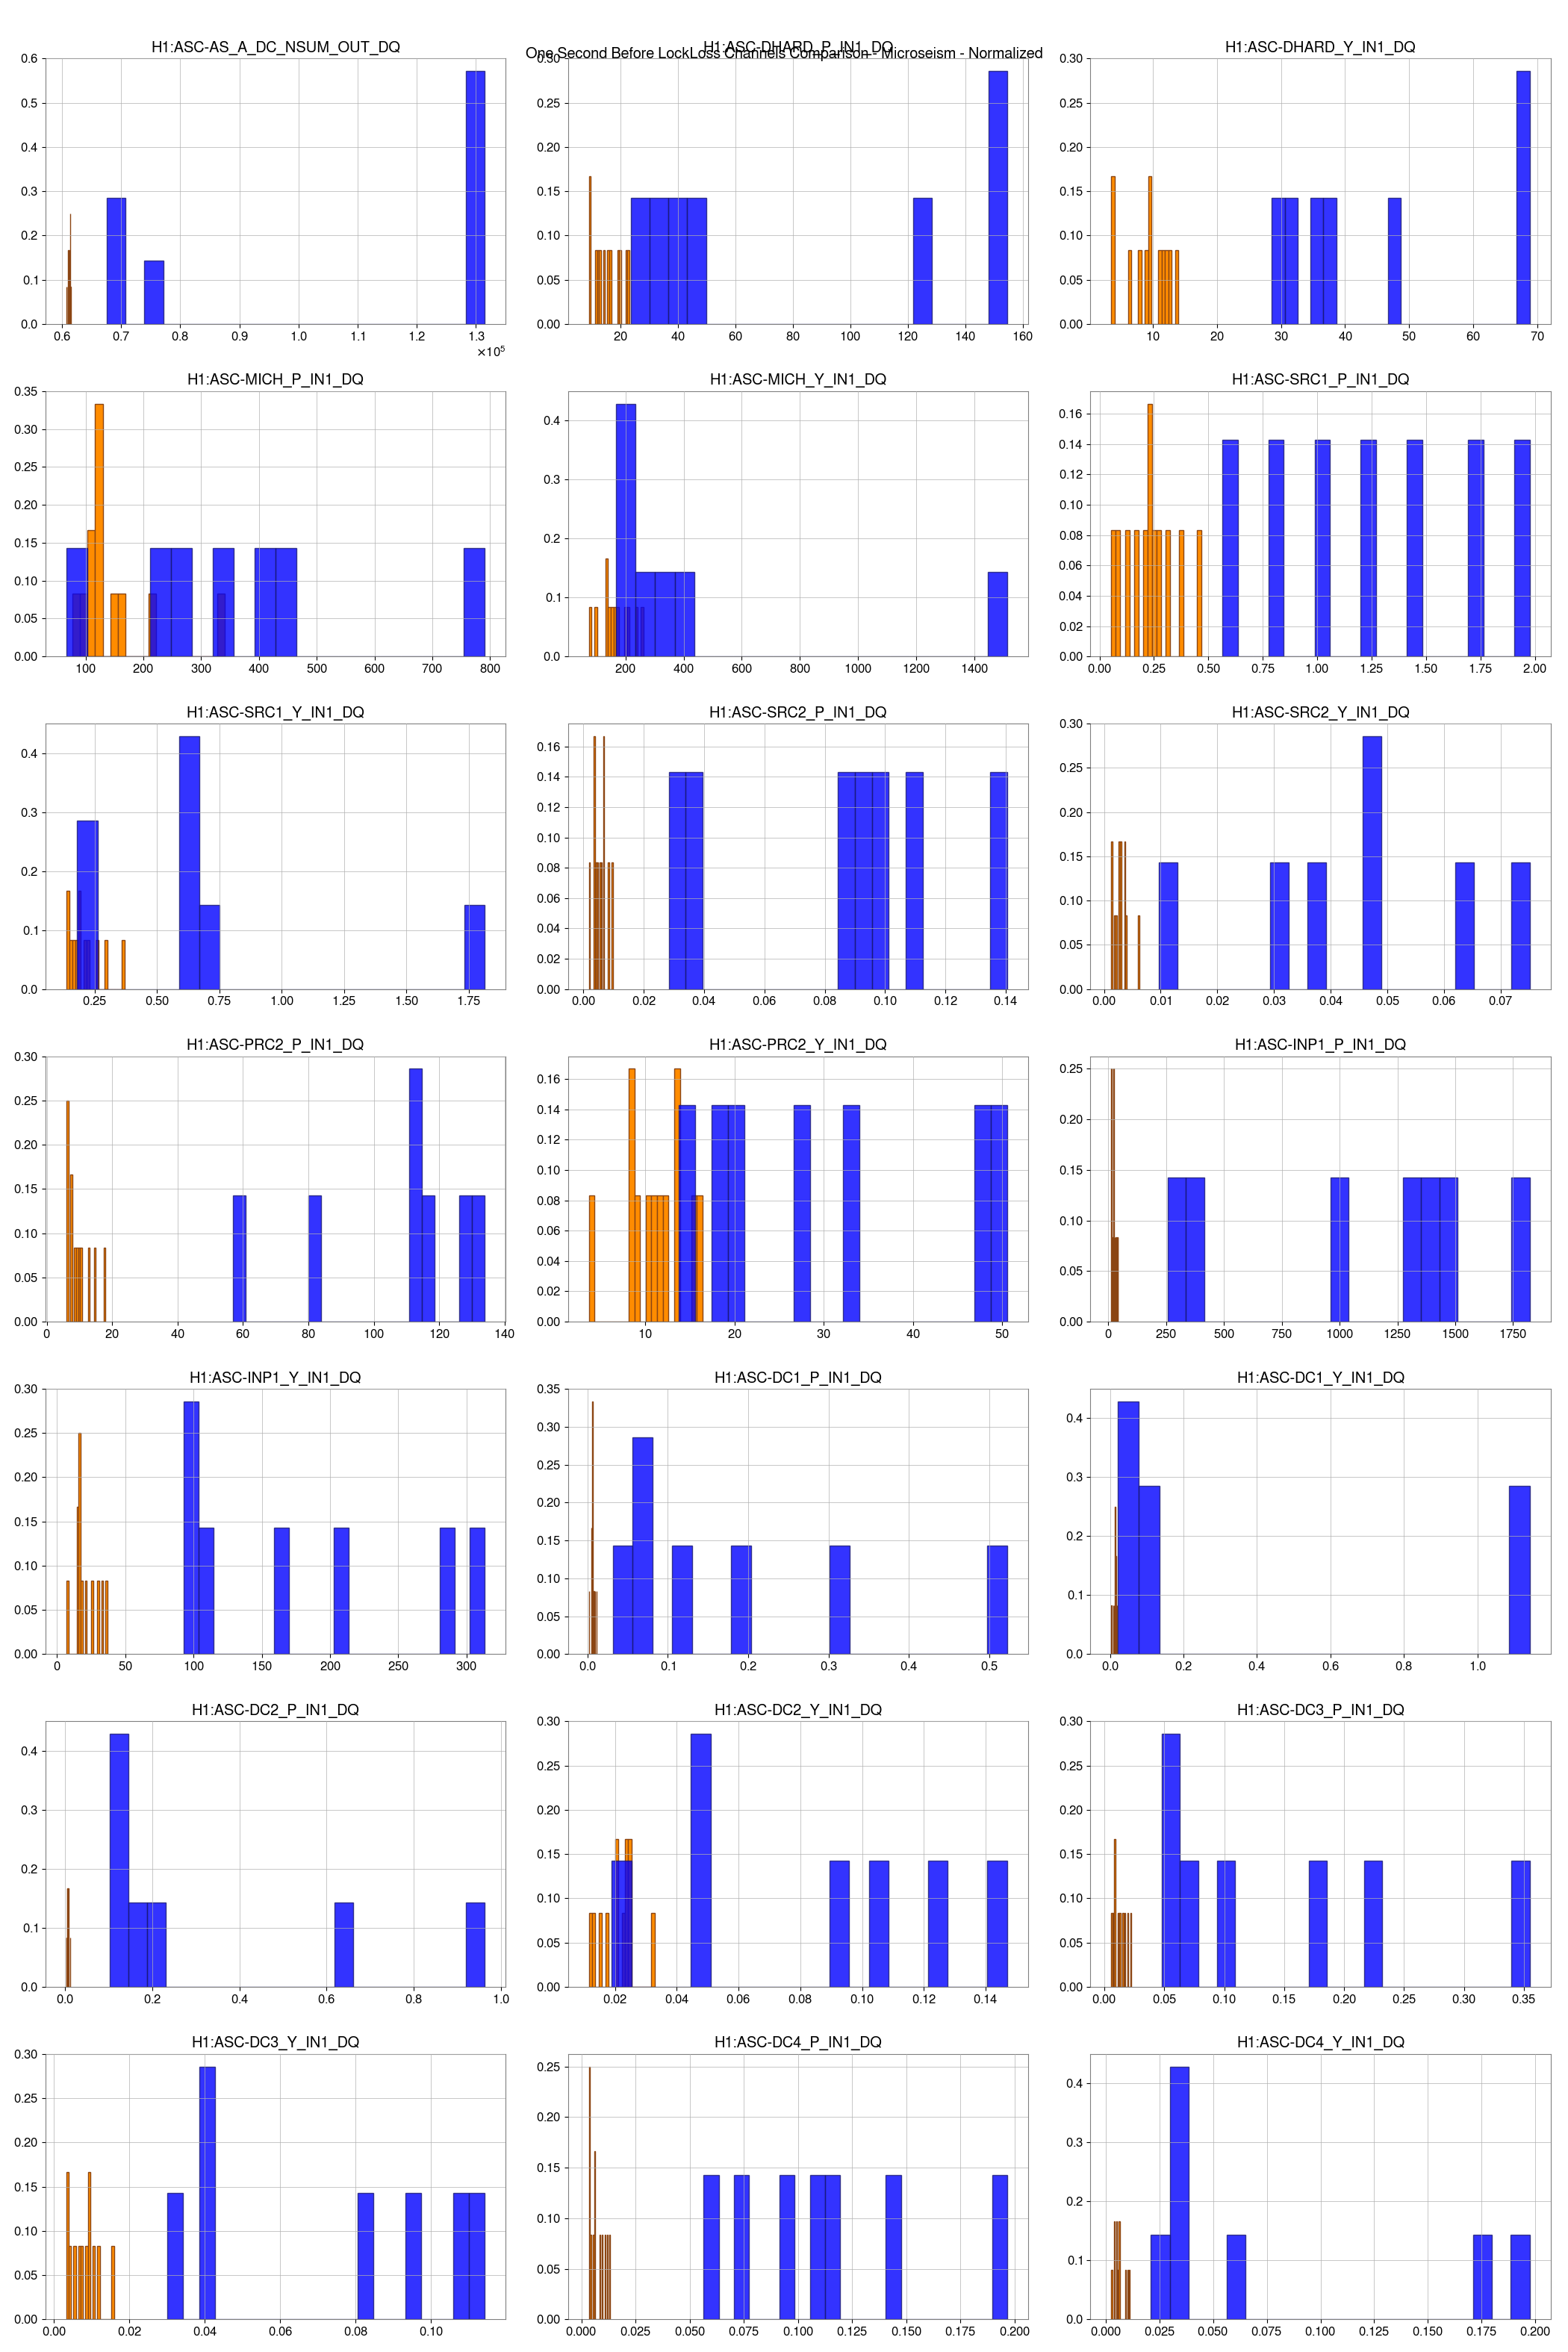
Histograms for each channel are created that compare the maximum displacement from zero for each lockloss time. There are also a stacked histogram based on 12 quiet microseism times (all taken from between 4.12.24 0900-0930 UTC). The histrograms are created using only the last second of data before lockloss, are normalized by dividing by the numbe rof lockloss times, and saved to a seperate pnd file from the plots.
These channels are provided via a list inside the python file and can be easily adjusted to fit a user's needs. We used the following channels:
channels = ['H1:ASC-AS_A_DC_NSUM_OUT_DQ','H1:ASC-DHARD_P_IN1_DQ','H1:ASC-DHARD_Y_IN1_DQ','H1:ASC-MICH_P_IN1_DQ', 'H1:ASC-MICH_Y_IN1_DQ','H1:ASC-SRC1_P_IN1_DQ','H1:ASC-SRC1_Y_IN1_DQ','H1:ASC-SRC2_P_IN1_DQ','H1:ASC-SRC2_Y_IN1_DQ', 'H1:ASC-PRC2_P_IN1_DQ','H1:ASC-PRC2_Y_IN1_DQ','H1:ASC-INP1_P_IN1_DQ','H1:ASC-INP1_Y_IN1_DQ','H1:ASC-DC1_P_IN1_DQ', 'H1:ASC-DC1_Y_IN1_DQ','H1:ASC-DC2_P_IN1_DQ','H1:ASC-DC2_Y_IN1_DQ','H1:ASC-DC3_P_IN1_DQ','H1:ASC-DC3_Y_IN1_DQ', 'H1:ASC-DC4_P_IN1_DQ','H1:ASC-DC4_Y_IN1_DQ']


