Verbals alarmed about a PI 28 Ring up at 14:59:33 UTC
Almost Immediately PI 29 started to ring up as well at 14:59:40 UTC
I watched the PI modes for 29 move and try to find the right damper settings but nothing happened with PI 28. PI 28 had a larger ring up than PI 29.
Verbals alarms announced DCPDs at 15:01:14 UTC
Saturations started at 15:01:08 UTC
We were unlocked by 15:01:20 UTC.
This was the fastest PI related lockloss I've encountered.
Lockloss
https://ldas-jobs.ligo-wa.caltech.edu/~lockloss/index.cgi?event=1409151698
TITLE: 08/31 Day Shift: 1430-2330 UTC (0730-1630 PST), all times posted in UTC
STATE of H1: Observing at 137Mpc
OUTGOING OPERATOR: Oli
CURRENT ENVIRONMENT:
SEI_ENV state: CALM
Wind: 5mph Gusts, 4mph 5min avg
Primary useism: 0.01 μm/s
Secondary useism: 0.09 μm/s
QUICK SUMMARY:
IFO has been locked for 1 Hour and 33 minutes.
Looks like Oli Was up with the IFO last night.
NUC33 is having it's issue again. I'm going to reboot NUC 33 and when it comes up I'll remove the cameras from it and see if it works better with out the camera feeds.
NUC 33's clock read 00:00 when I hard rebooted it, Suggesting that it has been not working for close to 8 hours.
I have exited the camera feeds from the top of nuc 33.
Current time is 14:56 UTC ( 7:56 PST ) .
Yesterday it failed around 2 pm again so perhaps today it will last a bit longer than that today.
Had to help H1 Manager out because we were in NOMINAL_LOW_NOISE but the OPO was having trouble getting locked with the ISS. OPO trans was having trouble getting to 70 and so definitely couldn't reach its setpoint of 80uW. I changed the setpoint to 69 since it was maxing out around 69.5, and I changed the OPO temp and accepted it in sdf.
TITLE: 08/31 Eve Shift: 2300-0800 UTC (1600-0100 PST), all times posted in UTC
STATE of H1: Observing at 144Mpc
INCOMING OPERATOR: Oli
SHIFT SUMMARY: Very quiet evening. H1 relocked and started observing at 00:12 UTC; current lock stretch is almost at 5 hours.
LOG: No log for this shift.
TITLE: 08/30 Day Shift: 1430-2330 UTC (0730-1630 PST), all times posted in UTC
STATE of H1: Aligning
INCOMING OPERATOR: Ryan S
SHIFT SUMMARY:
15:40 UTC Fixed NUC33 issue alog https://alog.ligo-wa.caltech.edu/aLOG/index.php?callRep=79810
16:30 UTC Forklift started driving from the VPW to the Water tank.
16:40 UTC Forklift operation stopped
21:51 UTC Superevent Candidate S240830gn
After 16 Hours and 2 minutes we finally got a lockloss 22:32 UTC
https://ldas-jobs.ligo-wa.caltech.edu/~lockloss/index.cgi?event=1409092378
Ryan Cleared LSC Calibration filters
LVEA WAP turned on for PEM noise hunting
CER Fans shut off for Noise hunting.
LOG:
Start Time | System | Name | Location | Lazer_Haz | Task | Time End |
---|---|---|---|---|---|---|
23:58 | SAF | H1 | LHO | YES | LVEA is laser HAZARD | 18:24 |
14:39 | FAC | Karen | Optics Lab | No | Technical Cleaning | 15:04 |
16:24 | PEM | Robert, Sam, Carlos, Genivieve | Y-arm | N | Out Door Testing of CE PEM Equipment, Robert & Carlos back | 19:27 |
22:35 | PEM | Robert, Sam | CER | N | Noise tracking | 23:27 |
23:09 | VAC | Gerardo | HAM Shaq | N | Checking Vacuum system | 23:20 |
H1 back to observing at 00:12 UTC
Ansel Neunzert, Evan Goetz, Alan Knee, Tyra Collier, Autumn Marceau
Background
(1) We have seen some calibration line + violin mode mixing in previous observing runs. (T2100200)
(2) During the construction of the O4a lines list, it was identified (by eye) that a handful of lines correspond to intermodulation products of violin modes with permanent calibration lines. (T2400204) It was possible to identify this because the lines appeared in noticeable quadruplets with spacings identical to those of the low-frequency permanent calibration lines.
(3) In July/August 2023, six temporary calibration lines were turned on for a two-week test. We found that this created many additional low-frequency lines, which were intermodulation products of the temporary lines with each other and with permanent calibration lines. As a result, the temporary lines were turned off. (71964)
(4) It’s been previously observed that rung-up violin modes correlate with widespread line contamination nearby the violin modes, to an extent that has not been seen in previous observing runs. The causes are not understood. (71501, 79579)
(5) We’ve been developing code which groups lines by similarities in their time evolution. (code location) This allows us to more quickly find groups of lines that may be related, even when they do not form evenly-spaced combs.
Starting point: clustering observations
All lines on the O4a lists (including unvetted lines, for which we have no current explanations) were clustered according to their O4a histories. The full results can be found here This discussion focuses on two exceptional clusters in the results. The clusters are given here by their IDs (433 and 415, arbitrary tags).
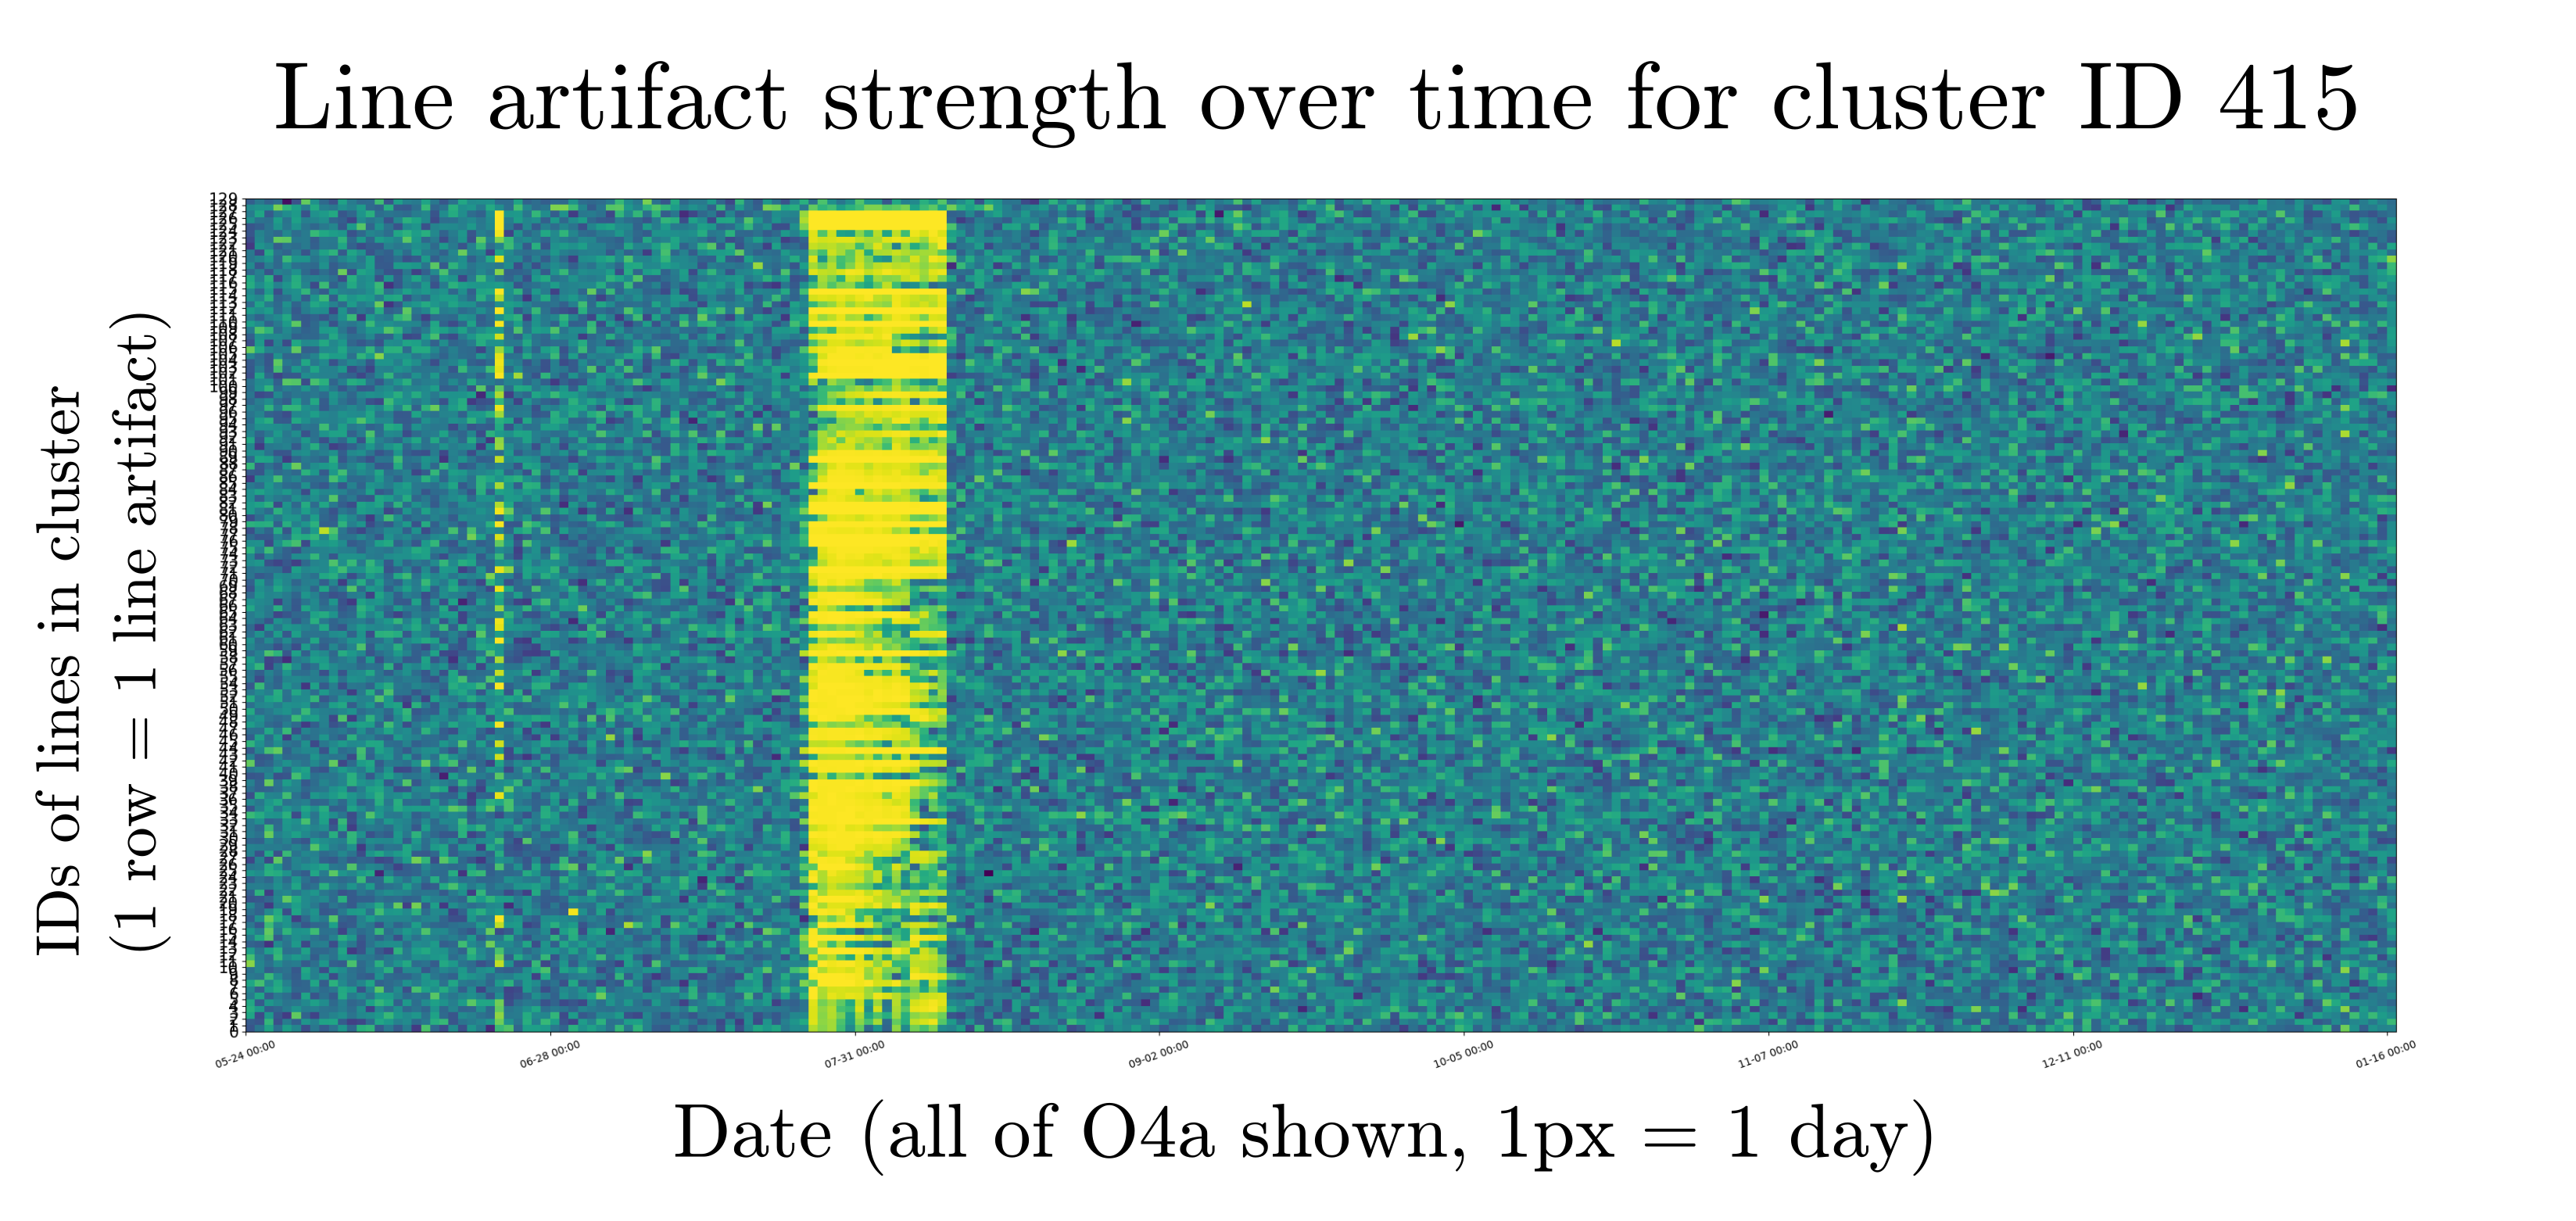
Cluster ID 415 was the most striking. It’s very clear from figure 1 that it corresponds to the time periods when the temporary calibration lines were on, and indeed it contains many of the known intermodulation products. However, it also contains many lines that were not previously associated with the calibration line test.
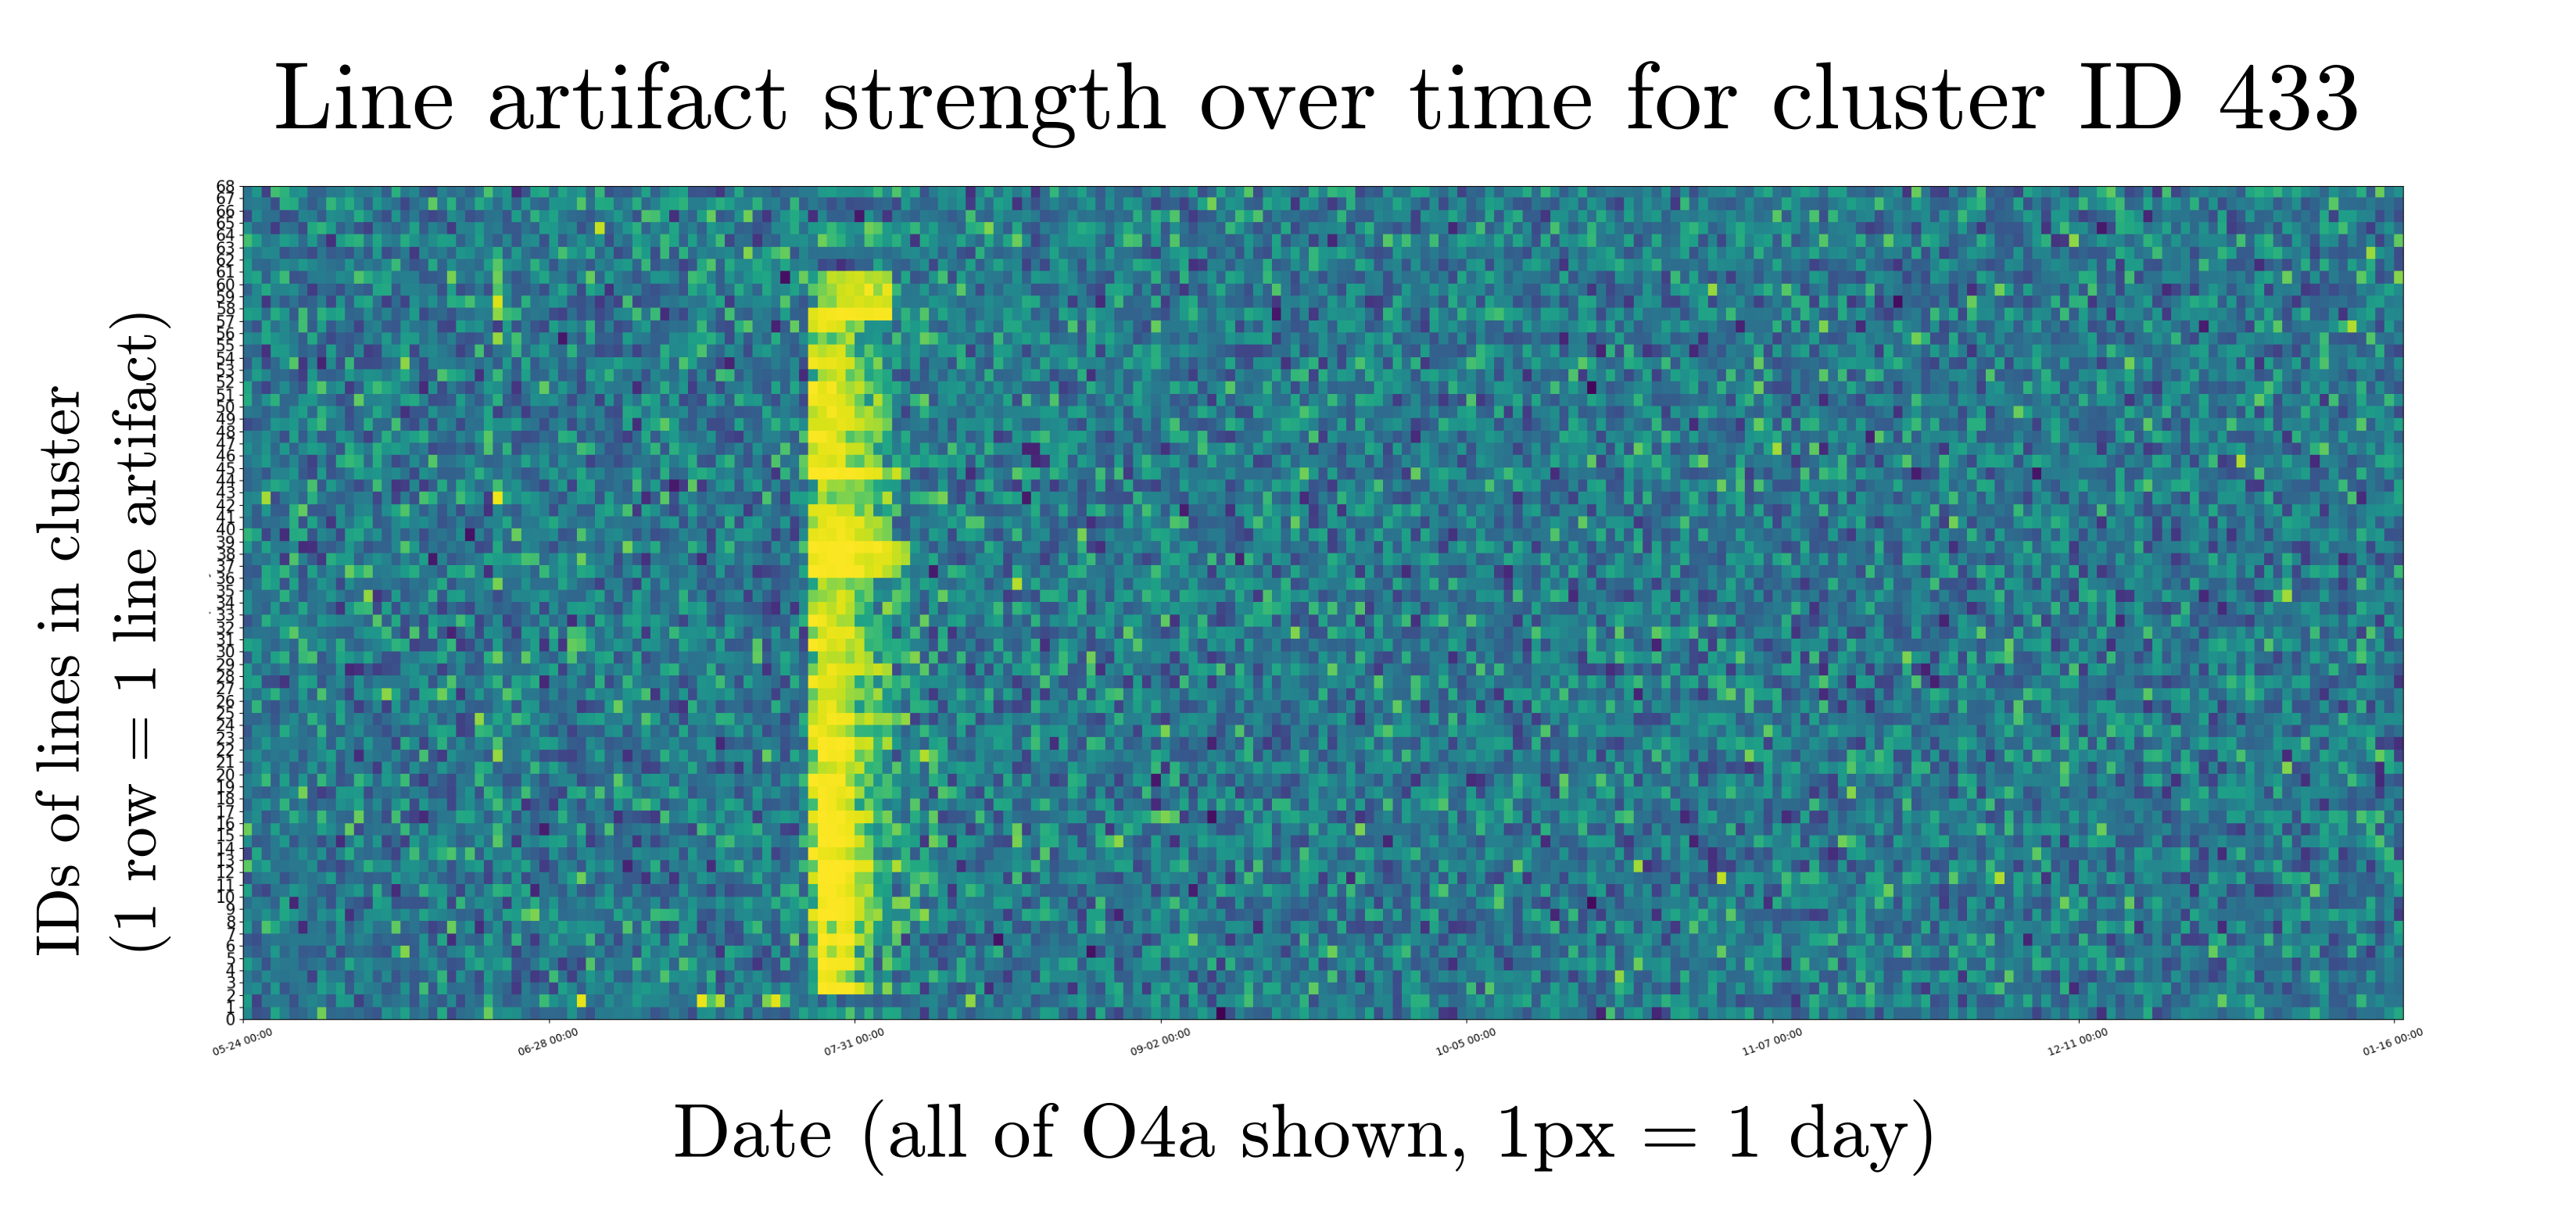
Cluster ID 433 has the same start date at cluster 415, but its end date is much less defined, and apparently earlier.
Given the background described above, we were immediately suspicious that the lines in the clusters could be explained as intermodulation products of the temporary calibration lines with rung-up violin modes. We suspected that the “sharper" first cluster was composed of stronger lines, and the second cluster of weaker lines. If the violin mode(s) responsible decreased in strength over the time period when the temporary calibration lines were present, the intermodulation products would also decrease. Those which started out weak would disappear into the noise before the end of the test, explaining the second cluster’s “soft" end.
Looking more closely - can we be sure this is violin modes + calibration lines?
We wanted to know which violin mode frequencies could explain the observed line frequencies. To do this, we had to work backward from the observed frequencies to try to locate the violin mode peaks that would best explain the lines. It’s a bit of a pain; here’s some example code. (Note: the violin modes don’t show up on the clustering results directly, unfortunately. Their positions on the lines list aren’t precise enough; they’re treated as broad features while here we need to know precise peak locations. Also, because the line height tracking draws from lalsuite spec_avg_long which uses the number of standard deviations above the running mean, that tends to hide broader features.)
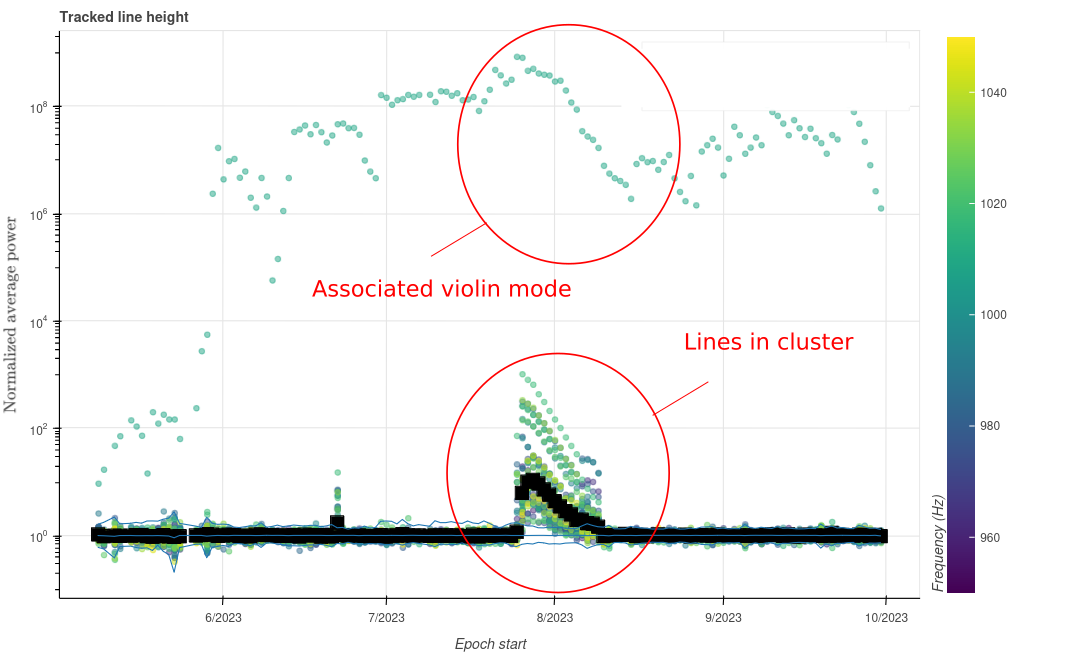
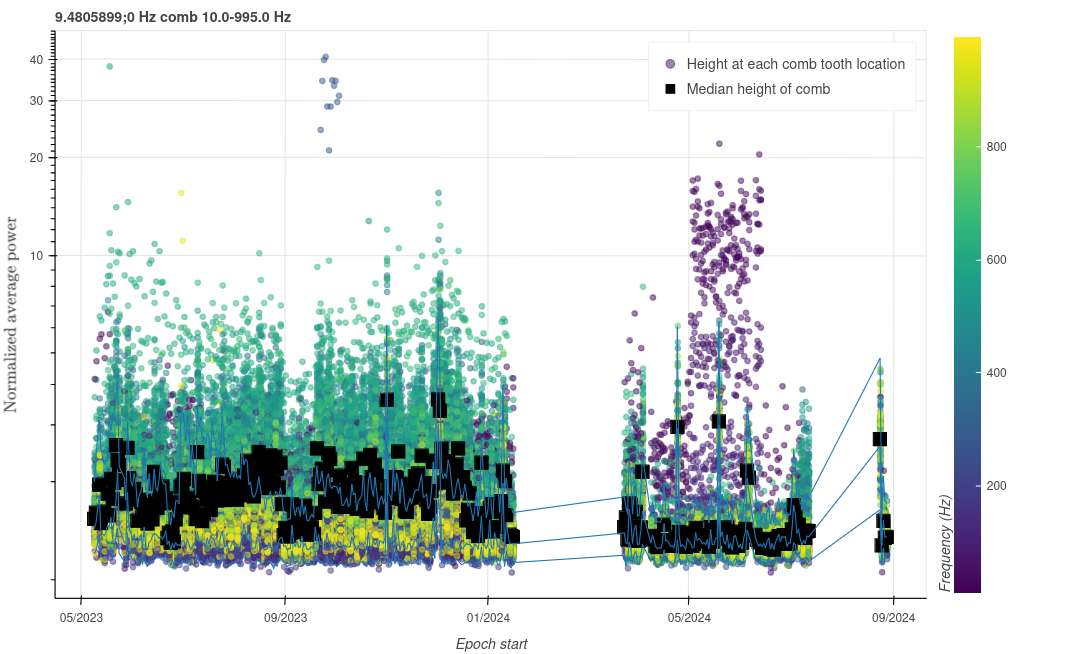
As an example, I’ll focus here on the second violin mode harmonic region (around 1000 Hz), where the most likely related violin mode was identified by this method as 1008.693333 Hz.
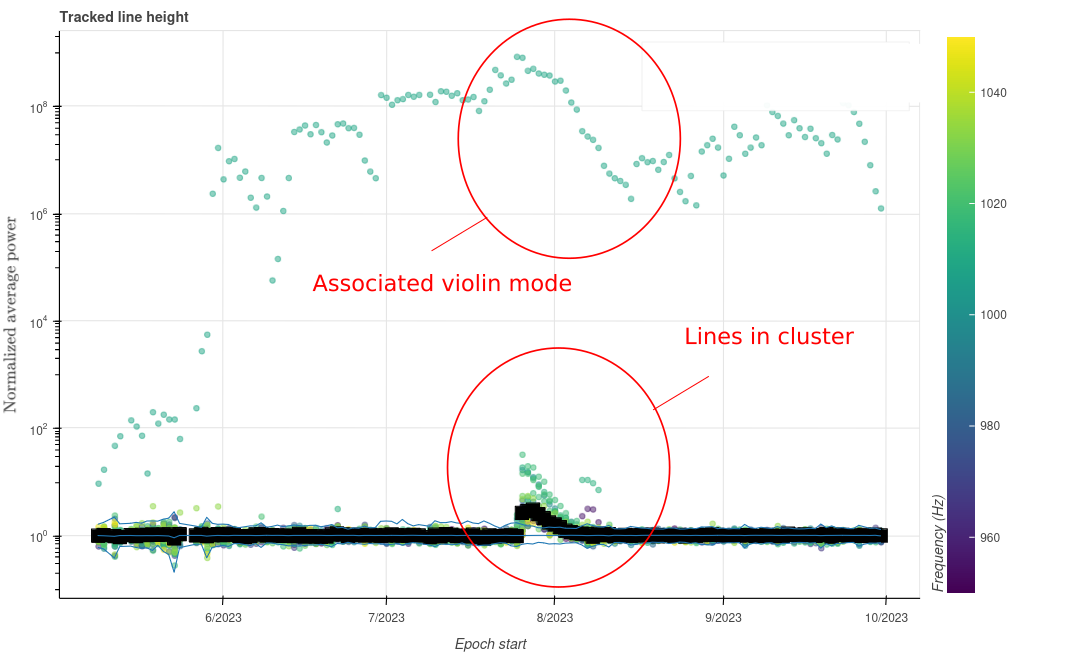
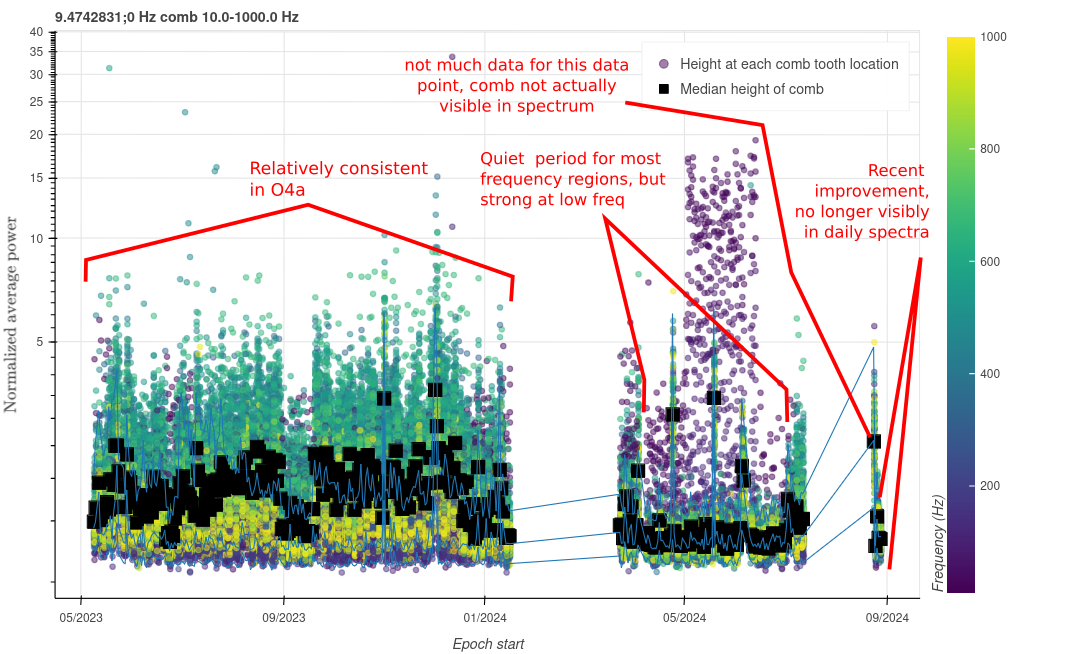
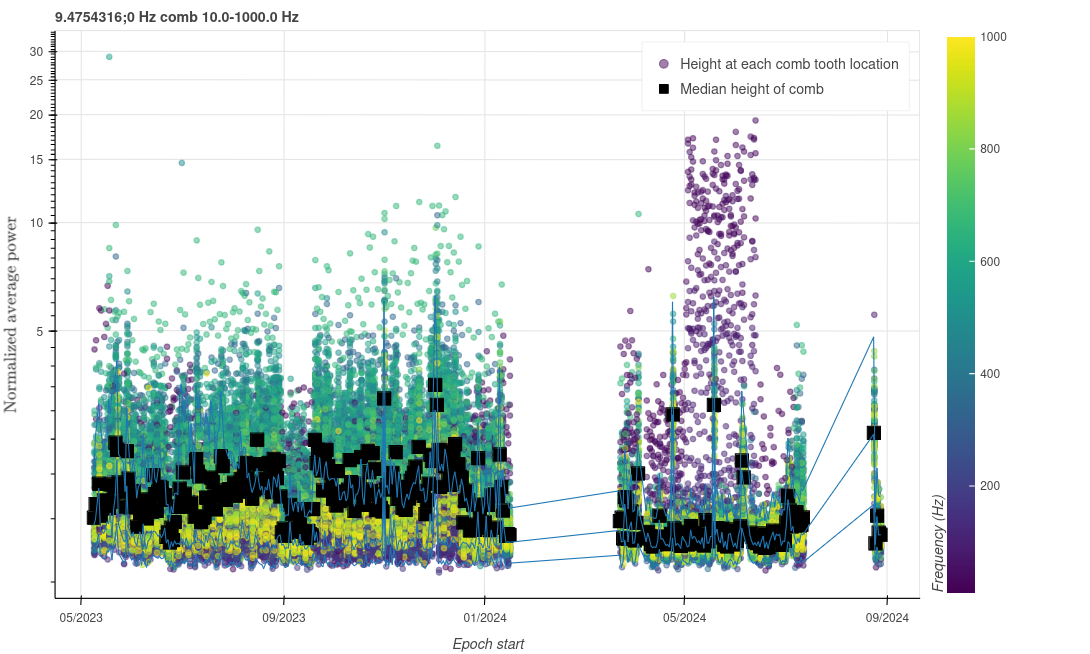
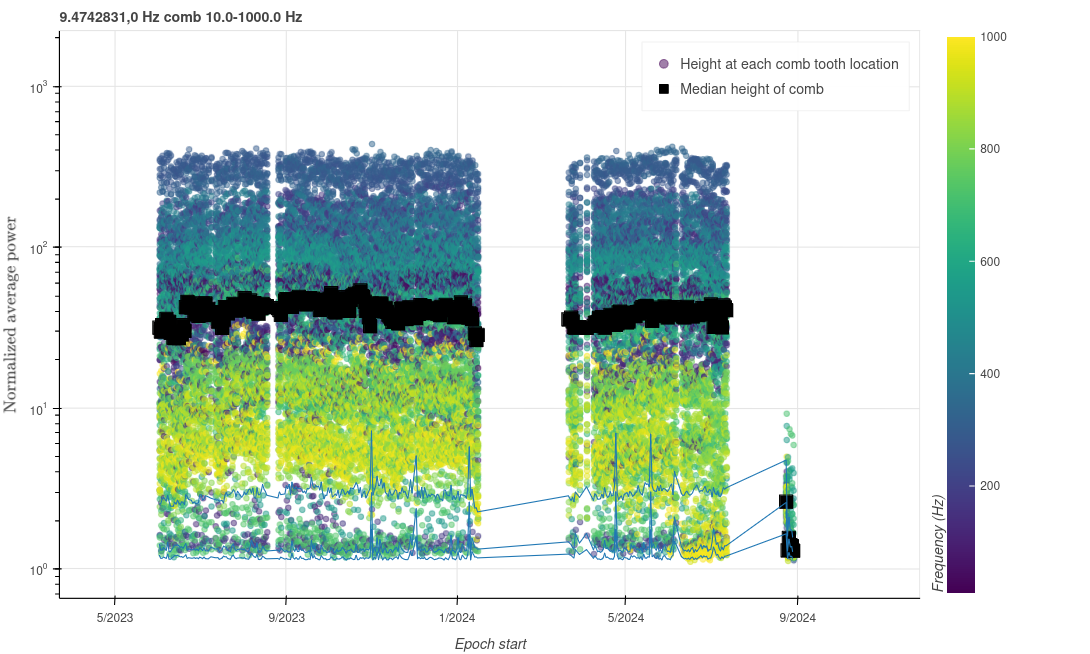
Figure 2 shows a more detailed plot of the time evolution of lines in the “sharper" cluster, along with the associated violin mode peak. Figure 4 shows a more detailed plot of the time evolution of lines in the “softer" cluster, along with the same violin mode peak. These plots support the hypothesis that (a) the clustered peaks do evolve with the violin mode peak in question, and (b) the fact that they were split into two clusters is in fact because the “softer" cluster contains weaker lines, which become indistinguishable from the rest of the noise before the end of the test.
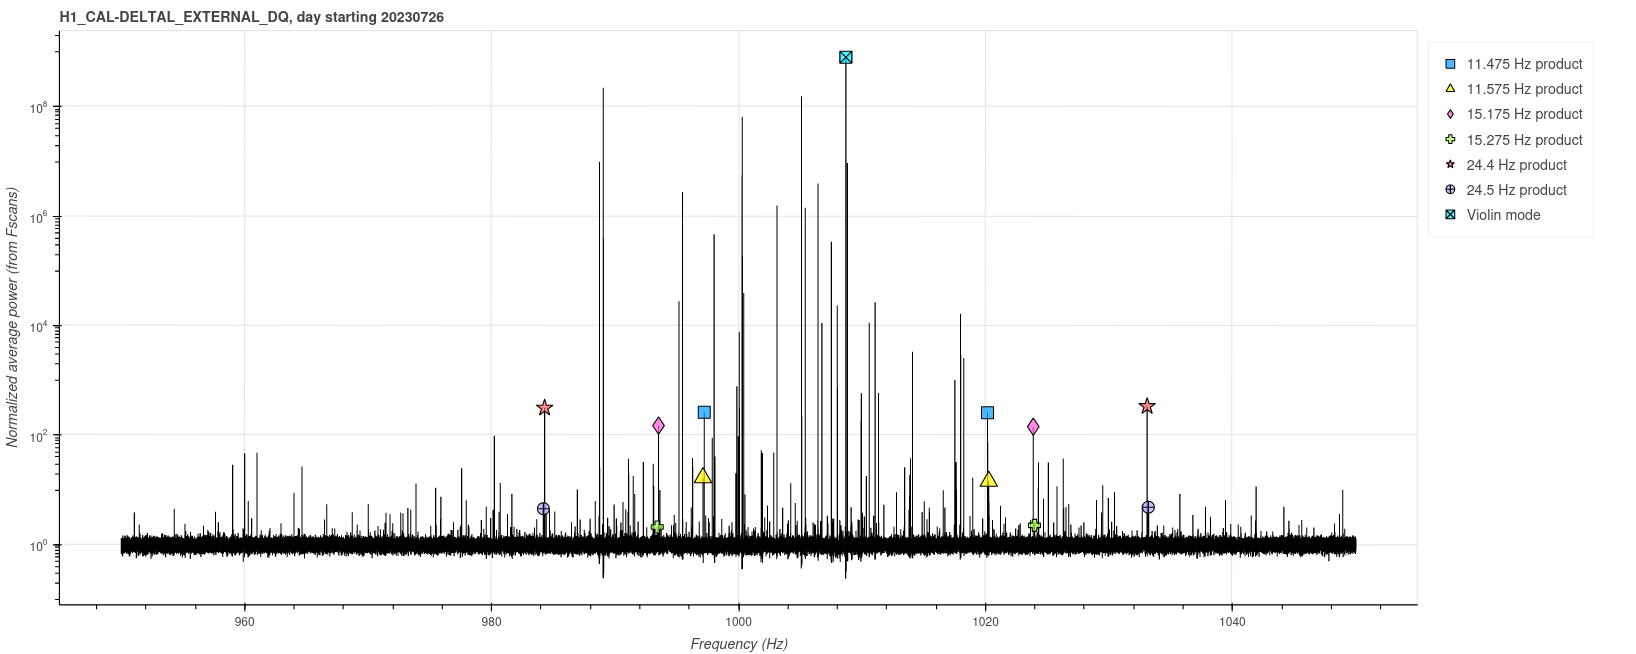
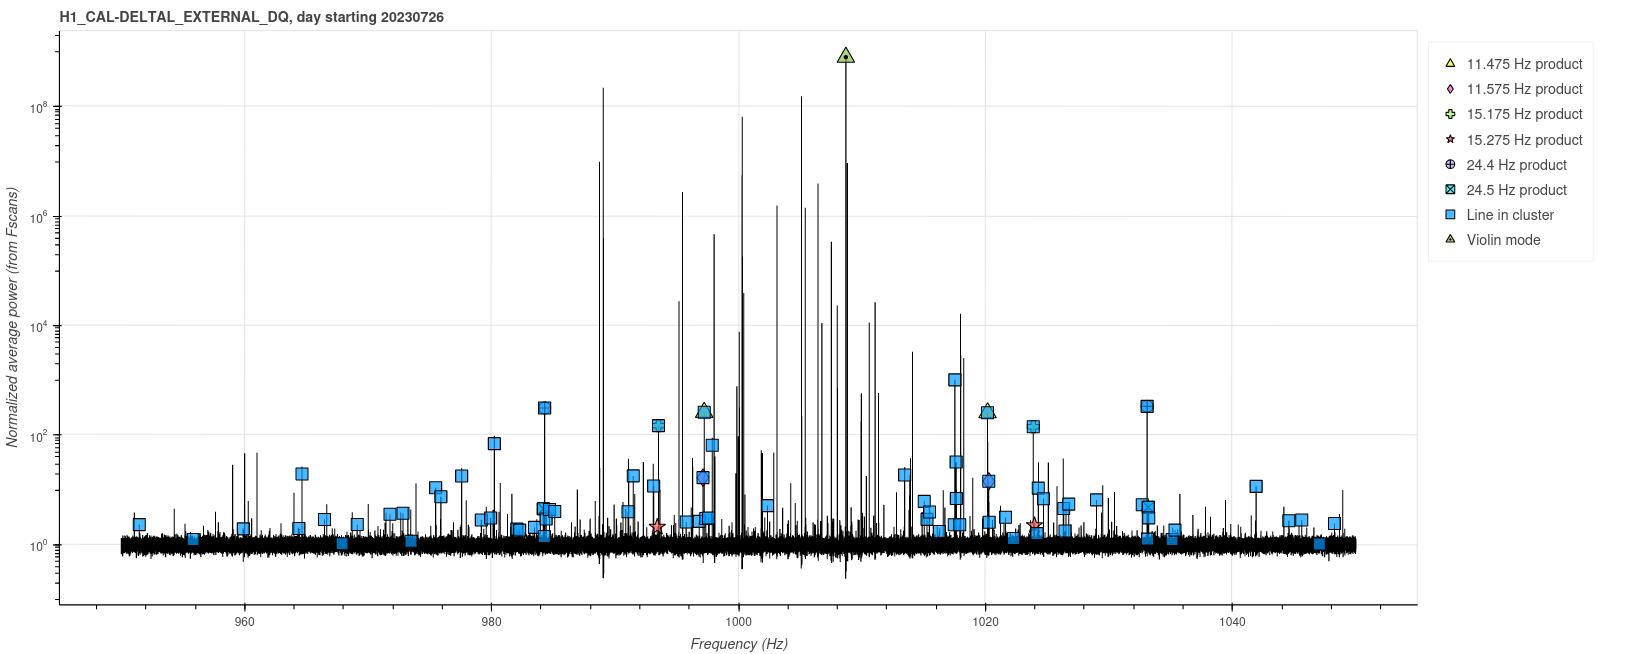
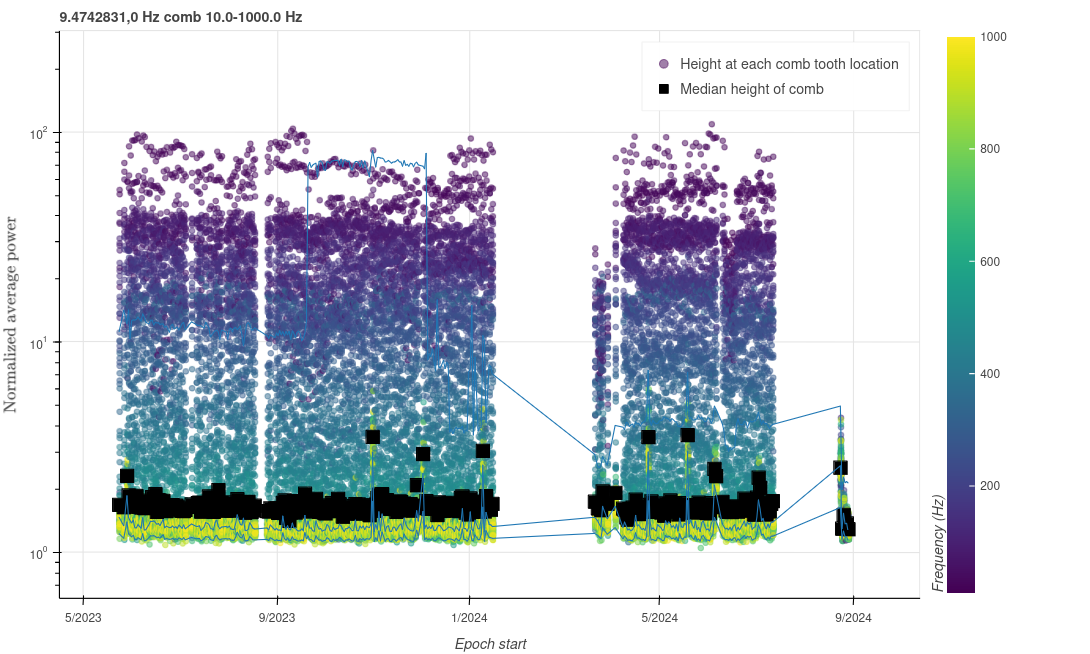
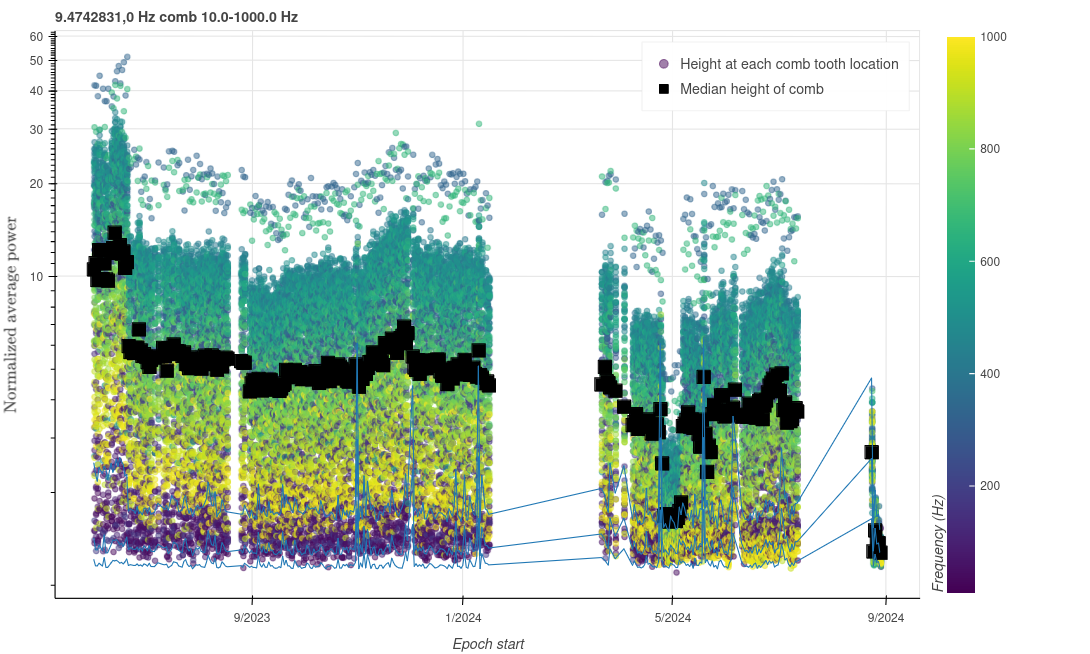
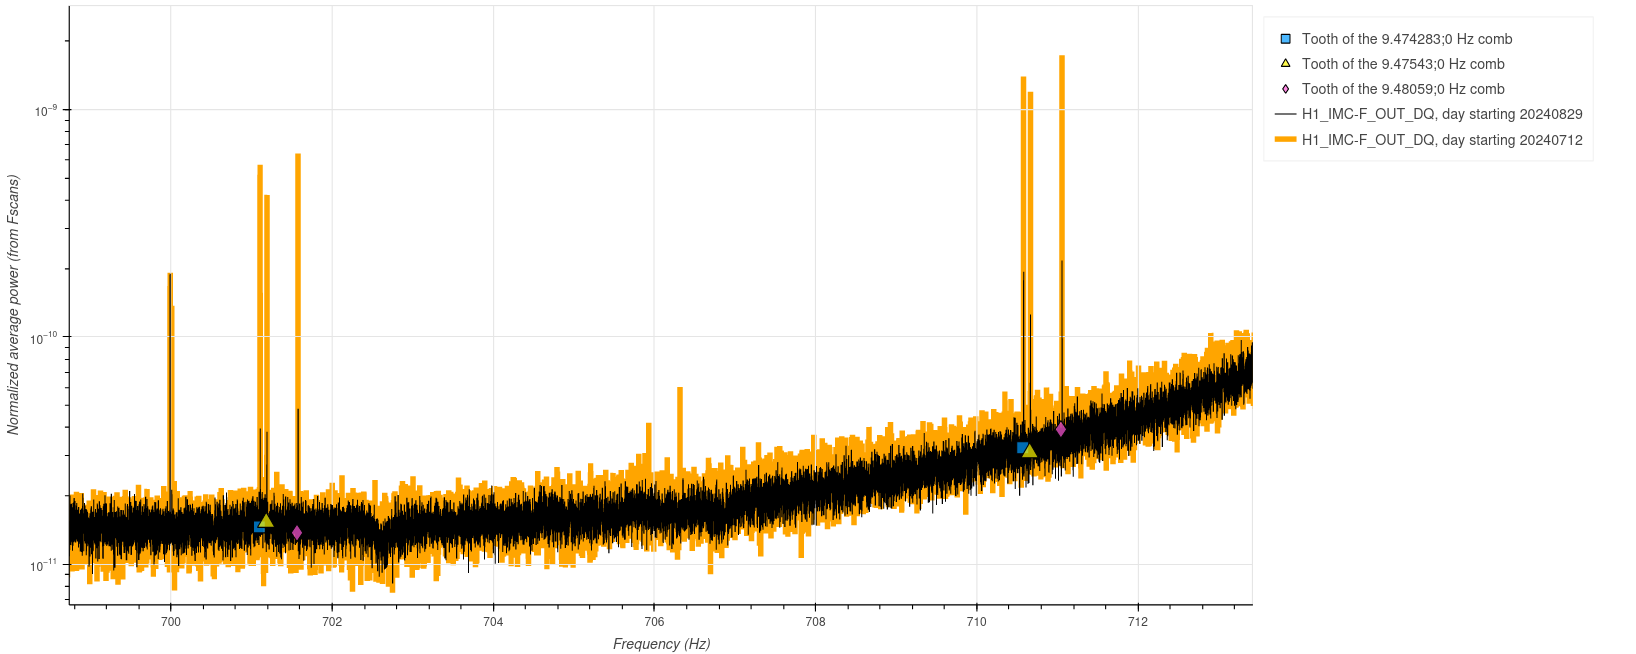
Figures 5 and 6 show a representative daily spectrum during the contaminated time, and highlight the lines in question. Figure 5 shows the first-order products of the associated violin mode and the temporary calibration lines. Figure 6 overlays that data with a combination of all the lines in both clusters. Many of these other cluster lines are identifiable (using the linked code) as likely higher order intermodulation products.
Take away points
Calibration lines and violin modes can intermix to create a lot of line contamination. This is especially a problem when violin modes are high amplitude. The intermodulation products can be difficult to spot without detailed analysis, even when they’re strong, because it’s hard to associate groups of lines and calculate the required products. Reiterating a point from 79579, this should inspire a caution when considering adding calibration lines.
However, we still don’t know exactly how much of the violin mode region line contamination observed in O4 can be explained specifically using violin modes + calibration lines. This study lends weight to the idea that it could be a significant fraction. But preliminary analysis of other contaminated time periods by the same methods doesn’t produce such clear results; this is a special case where we can see the calibration line effects clearly. This will require more work to understand.
Ansel Neunzert, Evan Goetz, Owen (Zhiyu) Zhang
Summary
Following the PSL control box 1 move to a separate power supply (see LHO aLOG 79593), we search the recent Fscan spectra for any evidence of the 9.5 Hz comb triplet artifacts. The configuration change seems promising. There is strong evidence that this change has had a positive effect. However, there are a few important caveats to keep in mind.
Q: Does the comb improve in DARM?
A: Yes. However, it has changed/improved before (and later reversed the change), so this is not conclusive by itself.
Figures 1-4 show the behavior of the comb in DARM over O4 so far. Figures 1 and 2 are annotated with key interpretations, and Figure 2 is a zoom of Figure 1. Note that the data points are actually the maximum values within a narrow spectral region (+/- 0.11 Hz, 20 spectral bins) around the expected comb peak positions. This is necessary because the exact frequency of the comb shifts unpredictably, and for high-frequency peaks this shift has a larger effect.
Based on these figures, there was a period in O4b when the comb’s behavior changed considerably, and it was essentially not visible at high frequencies in daily spectra. However, it was stronger at low frequencies (below 100 Hz) during this time. This is not understood, and in fact has not been noted before. Maybe the coupling changed? In any case, it came back to a more typical form in late July. So, we should be aware that an apparent improvement is not conclusive evidence that it won’t change again.
However, the recent change seems qualitatively different. We do not see evidence of low or high frequency peaks in recent days. This is good news.
Q: Does the comb improve in known witness channels?
A: Yes, and the improvement is more obvious here, including in channels where the comb has previously been steady throughout O4. This is cause for optimism, again with some caveats.
To clarify the situation, I made similar history plots (Figures 5-8) for a selection of channels that were previously identified as good witnesses for the comb. (These witness channels were initially identified using coherence data, but I’m plotting normalized average power here for the history tracks. We’re limited here to using channels that are already being tracked by Fscans.)
The improvement is more obvious here, because these channels don’t show the kind of previous long-term variation that we see in the strain data. I looked at two CS magnetometer channels, IMC-F_OUT_DQ, and LSC-MICH_IN1. In all cases, there’s a much more consistent behavior before the power supply isolation, which makes the improvement that much more convincing.
Q: Is it completely gone in all known witness channels?
A: No, there are some hints of it remaining.
Despite the dramatic improvements, there is subtle evidence of the comb remaining in some places. In particular, as shown in Figure 9, you can still see it at certain high frequencies in the IMC-F_OUT channel. It’s much improved from where it was before, but not entirely gone.
Just an update that this fix seems to be holding. Tracking the comb height in weekly-averaged spectra shows clear improvement (plot attached). The combfinder has not picked up these combs in DARM recently, and when I spot-check the daily and weekly spectra I see no sign of them by eye, either.
TITLE: 08/30 Eve Shift: 2300-0800 UTC (1600-0100 PST), all times posted in UTC
STATE of H1: Aligning
OUTGOING OPERATOR: Tony
CURRENT ENVIRONMENT:
SEI_ENV state: CALM
Wind: 12mph Gusts, 9mph 5min avg
Primary useism: 0.01 μm/s
Secondary useism: 0.10 μm/s
QUICK SUMMARY:
H1 unlocked about a half hour ago after a 16 hour lock stretch. Currently running an initial alignment and will start locking immediately after.
FAMIS 26446, last checked in alog79327
Both BRSs look good. BRS-X was drifting towards the upper limit, but has since started to turn around.
I was curious to see what files the two observatories actually share in their guardian user code. I've attached full lists, but here is a breakdown of the file comparisons.
LHO
Total number of nodes: 166
Total files used by nodes: 258
Files unique to LHO: 163
Files shared with LLO: 95
Files in common but only used by LHO: 30
A few key takeaways:
after_key = 'LHO_1409042566'
b4_key = 'LHO' # 1403879360 # Hot OM2, 2024/07/01 14:29UTC
(aligoNB) anthony.sanchez@cdsws29: python H1/darm_intergal_compare.py
Figures made by this script will be placed in:
/ligo/gitcommon/NoiseBudget/aligoNB/out/H1/darm_intergal_compare
Fetching data from nds.ligo-wa.caltech.edu:31200 with GPS times 1409042566 to 1409043166
Successfully retrieved data from nds.ligo-wa.caltech.edu:31200 with GPS times 1409042566 to 1409043166
data is 60.1 days old
Fetching data from nds.ligo-wa.caltech.edu:31200 with GPS times 1403879360 to 1403879960
Successfully retrieved data from nds.ligo-wa.caltech.edu:31200 with GPS times 1403879360 to 1403879960
running lho budget
Saving file as /ligo/gitcommon/NoiseBudget/aligoNB/out/H1/darm_intergal_compare/compare_darm_spectra_OM2_hot_vs_cold_no_sqz.svg
Saving file as /ligo/gitcommon/NoiseBudget/aligoNB/out/H1/darm_intergal_compare/compare_darm_range_integrand_OM2_hot_vs_cold_no_sqz.svg
Saving file as /ligo/gitcommon/NoiseBudget/aligoNB/out/H1/darm_intergal_compare/compare_cumulative_range_OM2_hot_vs_cold_no_sqz.svg
Saving file as /ligo/gitcommon/NoiseBudget/aligoNB/out/H1/darm_intergal_compare/cumulative_range_big_OM2_hot_vs_cold_no_sqz.svg
Script darm_intergal_compare.py done in 0.23667725324630737 minutes
H1's current coherence with jitter, LSC signals, ASC signals plot.
Bruco - Brute force coherence. Looks at the coherence between many channels. was the next thing I wanted to Try but I was greeted with a permissions denied when trying to ssh into the cluster with my A.E creds.
I ran a bruco on GDS CLEAN with data from the current lock after 11 hrs of lock time. My instructions. I have been running my brucos on the LHO cluster lately because it seems like every time I run on Caltech I get some error.
bruco command:
python -m bruco --ifo=H1 --channel=GDS-CALIB_STRAIN_CLEAN --gpsb=1409075057 --length=600 --outfs=4096 --fres=0.1 --dir=/home/elenna.capote/public_html/brucos/GDS_CLEAN_1409075057 --top=100 --webtop=20 --plot=html --nproc=20 --xlim=7:2000 --excluded=/home/elenna.capote/bruco-excluded/lho_DARM_excluded.txt
Results:
https://ldas-jobs.ligo-wa.caltech.edu/~elenna.capote/brucos/GDS_CLEAN_1409075057/
Greatest hits:
At Livingston, we have been using a separate DIAG_COH guardian to monitor the health of the feed forward. It is similar to Bruco in functionality, in sense that it computes coherence. It does it automatically every 3 hrs within an observing period and computes band limited coherence of channels according to a set config file. An additional feature is that it stores previous coherence values to a file as reference and compares current values with that. If it differs drastically say 2 sigma, it displays a message in DIAG_MAIN warning that certain FF is under performing compared to reference.
at 00:29 Fri 30 Aug 2024 PDT there was a short vacuum glitch in HAM6 detected by PT110_MOD1.
The pressure increased from 1.90e-07 to 2.06e-07 Torr.
Gitch was detected by VACSTAT.
VACSTAT is in testing mode, and the MEDMs still needs some polishing. The Overview and PT110 MEDM are attached.
Gitch time doesn't appear to be related to H1 locking or unlocking. 24 hour PT110 and H1 range trend attached.
The smaller, wider glitch on left was at 16:51 Thu and is known about (pump operations as part of noise hunting). The 00:29 glitch is the larger, sharp one to the right.
I've promoted VACSTAT from a H3 test system to a H1 pre-production system. This allows me to add the channel H1:CDS-VAC_STAT_GLITCH_DETECTED to the alarms system (alarms was restarted 10:15). For testing it will send alarms to my cellphone.
Here is an investigation that might give us insight into the PRCL/CHARD/DARM coherences.
Today, we ran a PRCL injection for the feedforward where we injected directly into the PRCL loop. I took this injection time and looked at how the CHARD P and Y error signals changed, as well as their respective coherences to PRCL and DARM (figure). When injecting about 15x above ambient in PRCL from 10-100 Hz, there is a 2x increase in the CHARD P error signal and 4x increase in the CHARD Y error signal. The coherences of CHARD P and Y to PRCL increase as well, and the coherences of CHARD P and Y to DARM also increase. This injection allows us to measure a well-defined CHARD/PRCL transfer function. In the attached screenshot of this measurement, all the reference traces are from the injection time, and all the live traces are during a quiet time.
Meanwhile, I looked back at the last time we injected into CHARD P and Y for the noise budget, on June 20. In both cases, injecting close to 100x above ambient in CHARD P and Y did not change either the CHARD/PRCL coherence or PRCL/DARM coherence. There is some change in the PRCL error signal, but it is small. Again, in the attachments, reference traces are injection time and live traces are quiet time. CHARD P figure and CHARD Y figure.
I think that this is enough to say that the PRCL/DARM coupling is likely mostly through CHARD P and Y. This would also make sense with the failure of the PRCL feedforward today (79806). However, we may want to repeat the CHARD injections since there have been many IFO changes since June 20.
As a reminder, the previous work we did adding a PRCL offset did reduce the PRCL/CHARD coupling: read 76814 and the comments. We are currently not running with any PRCL offset.
I decided to compare the PRCL injection times back in March when I set the PRCL offset to reduce the coherence of DARM with LSC REFL RIN (76814, 76805). One conclusion of these tests was that a PRCL offset can reduce the REFL RIN/DARM coherence, but not necessarily improve the sensitivity. Also, the offset reduced the PRCL/CHARD Y coupling and increased the PRCL/CHARD P coupling.
A bruco shows that there is once again significant coherence with REFL RIN and DARM. I compared the PRCL injection time from yesterday with the PRCL injections with different offsets. The PRCL/ CHARD couplings have increased for both pitch and yaw: plot. I also included the coherences of CHARD to DARM for these times but then realized that data might actually be confusing to compare. However, the PRCL offset has an effect on the PRCL/CHARD coupling, so it could be one strategy to combat this coupling. Unfortunately, it has opposite effects for pitch and yaw.
There was a lot of work done to move the alignment of the PRC around in May; here are some alogs I found to remind myself of what happened: 77736, 77855, 77988. Seems like the goal was to reduce clipping/center on PR2. I wonder if this alignment shift caused the increase in the PRCL/CHARD coupling from March to now.
We should consider checking the PRCL and CHARD coupling while adjusting the PRC alignment. The yaw coupling is stronger, maybe because the beam is much further offcenter of PR2 in yaw than in pitch?
Overall, I think the benefit of this investigation would be a reduction of the noise in CHARD, which would help improve the sensitivity.
We did a 10 minute on/off HAM1 FF test today. I determined from that test that improvement could be made to the feedforward to CHARD P and INP1 P, so I used that off time to train new filters (time here: 79792).
I took a screenshot of the DTT results. The golden traces represent the various loop spectra with the feedforward OFF. Blue represents the previous feedforward, and red represents the new feedforward I fit today. First, look at the top and bottom plots on the left, showing CHARD P and INP1 P. You can see that the old feedforward was having minimal benefit (gold to blue), and the new feedforward is performing much better (gold to red).
Next, look at the middle plot on the left showing CHARD Y. This plot shows that the feedforward is making CHARD Y WORSE (blue worse than gold). Therefore, I just turned it off. I am not yet happy with the fitting results for CHARD Y, so I will continue to work on them.
You can also see in the middle right plot, PRC2 P current feedforward is performing well (gold to blue), so I made no change, red still matches blue.
Note! This means the significant change here must be related to RF45- PRC2 is only sensed on RF9, while INP1 and CHARD use RF45.
Finally, DARM on the right hand side shows improvement from blue to red. It looks like HAM1 FF off is better below 15 Hz, maybe due to CHARD Y.
The new CHARD P and INP1 P filters are all saved in FM9 of their respective banks. I SDFed the new filters, and the CHARD Y gains to zero, second screenshot.
I made one mistake which is that I did not SDF these changes in SAFE, only in OBSERVE, which means that needs to be done before an SDF revert, since they are not guardian controlled!