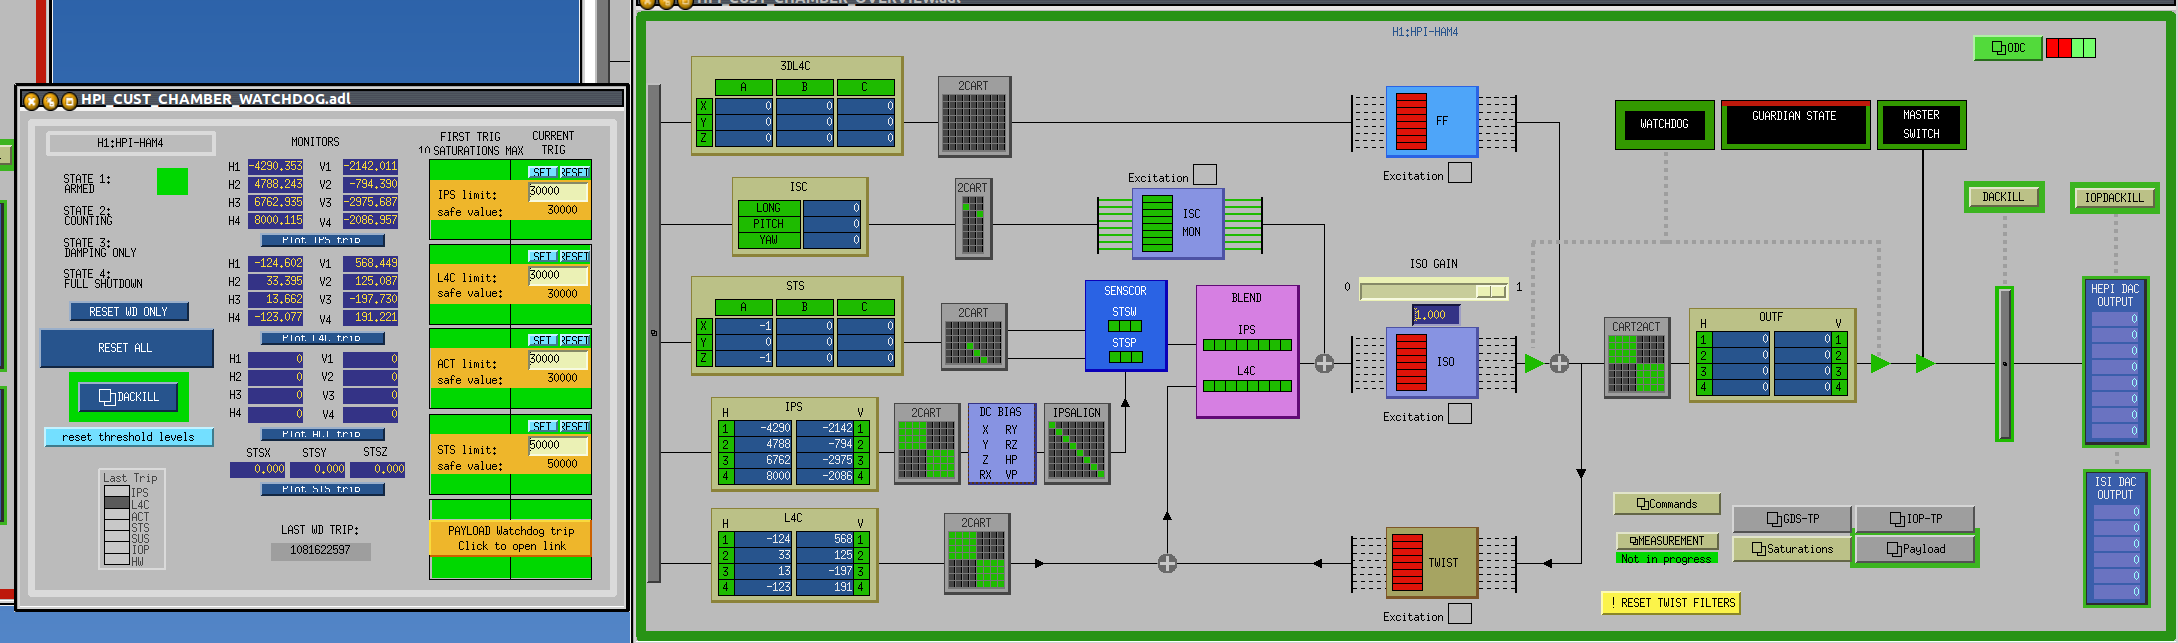
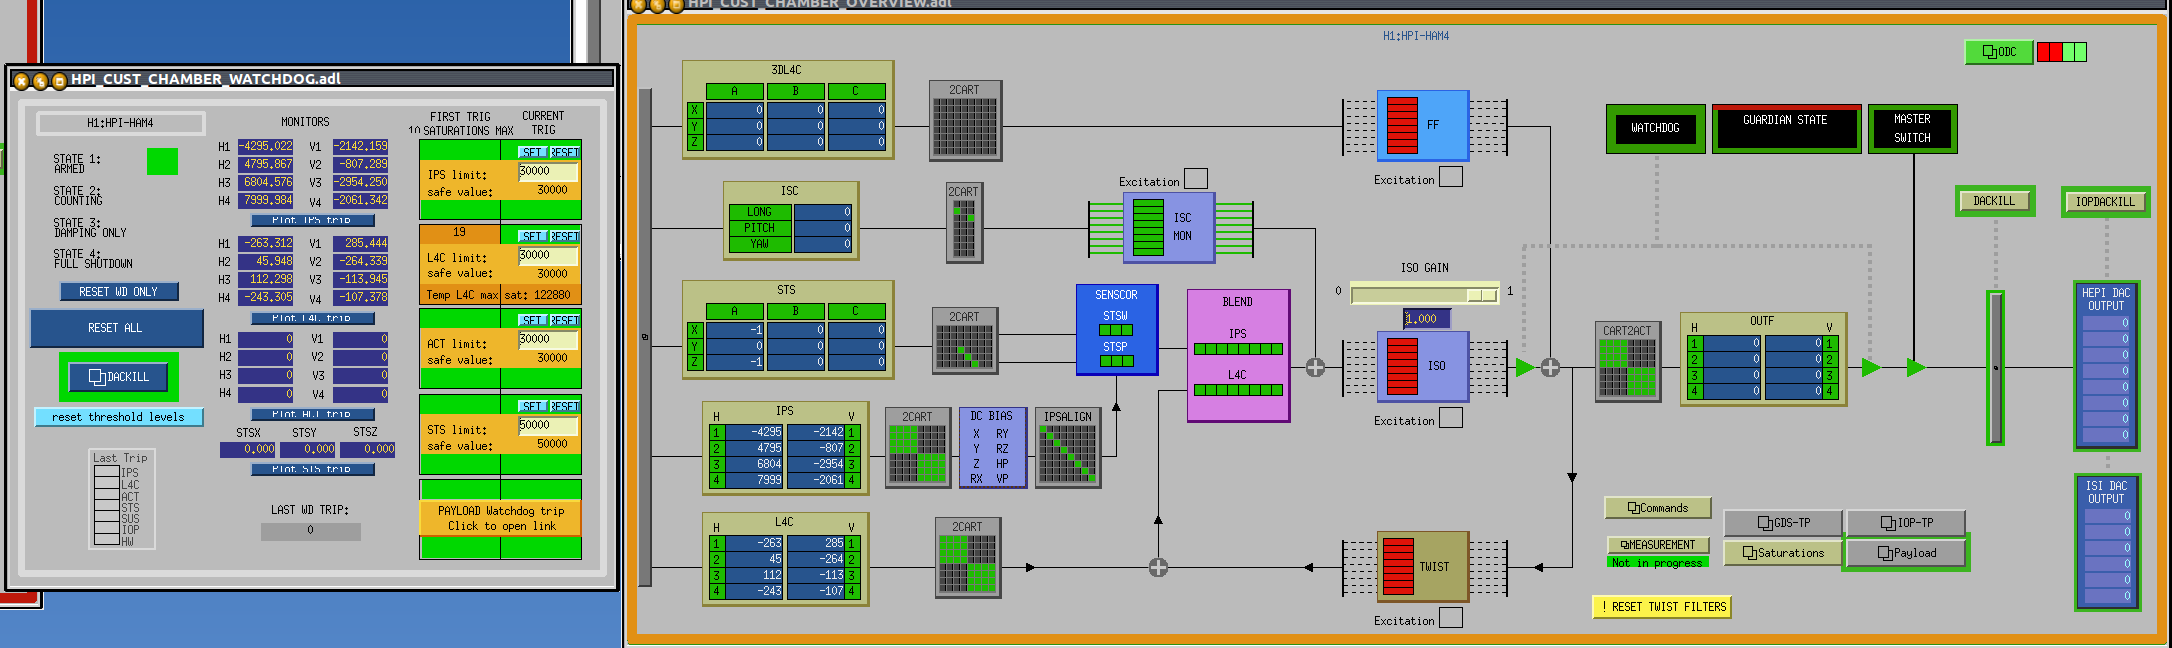
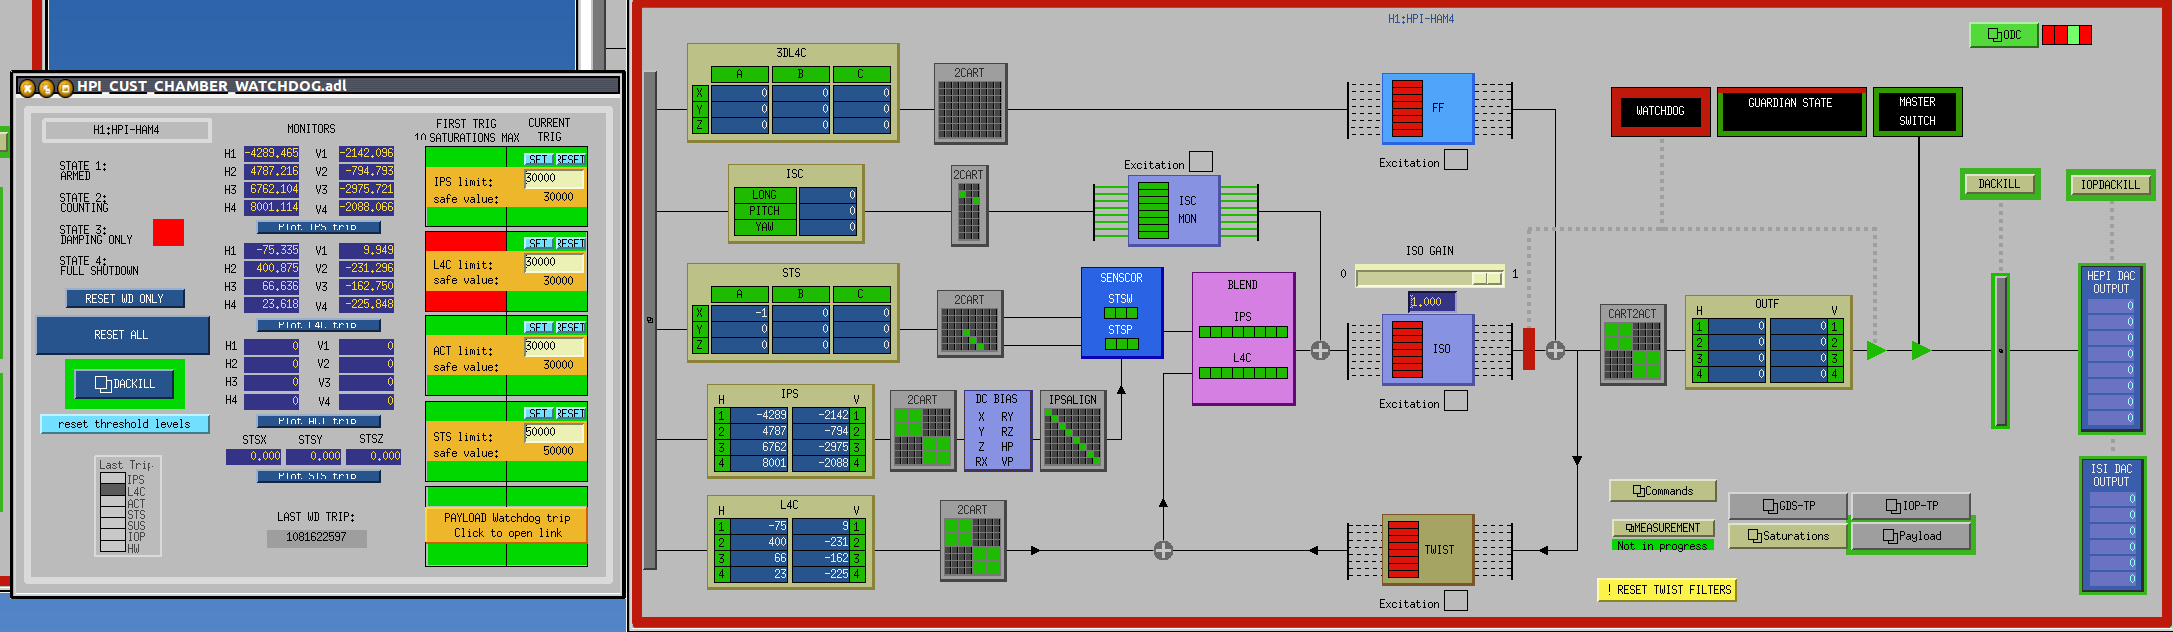
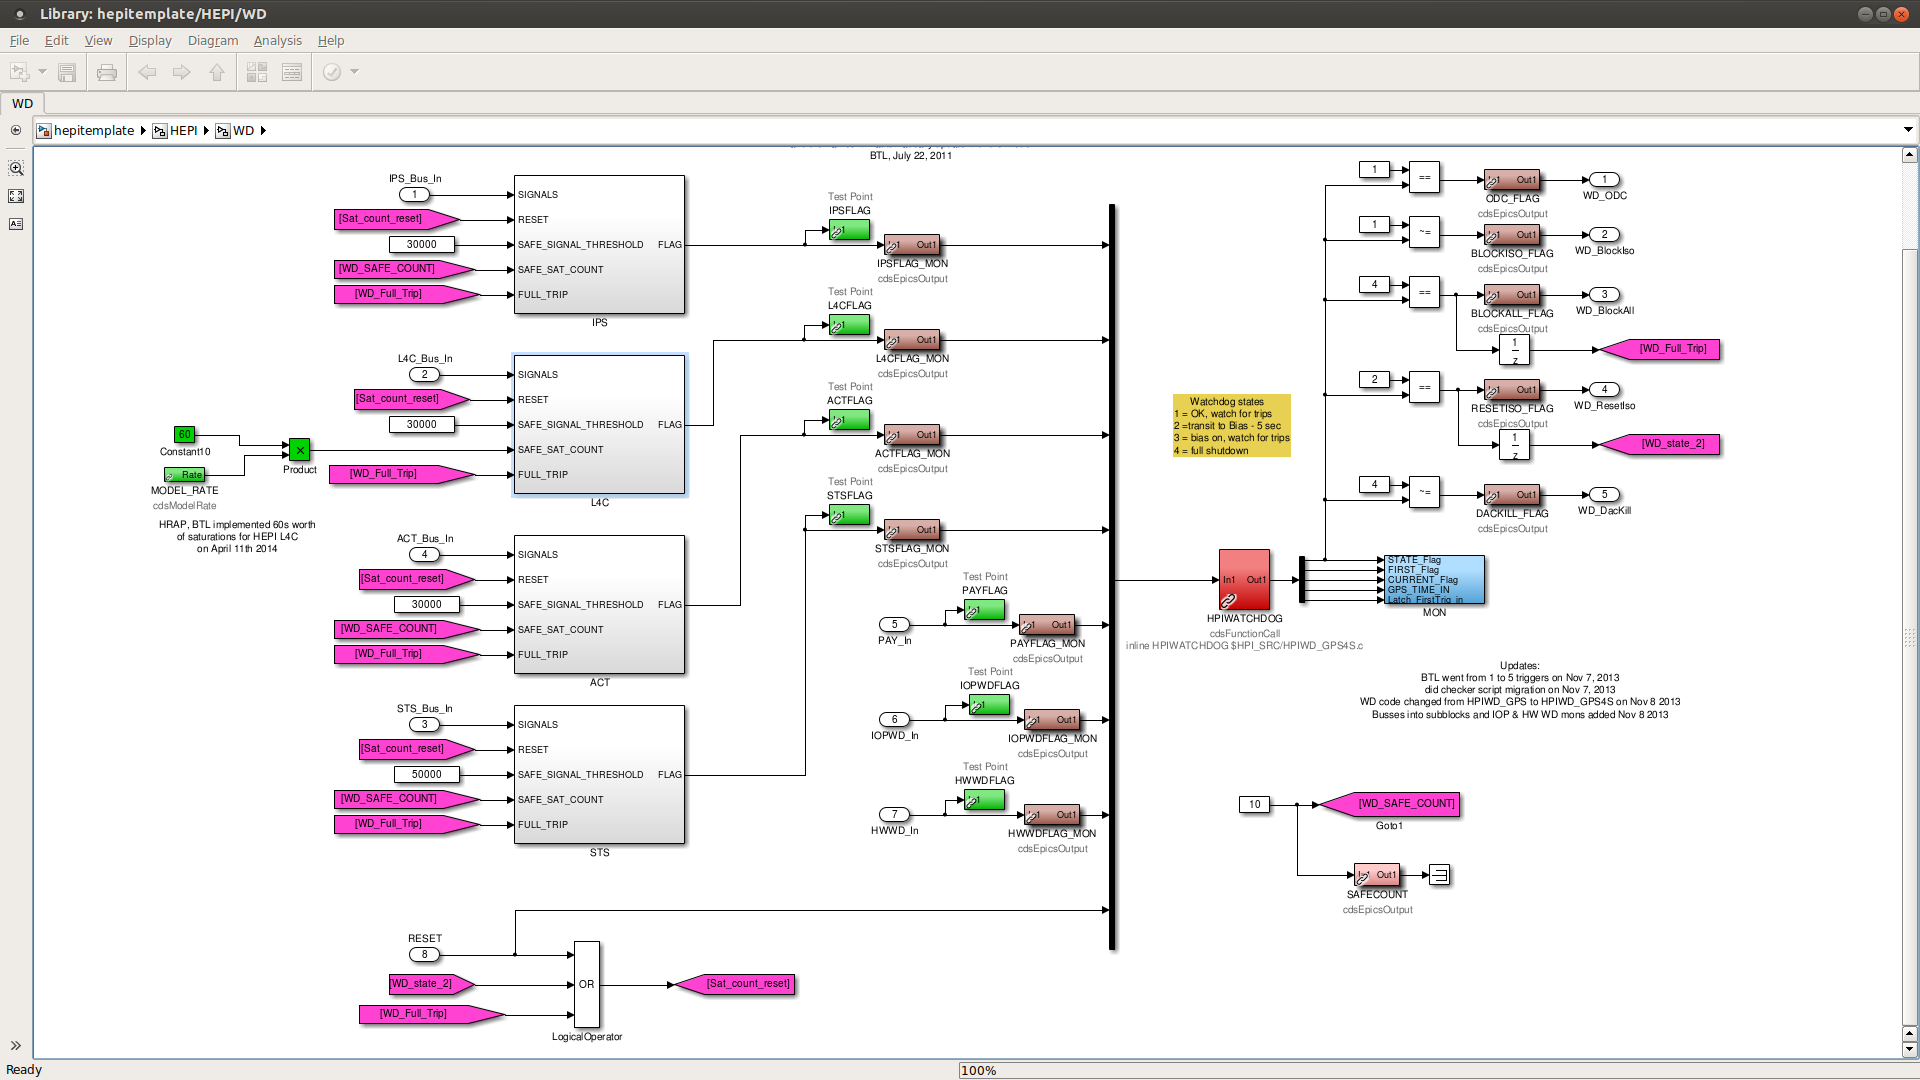
To be absolutely clear, my understanding is that the new threshold is NOT actually 60s worth of saturations, but
60 * (model sample rate in Hz) samples worth of single-sample saturations that will now cause trips.
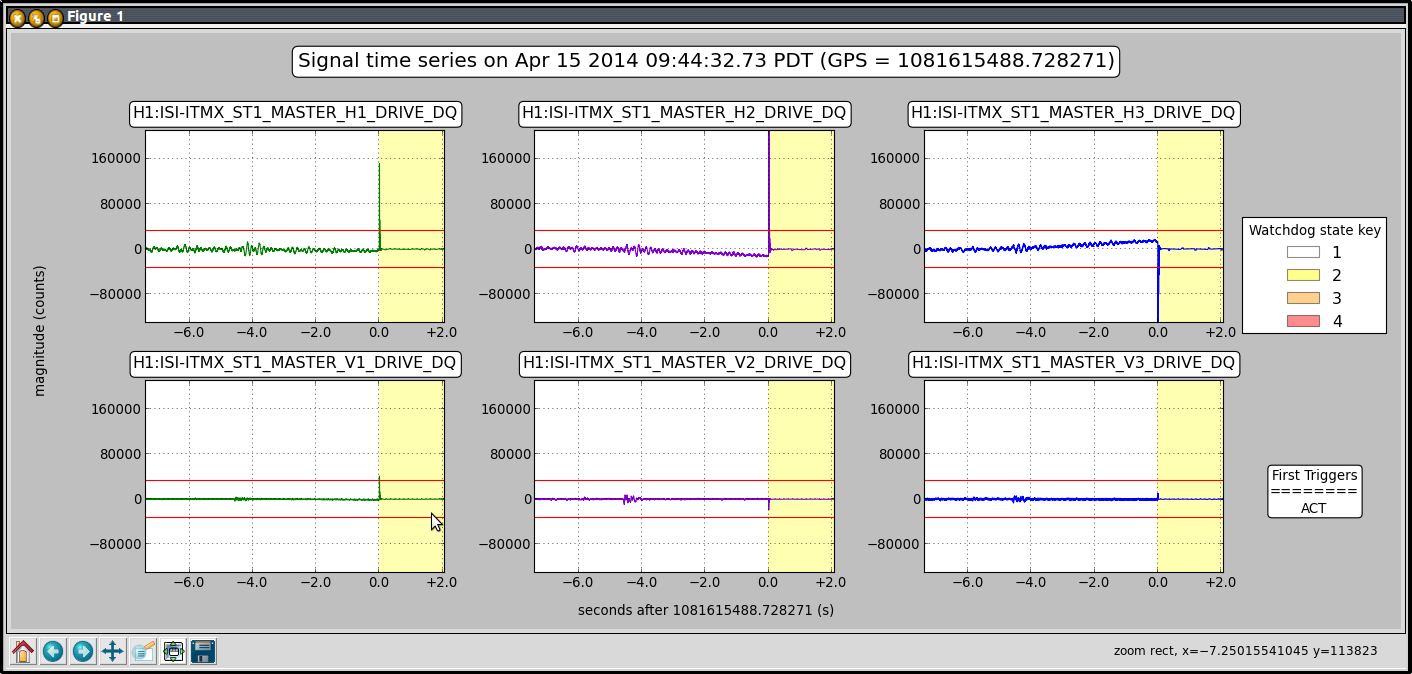
This is a big and important distinction. The first will trip after 60s worth of continuous saturations; the second will trip in an indeterminate time after the first saturation after a reset.
Please correct me if this is not right but this is my understanding of the new behavior, and it's important that everyone is clear on it.
60 x (model rate) = (number of saturated samples allowed) is what I coded into the master model, and what I meant by "60s worth of saturations" without realizing it could be misunderstood.
HEPI-L4C saturation counter will keep accumulating regardless of whether the saturations are continuous or not, until the reset button is pushed, or HEPI trips.
Laser Status: SysStat is good Output power is 27.5 W (should be around 30 W) FRONTEND WATCH is Active HPO WATCH is red PMC: It has been locked d, 11 h 40 minutes (should be days/weeks) Reflected power is 1.2 Watts and PowerSum = 11.0 Watts. (Reflected Power should be <= 10% of PowerSum) FSS: It has been locked for 0 d 0 h and 3 min (should be days/weeks) Threshold on transmitted photo-detector PD = 0.56 V (should be 0.9V) ISS: The diffracted power is around 12.4 % (should be 5-15%) Last saturation event was 0 d, 0 h and 2 minutes ago (should be days/weeks)
On Monday 04/145/2014 We partly removed the soft covers on the North and South door of HAM5. Particle counts before the covers came off were generally zero, with an occasional 1 to 20 counts in the 0.3 and 0.5 micron range. I took several counts inside the chamber. Most were zero, which occasional spikes in the 100 0.3 micron range. I did see one spike with over 500 0.3 micron counts, and corresponding lesser counts in the larger particle sizes. These counts cleared within a few minutes and return to the normal ranges.
I installed the latest OS updates on the digital video camera servers, and also did some minor updates to the EPICS IOC processes, as specified in WP4566. No issues, other than a typo that took a little time to track down that prevented the settings from being automatically restored (fixed).
we don't know why, it is windy out. Sensor correctioin was off
We are trying Tcrappy
The ISI tripped again, L4C limit, there are people working in the beer garden. The BS ISI is also tripped.
ITMX ISI tripped again. ACT Limit this time...no idea why... the blends were on TBetter
Here are spectra of the ETMX and ITMX oplevs. All blends are on Tbetter, sensor correction was on for ETMX and off for ITMX.
We are bothered right now by large amplitude motion (around 1urad pp) in yaw at very low frequencies.
We've seen this on ITMY before and changing out the laser seemed to fix the problem. I've attached some graphs indicating more clearly what might be occurring. The time series indicates that the power is dropping on all quadrants in with 20 second intervals; although this is very difficult to see by looking at the normalized pit and yaw signals,you can see it very clearly when looking at the individual segments. Similarly, in the spectra, there is only a small indication at 1.0-2.0 Hz that something weird may be going on but when we look at an individual segment, you can see weird spikes starting at 0.056 Hz and then the harmonics following through to higher frequencies. For comparison, I included the ETMX Segment1 spectra and you can see that we shouldn't see those spikes. I'll be investigating this today but my first guess would be either the laser or laser power that's causing a dip in power every 20 seconds, which is pretty odd because we got this laser new "off the shelf" from microlasers.
Some improvement but still oscillatiing a bit.
I've attached new spectra comparing the WIT sensors and the optical lever to show that we can see real motion of the optic for the coil balancing procedure that the SUS team is trying to perform. Also attached is the comparison between ETMX and ETMY, although the ISIs are in a different state, we can see that they are comparable. The last image attached is a trend showing that we still see this power oscillation with a peak to peak of about 240 counts with a period of ~3 seconds. This is much better than the p-to-p of 2500 counts every 19-20 seconds in the previous laser configuration.
Trying to hunt down the exact noise source proved to take longer than I thought it would. I ended up switching between three variables and chooising the best configuration: The laser, the power supply, and the outlet. We have not switched this laser to run with the power board yet but once we implment this change, it'd be interesting to see if this oscillation goes away or gets worse. Richard thinks that the noise comes from the thermo-electric coolers in the laser itself, in which case switching to the power board probably will probably not change this artifact.
I was setting the stage 1 blend filters (one at a time and slowly like we were instructed to), and the ISI tripped due to the ACT limit.
These plots show that it is possible to completely damp out the fundamental L and P modes of the quad, that are causing the cavity pain. The damping method here is called 'full state feedback'. It is like modal damping in that it uses an estimator to compensate for a shortage of sensors around the quad. However, the controller is a matrix rather than a set of filters. The advantage of the matrix feedback is that you can solve the matrix for a set of desired closed loop poles. So here I have specified that the first two modes will have a Q of 0.67 in the closed loop. The others I specified between 10 and 50. The price you pay for this controller is absolutely terrible noise performance. Also, it is not AC coupled. But, if the RMS test mass motion is a real problem for the cavity, this can be used to suppress it.
The hydrogen outgassing rate measured is 75% of that measured in 2000. The atmospheric accumulation is about 6.9 x 10^-8 torr liters/sec and seems high relative to that in y1 and the accumulations made at LLO. The value suggests a small leak. If this is in the beamtube it is at the threshold of not being able to be found with our current techniques. The results of the accumulation were more difficult to calculate and have more uncertainty due to the method of connecting the RGA to the beamtube. The connection was made by a corrugated small diameter tube rather than a mount directly on the beamtube. The pumping speed of the tube and the pumping speed of the RGA as an ion pump need to be accounted for. The attached pdf file shows the influence of the connecting tube and presents the results.
Yep, this level of air leak would be challenging to locate by current techniques. It's probably small enough not to directly impact sensitivity, but it seems important to establish whether there's a degradation process at work, like LLO Y. We should consider a repeat accumulation, perhaps with three sampling points along the 2km module.
I estimate some 3000 cm^2 of viton in the large valves exposed to this volume. This may account for some of the air. Anyone know the outgassing rate of viton after 140,000 hours under vacuum?
We should probably reconfigure the RGA to eliminate local orings and the low conductance of the flex hose. Kyle and I felt we had nothing to loose by trying the quick and dirty method first. Practice makes better.
Correction on the surface of viton contained in the LN pumps and large gate valves.
There are 4 gate orings entirely in the vacuum (45 inch diam) and 2 gate orings 1/2 exposed at the closed gate valves(45inch).
There are 4 flange orings 1/2 exposed where the gate valves bolt to the ln pumps(45 inch diam)
There are 2 bonnet seal orings 1/2 exposed in the two gate valves open to the volume - each is 144 inch long.
Total surface area ~ 6970 cm^2
If the entire air leak is allocated to this we get an outgassing rate for the viton of 1e^-11 tl/sec/cm^2.
[Kyle Sheila Arnaud]
This evening, we took a close look at the ETMY optical lever spectra, which showed interesting features in the pitch and yaw signal, as well as in the sum, (cf first screenshot)
Thinking it might be due to the laser, we went down to EY, and tried recycling it, but unfortunately it didn't change anything (red and blue = before, brown and pink = after). Maybe we should try the same thing with the electronics.
Second attachement shows the current difference between EX and EY in the oplev pitch. EY signal still looks very noisy from 1Hz certainly because of the current ground activity (fans, pumps...)
Finally, this morning Kyle turned off the turbo vacuum pump to make sure it was causing the 29.57Hz peak in the ISI T240 and the oplev spectra. Third attachment shows difference on/off (orange ON, purple OFF) in the oplev pitch spectra.
There was no clear reason for this trip, no one was in the lvea at the time.
Sheila, logged in as Alexa
No touching.
I started this last week, finished it today. Not going to give a lot of details of the measurement, but we drive the ISI hard at low frequency in one direction and adjust some cps align elements until a hooked line becomes mostly straight. This will give us some gains in the low frequency region. St2 still needs to be done, but should go relatively quickly. Also need to add sensor correction, which I'm starting to look at right now. Posting a screen of the St1 cpsalign values here for posterity.
I went back to the end station today to look into the beam quality. At Keita's suggestion I put a retro reflector in to look at the beam without having to worry about what happens in the chamber. With the retroreflector after the last steering mirror on the table, I set up the nanoscan in the path to WFS B and the thorlabs beam scan in the path to the HWS, whic doesn't double pass the Faraday. Using the two profiles, I tried to move the Faraday around to find a position where both the beam in the HWS path (the first pass beam) and the beam in the WFS B path (double passed) were good. Although there were many positions that gave a good beam after the single pass, I didn't find anything that gave a nice gaussian profile in the rejected path. I swapped the Faraday with a simliar one, and the beam quality was immediately better. With a small adjustment I found beams that look guassian in both the WFS path (measured at 3 different positions) and the HWS path, using the retroreflector. Reflecting off the ETM the beam is a little bit worse, but still bassically a guassian beam.
(Keita, Sheila, Alexa)
After Sheila swapped out the Faraday we noticed that the incident light on each of the green QPDs was not the same and one of them was almost saturating. It turned out that the two Faraday output angles were not the same. We adjusted that HWP after the Faraday so that we maximized the s-pol. In addition, we manually recentered the beam onto the QPDs with the servo off.