It didn't seem like there was much seismic noise based on the PEM FOMs, but they both triped around the same time. Plots for ITMX attached
2014_03_13 16:14 h1ioppemmy
2014_03_13 16:15 h1ioppemmy
2014_03_13 16:18 h1ioppemmy
2014_03_13 16:22 h1ioppemmy
2014_03_13 16:48 h1ioppemmy
2014_03_13 16:50 h1pemmy
no unexpected restarts.
Laser Status: SysStat is good Output power is 28.4 W (should be around 30 W) FRONTEND WATCH is Active HPO WATCH is red PMC: It has been locked 2 d, 11 h 15 minutes (should be days/weeks) Reflected power is 1.2 Watts and PowerSum = 11.3 Watts. (Reflected Power should be <= 10% of PowerSum) FSS: It has been locked for 0 d 0 h and 5 min (should be days/weeks) Threshold on transmitted photo-detector PD = 0.9 V (should be 0.9V) ISS: The diffracted power is around 13.4 % (should be 5-15%) Last saturation event was 2 d, 11 h and 15 minutes ago (should be days/weeks)
Chris ran the swiffer in the Diode Room this morning for the first time in 8 months. Will try to make cleaning more regular.
Earlier tonight Alexa made some measurements of IMC transfer functions to for matching with her model, and I worked on the slow feedback to the ETM top mass. (alog about that coming in the morning, in short the L2P decoupling has helped)
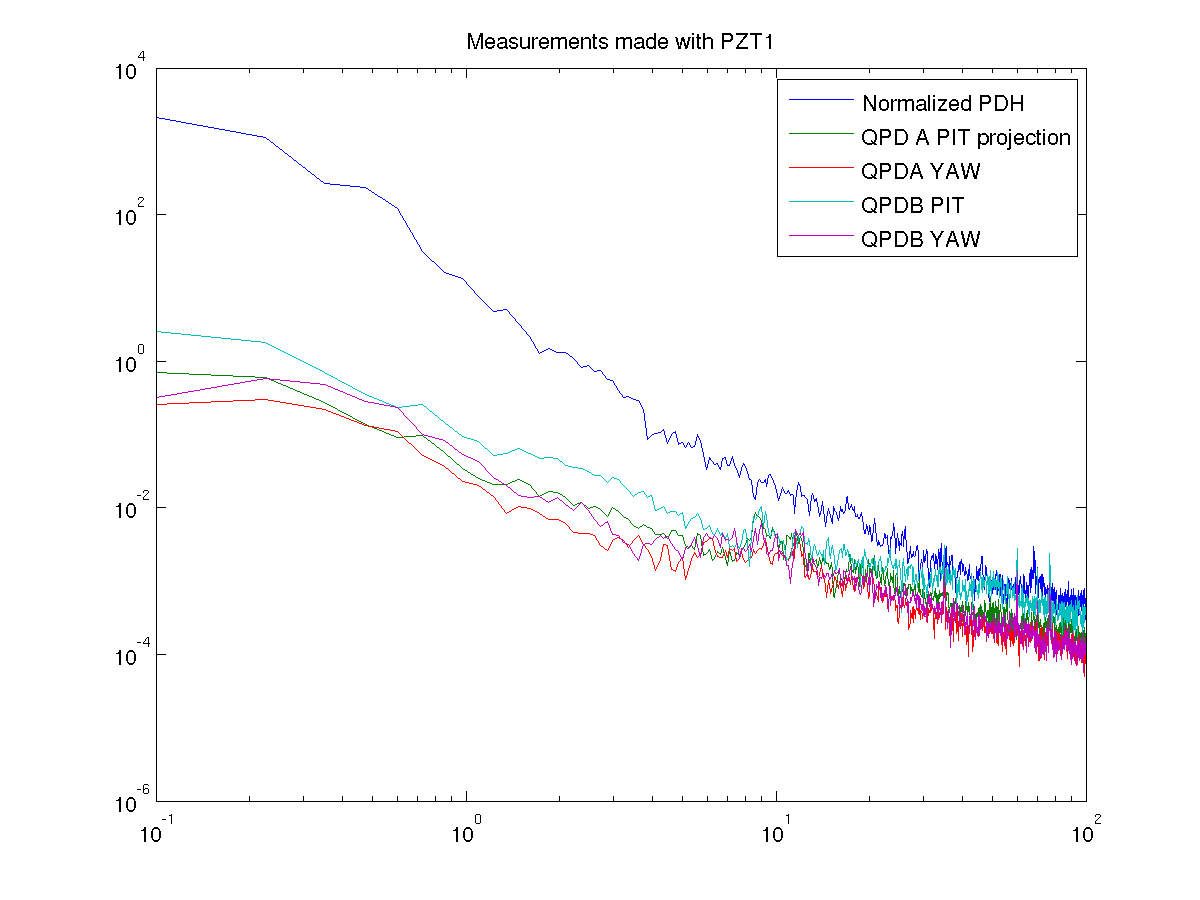
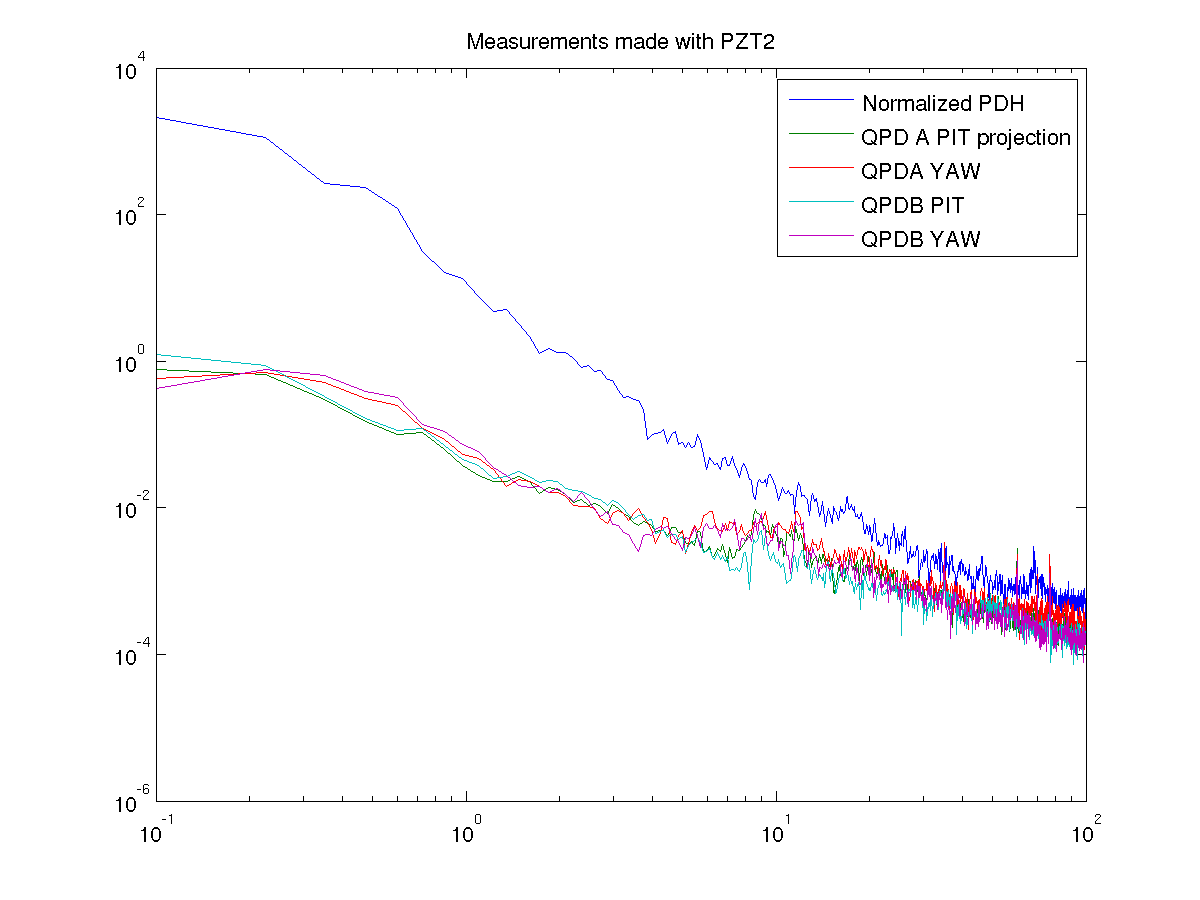
Now I've made some measurements similar to what ALexa and I did on Monday night (alog 10668) of the linear coupling from the test mass angles to the out of loop frequency noise sensor (the normalized refl PDH). This time I dithered the PZTs on ISCEX, and measured the spectrum of the normalized PDH and the green QPDs on the input beam on the TMS table. I haven't calibrated the QPDs, or measured the loop gain, but these are verry slow loops and I dither the PZTs at 5Hz so that should not matter. By dithering each PZT in both pitch and yaw, and finding the peak in the spectrum of both QPDs each time, we get 2 measurements of the coupling from each QPD to frequency noise.
Hz/ count measured by dithering PZT1 | Hz/count measured by dithering PZT2 | |
QPDA PIT | 114 | 126 |
QPDA YAW | 66 | 154 |
QPDB PIT | 92 | 44 |
QPDB YAW | 51 | 69 |
As you can see the measurements made with different PZTs aren't always consistent. Using these and measured spectra of the QPDs, we can make the projection of the linearly coupled noise from input beam pointing to ALS frequency noise, it is not a significant contribution (below 100Hz) based on any of these measurements. At around 100 Hz these projections seem to explain the noise, I believe this is just the noise of the QPDs, but will check in the morning.
I also checked the linear coupling from the ETM pitch to frequency noise, to see how much it changes with alignment. I measured 424Hz/urad, moved the ETM by 0.1urad, measured 1.12kHz/urad, tried to move it back to the original spot and measured 2.03kHz/urad. Then I tweaked up both pitch and yaw on the ITM and ETM to try to maximize the green transmission, and got 3.2kHz/urad. So we can change the linear coupling by adjusting the alingment; by hand I only seem to make it worse but hopefully the WFS will do better.
I am leaving the green arm locked, and the guardian running the ALS COMM handoff, so hopefully the IR will be resonanting in the arm some part of the night.
h1pemmy is finally up and working. The first problem relatively easily found was a bad ADC card, which was swapped early on after it was seen to generate 'channel hopping' errors to dmesg. Said card has been marked as bad (it was probably pulled from somewhere else, but not actually labelled as bad which led to it's later unfortunate re-installation). The second issue was that after replacing the ADC card the duotone signal was not appearing on CH31 (numbered from 0). This led to a number of time consuming component swaps to eventually find that the cause was a bad cable from the internal 16 channel Contec card to the IO chassis backplane. I could verify with the IO chassis powered up, but the front end computer off, that the duotone signal was present on the correct pin of the cable feeding the ADC. After boot/code initialization, the duotone input was switched off by the relay on the adapter board, and the last channel of the AA chassis would then feed the ADC (verified by injecting a signal through the AA chassis). I could also verify the relay control voltage with the Duotone0_select testpoint on the backplane. The code is (in it's present form, in theory) hard coded to never activate this relay, so seeing 5V here is not right. The cable itself is mis-crimped, such that pins 1/20, 2/21, ... , 18/37 are shorted together, with pin 19 not connected at the male/Contec side of the cable, a fact not immediately obvious in the back of a dark rack, but more so once exposed to the light... The moral of this tale is to double check the internal 37 pin cable that controls the backplane if the duotone signal seems to go missing between the testpoint on the board and the ADC sometime after boot, there may be more of these floating around.
Offending Y2P peak between 1 and 2Hz (pink) was removed after a new decoupling filter was put in place (green).
In the H1:SUS-ETMX_L2_DRIVEALIGN_Y2P filter, I put the same invP2P filter in FM1 as in the P2P path, then added a diagonalization filter ("Y2Pdiag") in FM2, and another filter that is a 3rd order elliptic BP in FM3. I didn't try to remove 0.4-0.5Hz Y2P peak, it's not great but probably good enough.
ITMX PUM P2Y and Y2P measurement was done, but I need to leave before generating decoupling filter.
Seems like ITMX PUM is somewhat better diagonalized than ETMX PUM, but I'll remove 1.4Hz P2Y peak anyway.
Remember, the ITM is a wire hang QUAD (the test mass is suspended from the PUM via a wire loop and prisms), and has significantly different dynamics than the ETM fiber welded QUAD. This may be an explanation for the different dynamics. I also imagine you'll have to do this process all over again with the ITM once it becomes monolithic like the ETM.
We probably need to re-do everything once it's re-hang.
Thomas started work on an Operator Overview screen. This screen has a graphic of H1 with all of its chambers. For each chamber, we have buttons to easily & directly open HEPI, SEI, & SUS screens. The buttons are also colored such that they indicate whether Watchdogs are GREEN or RED. So for quick glances, this medm can give you an idea of ALL WATCHDOGS.
This is a living screen, and we plan to add more features (Guardian, "Measurement In Progress", etc.). This medm currently resides at:
/opt/rtcds/userapps/release/sys/h1/medm
We currently have this medm is now an FOM & currently on our video1 Wall Monitor. The CDS SUS Overview also shares this FOM, but we may remove that screen since that screen is sort of redundant (or it will be once we get all SUS screens on the Ops Overview screen).
TF is setup on the workstation with a 2.5 hour delay, to allow for PCAL work. Lucky number 3.
.......LVEA: Laser SAFE..............EY: Laser SAFE.........EX: Laser HAZARD.......
A major activity today was the installation of the Spool at EY, installation of viewports on the spool, and then getting PCal pylons staged into position. Other activities are:
End-Y - The dust monitor in the spool cleanroom (#2) at End-Y failed with a low battery message. Filiberto replaced a blown fuse in the network junction box. The dust monitor appears to be working at this time. The dust monitor for the BSC10 chamber (#1) is charging and will be replaced in the morning. There is a temporary handheld unit in the chamber cleanroom. HAM5 Cleanroom – Getting communications errors on the dust monitor in the HAM5 cleanroom. Filiberto found low voltage on this unit. It is shut down for charging overnight. I will bring it back on line in the morning.
I updated Simulink noise budget model to incorporate balanced BS/PRM actuator.
Updates made since last alog (#10441) are;
PRMI sensing matrix I used is;
PRCL MICH
REFLAIR 45 I 4.8e5 1.5e4
REFLAIR 45 Q 3.9e3 -2.6e4 W/m
Some plots from NB model are attached. Data I used is taken from Mar 12, 12:43:00 UTC for 2048 seconds, when PRMI is sideband locked with REFLAIR45.
OLTF_MICH_1078663396.png: MICH OLTF. The magnitude from the model is higher than the measured by ~40 %. This means that there are some errors in the sensing matrix measurement. We have sensor/actuator calibration error of ~10%. Also, there was a power drop in the cavity build up (POP18) by ~10%. However, these errors don't explain the disagreement between the model and measurement. We need more investigaton on this. (There was is a suspision about the factor of sqrt(2) in BS, but I've checked that)
OLTF_PRCL_1078663396.png: PRCL OLTF. The model and measurement agrees within 10%. Also, phase looks reasonable (compare the OLTF before output matrix diagonalization in alog #10441; we had a dip).
PRCLtoMICH_1078663396.png, MICHtoPRCL_1078663396.png: Measured coupling between MICH loop and PRCL loop (TF from H1:LSC-MICH_EXC to H1:LSC-PRCL_IN1 or vice versa). Compared with the same measurement done before output matrix diagonalization, coupling is at least factor of 2 less (see alog #10481). Model explains some features qualitatively.
NB_MICH_1078663396.png, NB_PRCL_1078663396.png: Noise budget for MICH and PRCL loop. Note that seismic noise is not real (copied from LLO model).
LASER
PMC
FSS
ISS
model restarts logged for Wed 12/Mar/2014
2014_03_12 16:09 h1ioppemmy
2014_03_12 16:28 h1ioppemmy
2014_03_12 16:28 h1pemmy
2014_03_12 21:02 h1fw1
All expected except for the h1fw1 restart.
Yesterday, we found that the reaction chain of ETMY quad was rubbing, so Betsy and Travis made some adjustements and a round of TF was ran overnight. The results are now clean, meaning the suspension is free of rubbing for both chains. This will be our official phase 3a set of transfer functions.
The first attachement shows the transfer functions for the 6 DOF of the main chain and the second attachement for the reaction chain. TF have their peaks matching very well with the model, except T DOF of the reaction that has an extra resonance at 0.86Hz which is a roll mode. (and as usual the reaction chain pitch which differs because of added stiffnes from cables which couples into the L DOF).
I added to the plots the phase as well as the ratio between model and measurement.