patrick.thomas@LIGO.ORG - posted 09:31, Tuesday 04 February 2014 (9783)
Ace Portable Toilets on site
Looking at QPD amplifier chassis.
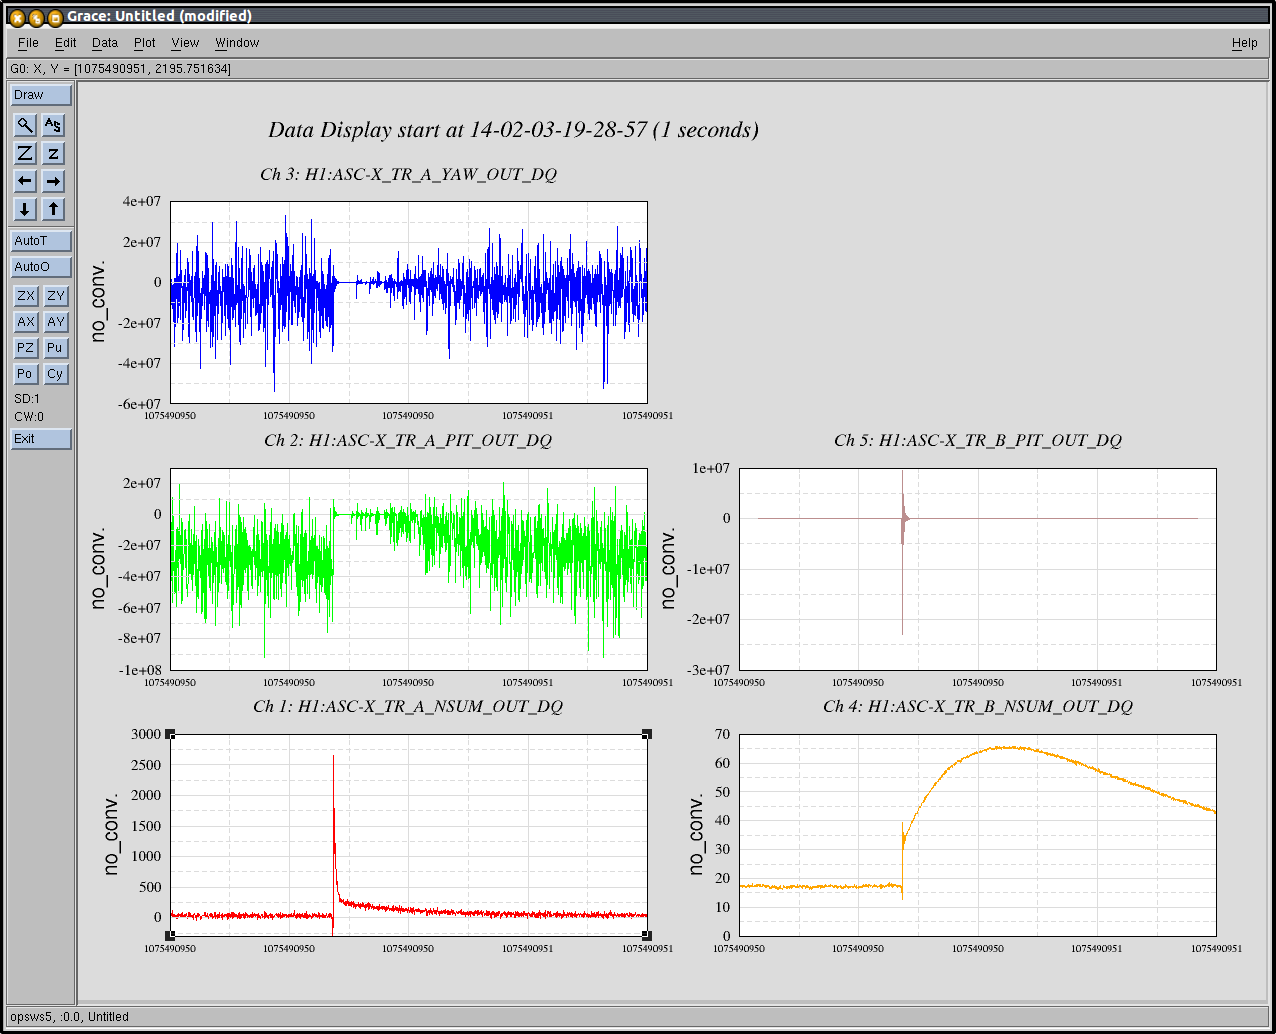
While searching for a flash of IR in TMSX IR QPDs, TR_B looked like it has a very slow low pass filter (attached).
The difference between TR_A and TR_B in the digital world is that the dewhitening (40:0.4) for the fixed whitening is off for TR_A and on for TR_B.
So it seems as if these IR QPDs are without fixed (non-switchable) whitening, but we're supposed to have these.
Later Filiberto will go to EX, open the chassis and change the jumper to get the whitening back.
Update: https://alog.ligo-wa.caltech.edu/aLOG/index.php?callRep=9792
I found the BSC 9 ISI tripped this morning, Stage 1 Watchdog trip, actuator limit was the first trigger.
I also noticed that yesterday morning the ETM reaction mass was misalinged, and -600 coutns offset was added in ETMX M0 Locking filters. I've turned both of these off, but still don't see a reflected beam, so I'm heading to the end station to have a look.
We are back from the end station, the TMS offsets were also off. Also, the ITMX HEPI and ISI were tripped, with a CPS saturation alarm.
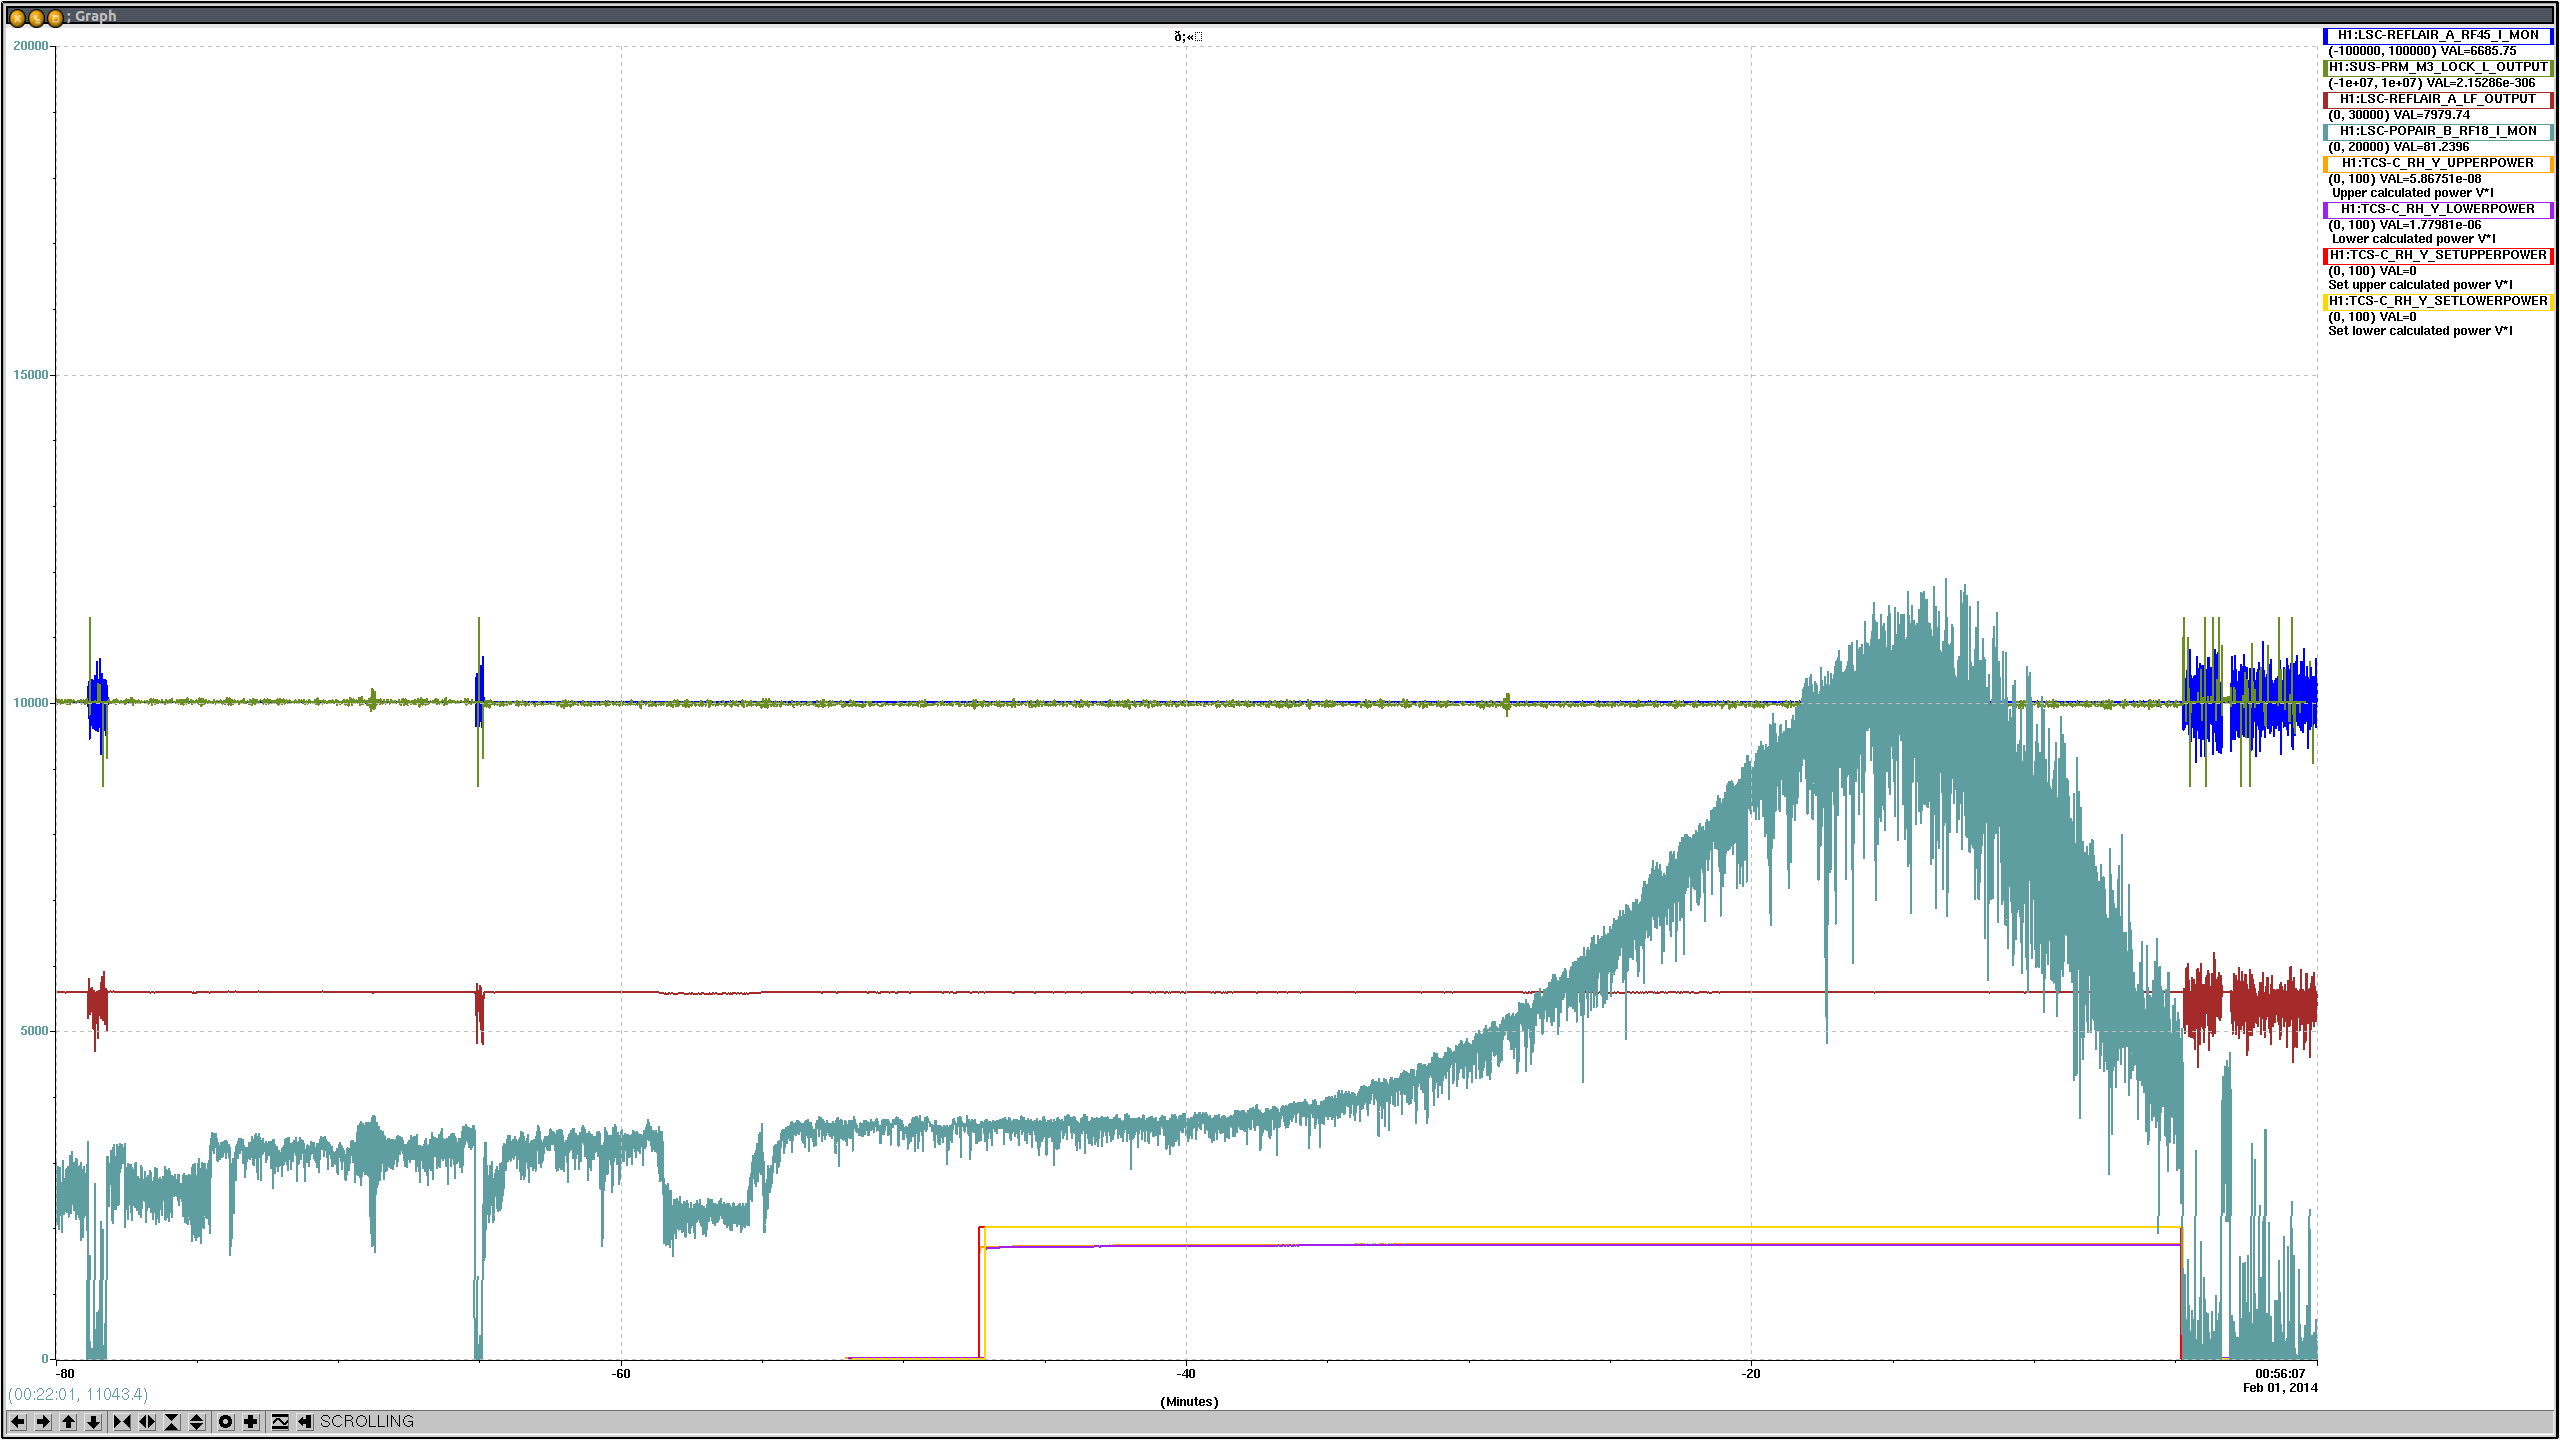
Evan, Kiwamu, Stefan

Tonight we left the PRMI locked, with a dither loop for ITMY, and a sqrt(POB18) gain scaling for MICH and PRC.
The ring heater was set at 0.75W for both upper and lower heater (total of 1.5W). The heat was turned on at 09:13:38 UTC.

The idea of this "low-heat" run is to keep the heating in a regime where the lens strength is roughly linear in the change in build-up. This should give us a good measurement of the lens-strength vs. time.
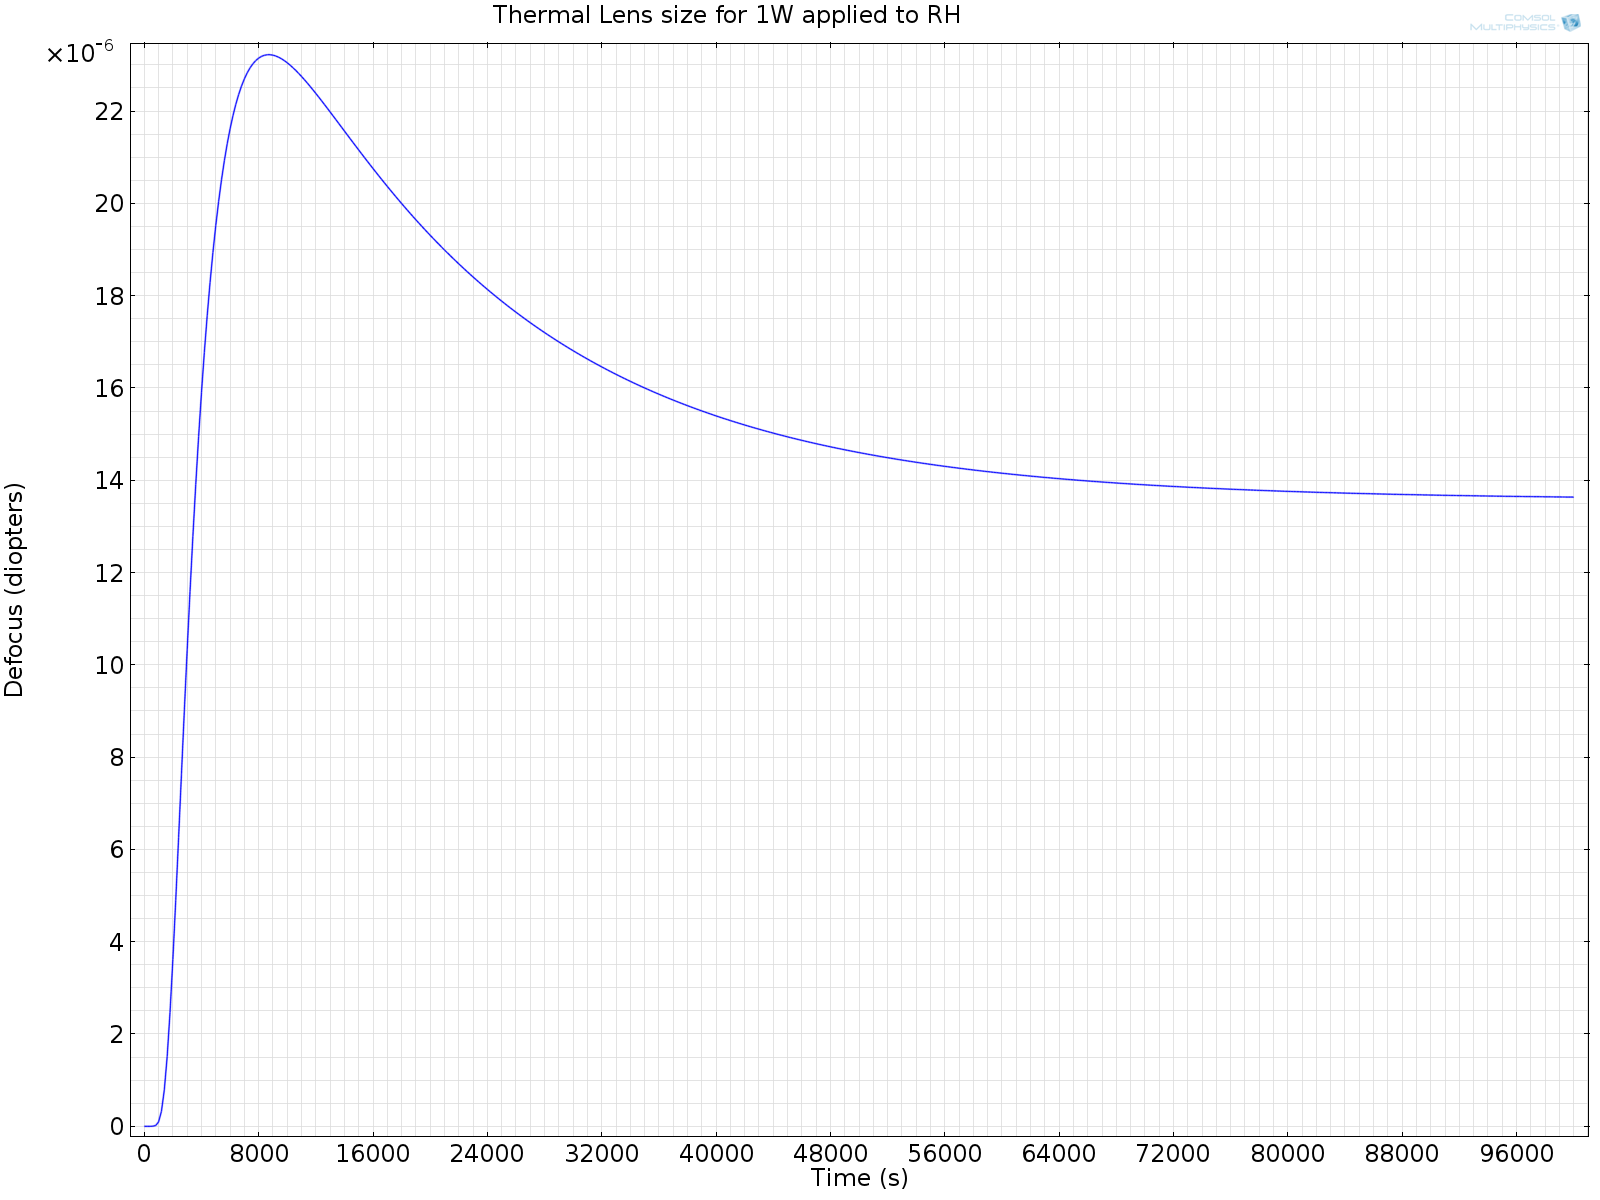
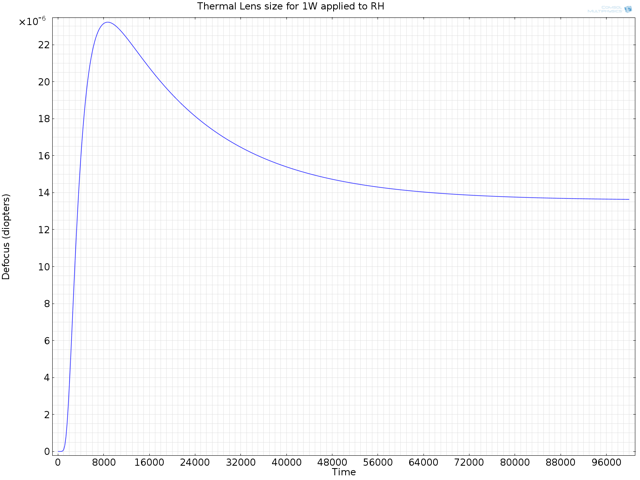
Here's the time evolution of the defocus of the test mass (single pass, thermal lens only, two different x-axis ranges) in response to a 1W step function in ring heater power at t=0s.

Evan, Kiwamu, Stefan

Today we tried to measure the PRC cavity length using the single-shot time-delay method. Despite an estimated accuracy of about 2mm, we only achieved a precision of about 1cm variation between measurements.

Measurement details:
- We put a 3400Hz, 7.5V (25000cts using LSC-EXTRA) signal into the IMC offset.
- We intentionally detuned the modulation frequency to generate maximal AM at 3400Hz in the mode cleaner.
- We then demodulated this signal after a single bounce off the PRM, ITMX and ITMY respectively to get a time-of-flight measurement.
- Before we started we made sure the REFLAIR demodulation was exactly 90deg (with an error of about 1e-3deg), and the relative gain was balanced to 1 part in 1e4. We achieved this by adding a 45MHz band-pass into the PD RF path of the demodulator (to get rid of any higher harmonics contributions), and then adding a test signal exactly 3.4kHz offset. Using this test signal we balanced the gain and phase response. All this was done at a fixed whitening gain. (The 45MHz band-pass was taken out again at the end of the measurement.)
- With this setup we achieved a phasing precision for PRM of about 0.02deg, and about 0.1deg for the IMTs. However there were large q-offsets, so we had to be careful to tune the audio-demodulation phase for the 3.4kHz signal. Probably our biggest systematic error came from this.
- From the measured phase difference we can calculate the expected PRX length (and PRY and Schnupp length in the same way) using the following script:

MATLAB script to calculate the length:
f=9099483; % sideband frequency
c=299792459;
lambda=c/5/f;
degX=-9.356;    % demodulation phase for ITMX
degPRM=-10.311; % demodulation phase for PRM
dX=degPRM-degX;
Lx=(17.5+dX/360)*lambda/2

- To verify the result, we then calculated the frequency which should be exactly anti-resonant, and repeated the measurement. Unfortunately the results only were good to about 1deg in phase difference, or about 1cm:
      f (Hz)  PRM phase   ITMX phase   PRx length   new f (Hz)
1st) 9101734   73.87deg    72.311deg    57.6557m     9099483
2nd) 9099483  -10.311deg   -9.356deg    57.6469m     9100863

The two results disagree my 8.8mm. While we did measure PRY too, we had different whitening gain settings for PRM and ITMY, so we didn't trust those numbers.

We did however measured the Schnupp-asymmetry using the same technique: we got 8.9cm for Lx-Ly. Again, this number probably has about 1cm of systematic error.

For reference, the design PRC length is 57.6557m (T1000298). With an 8cm Schnupp-asymmetry we expect PRx to be 57.6957m.
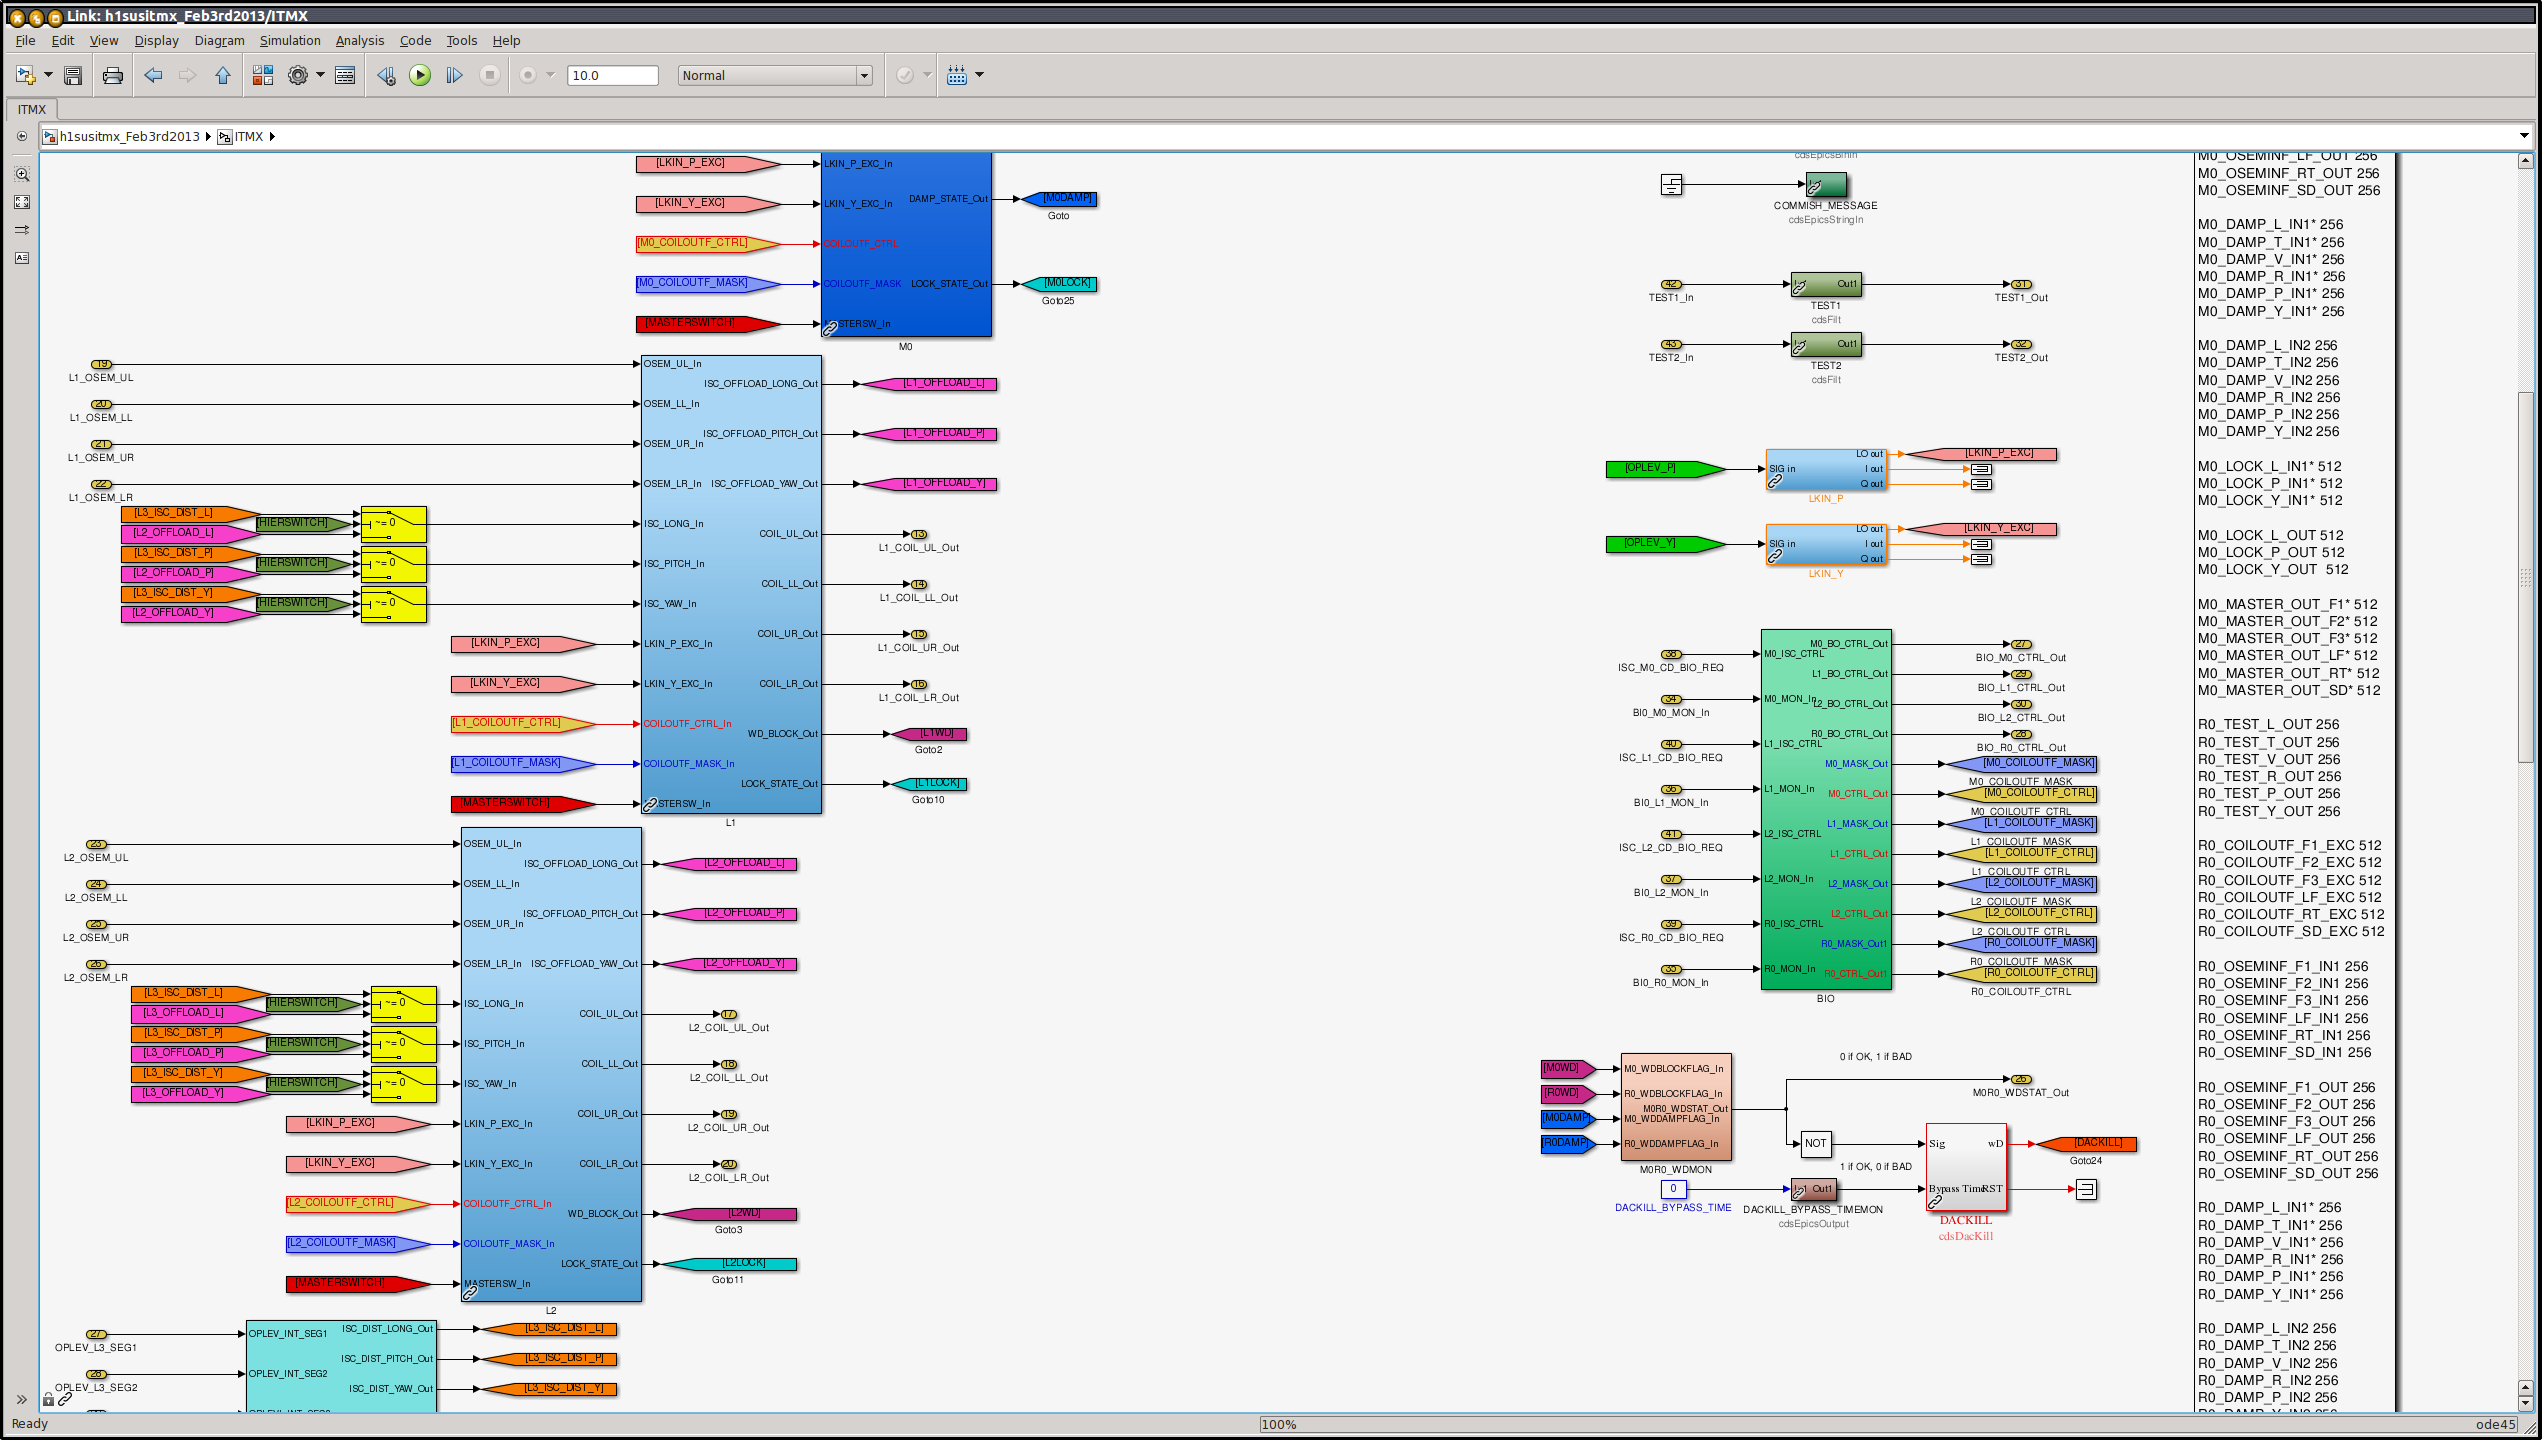
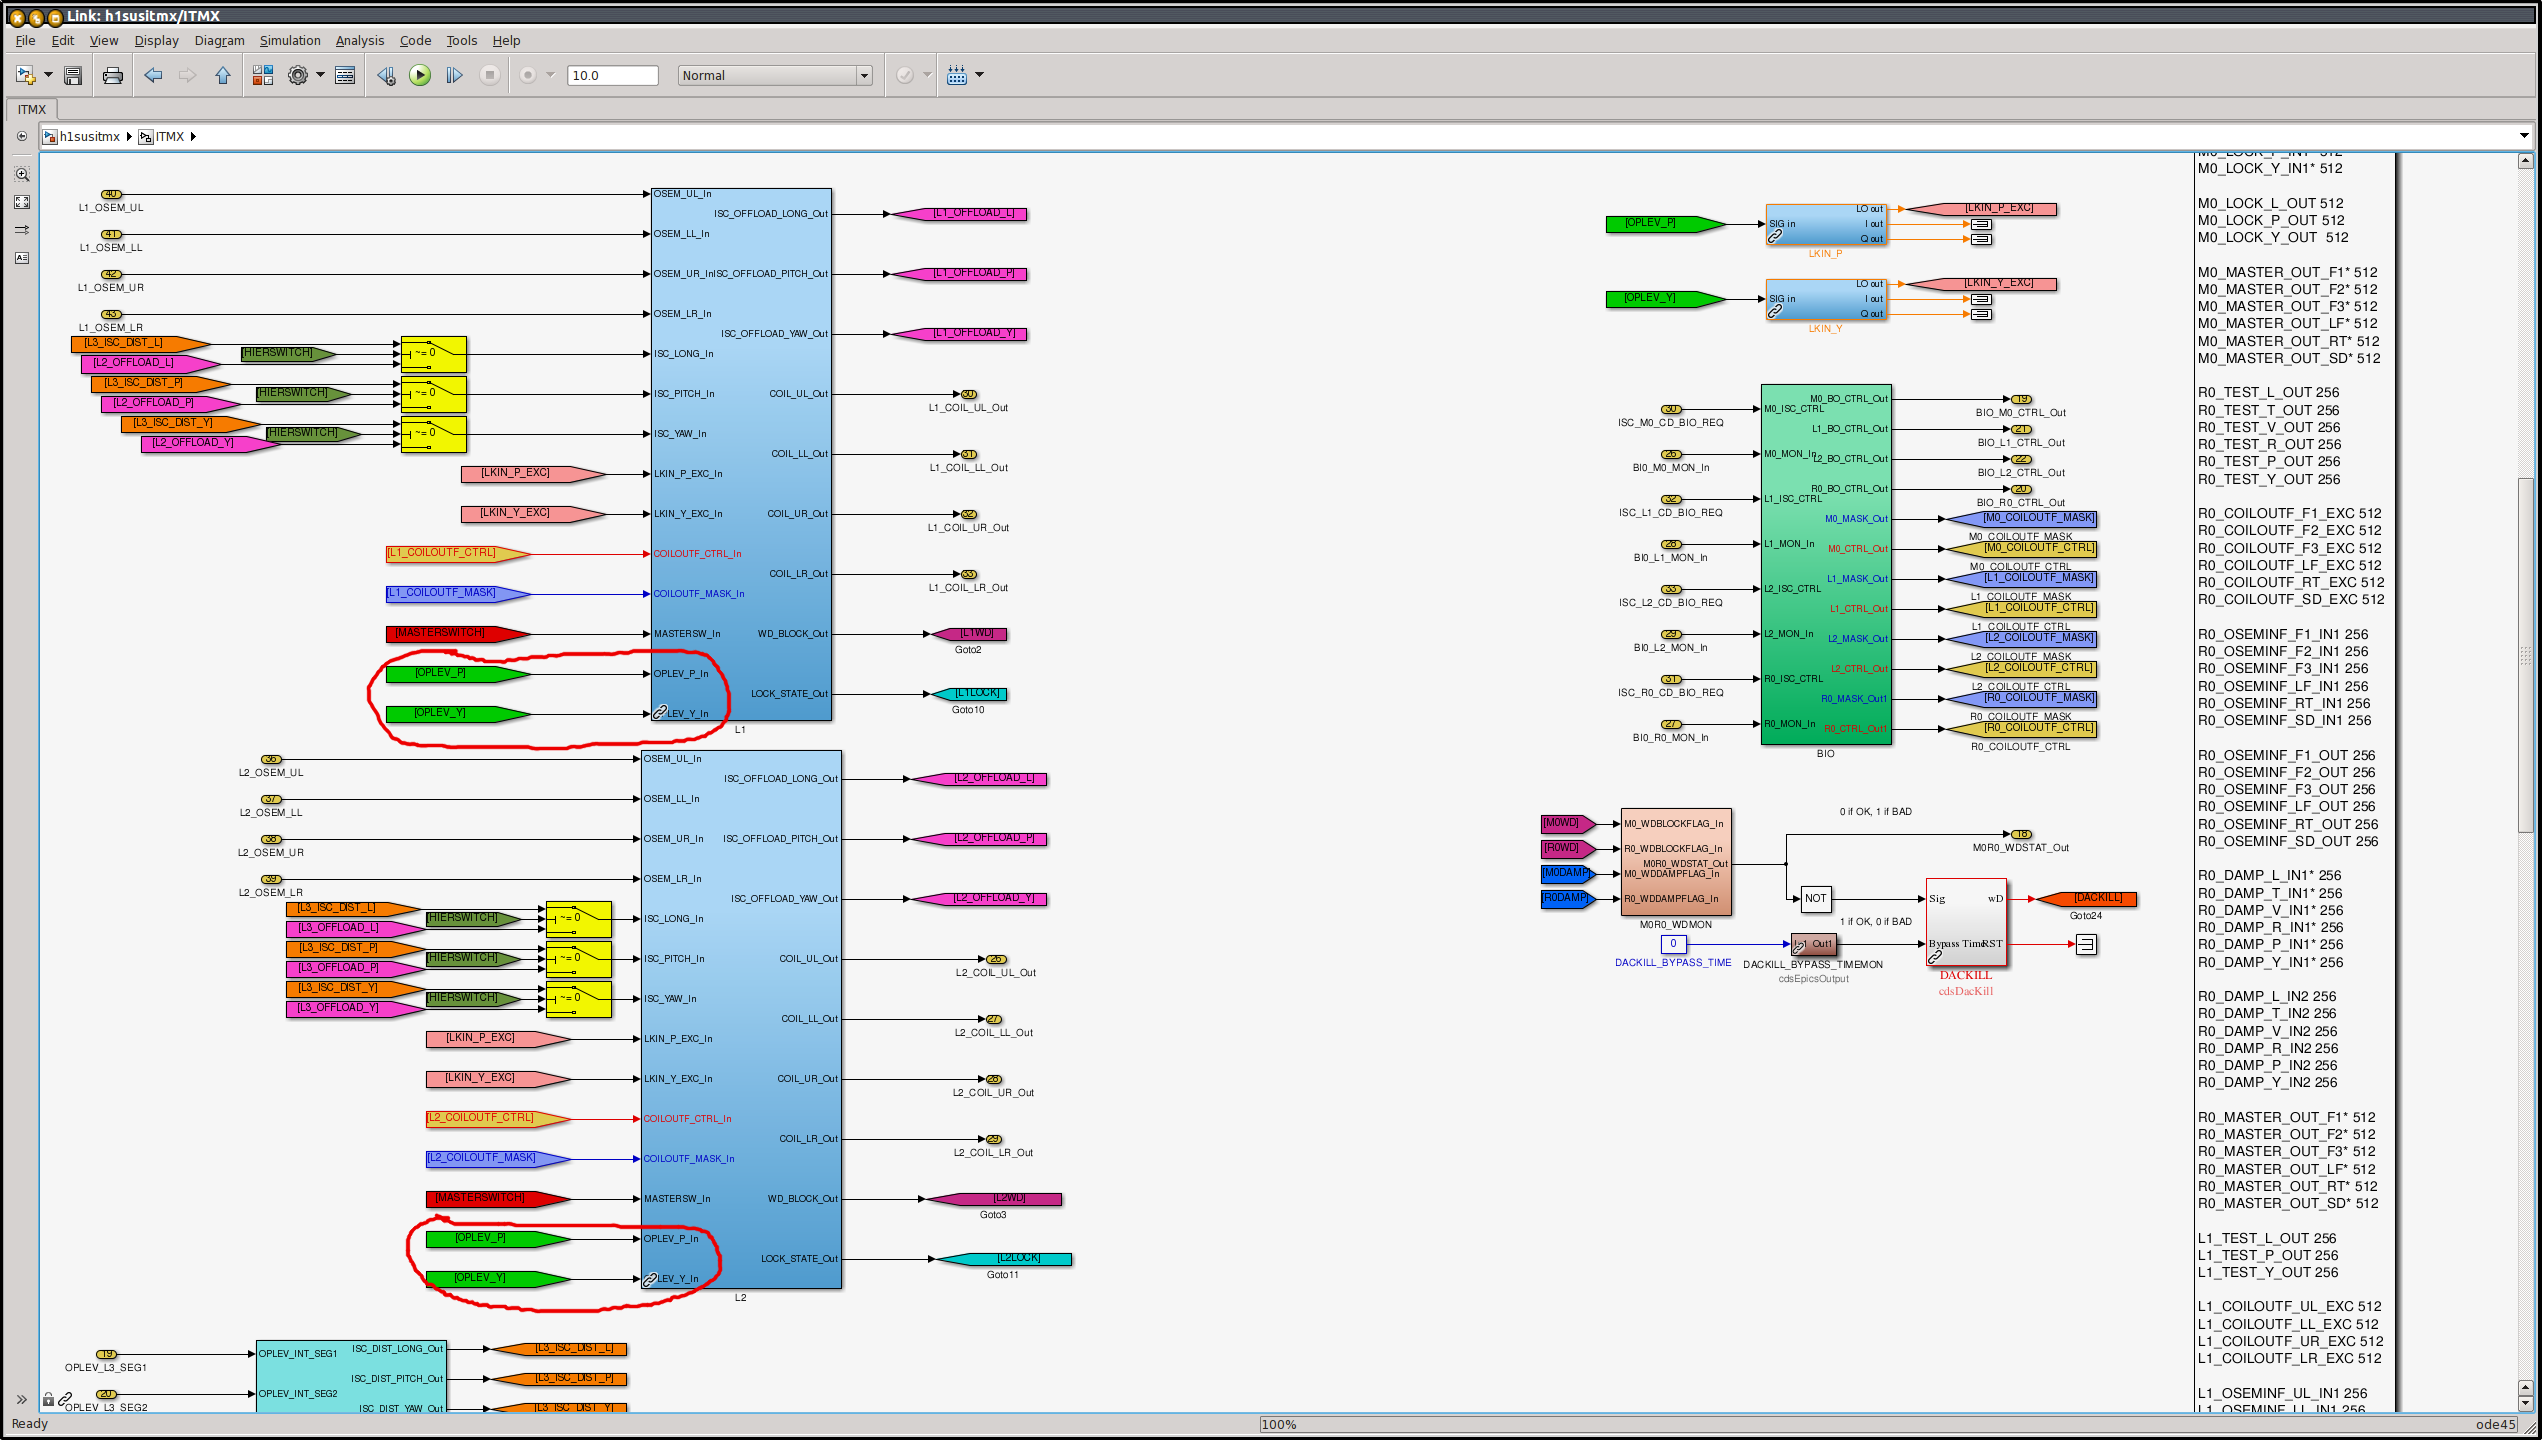
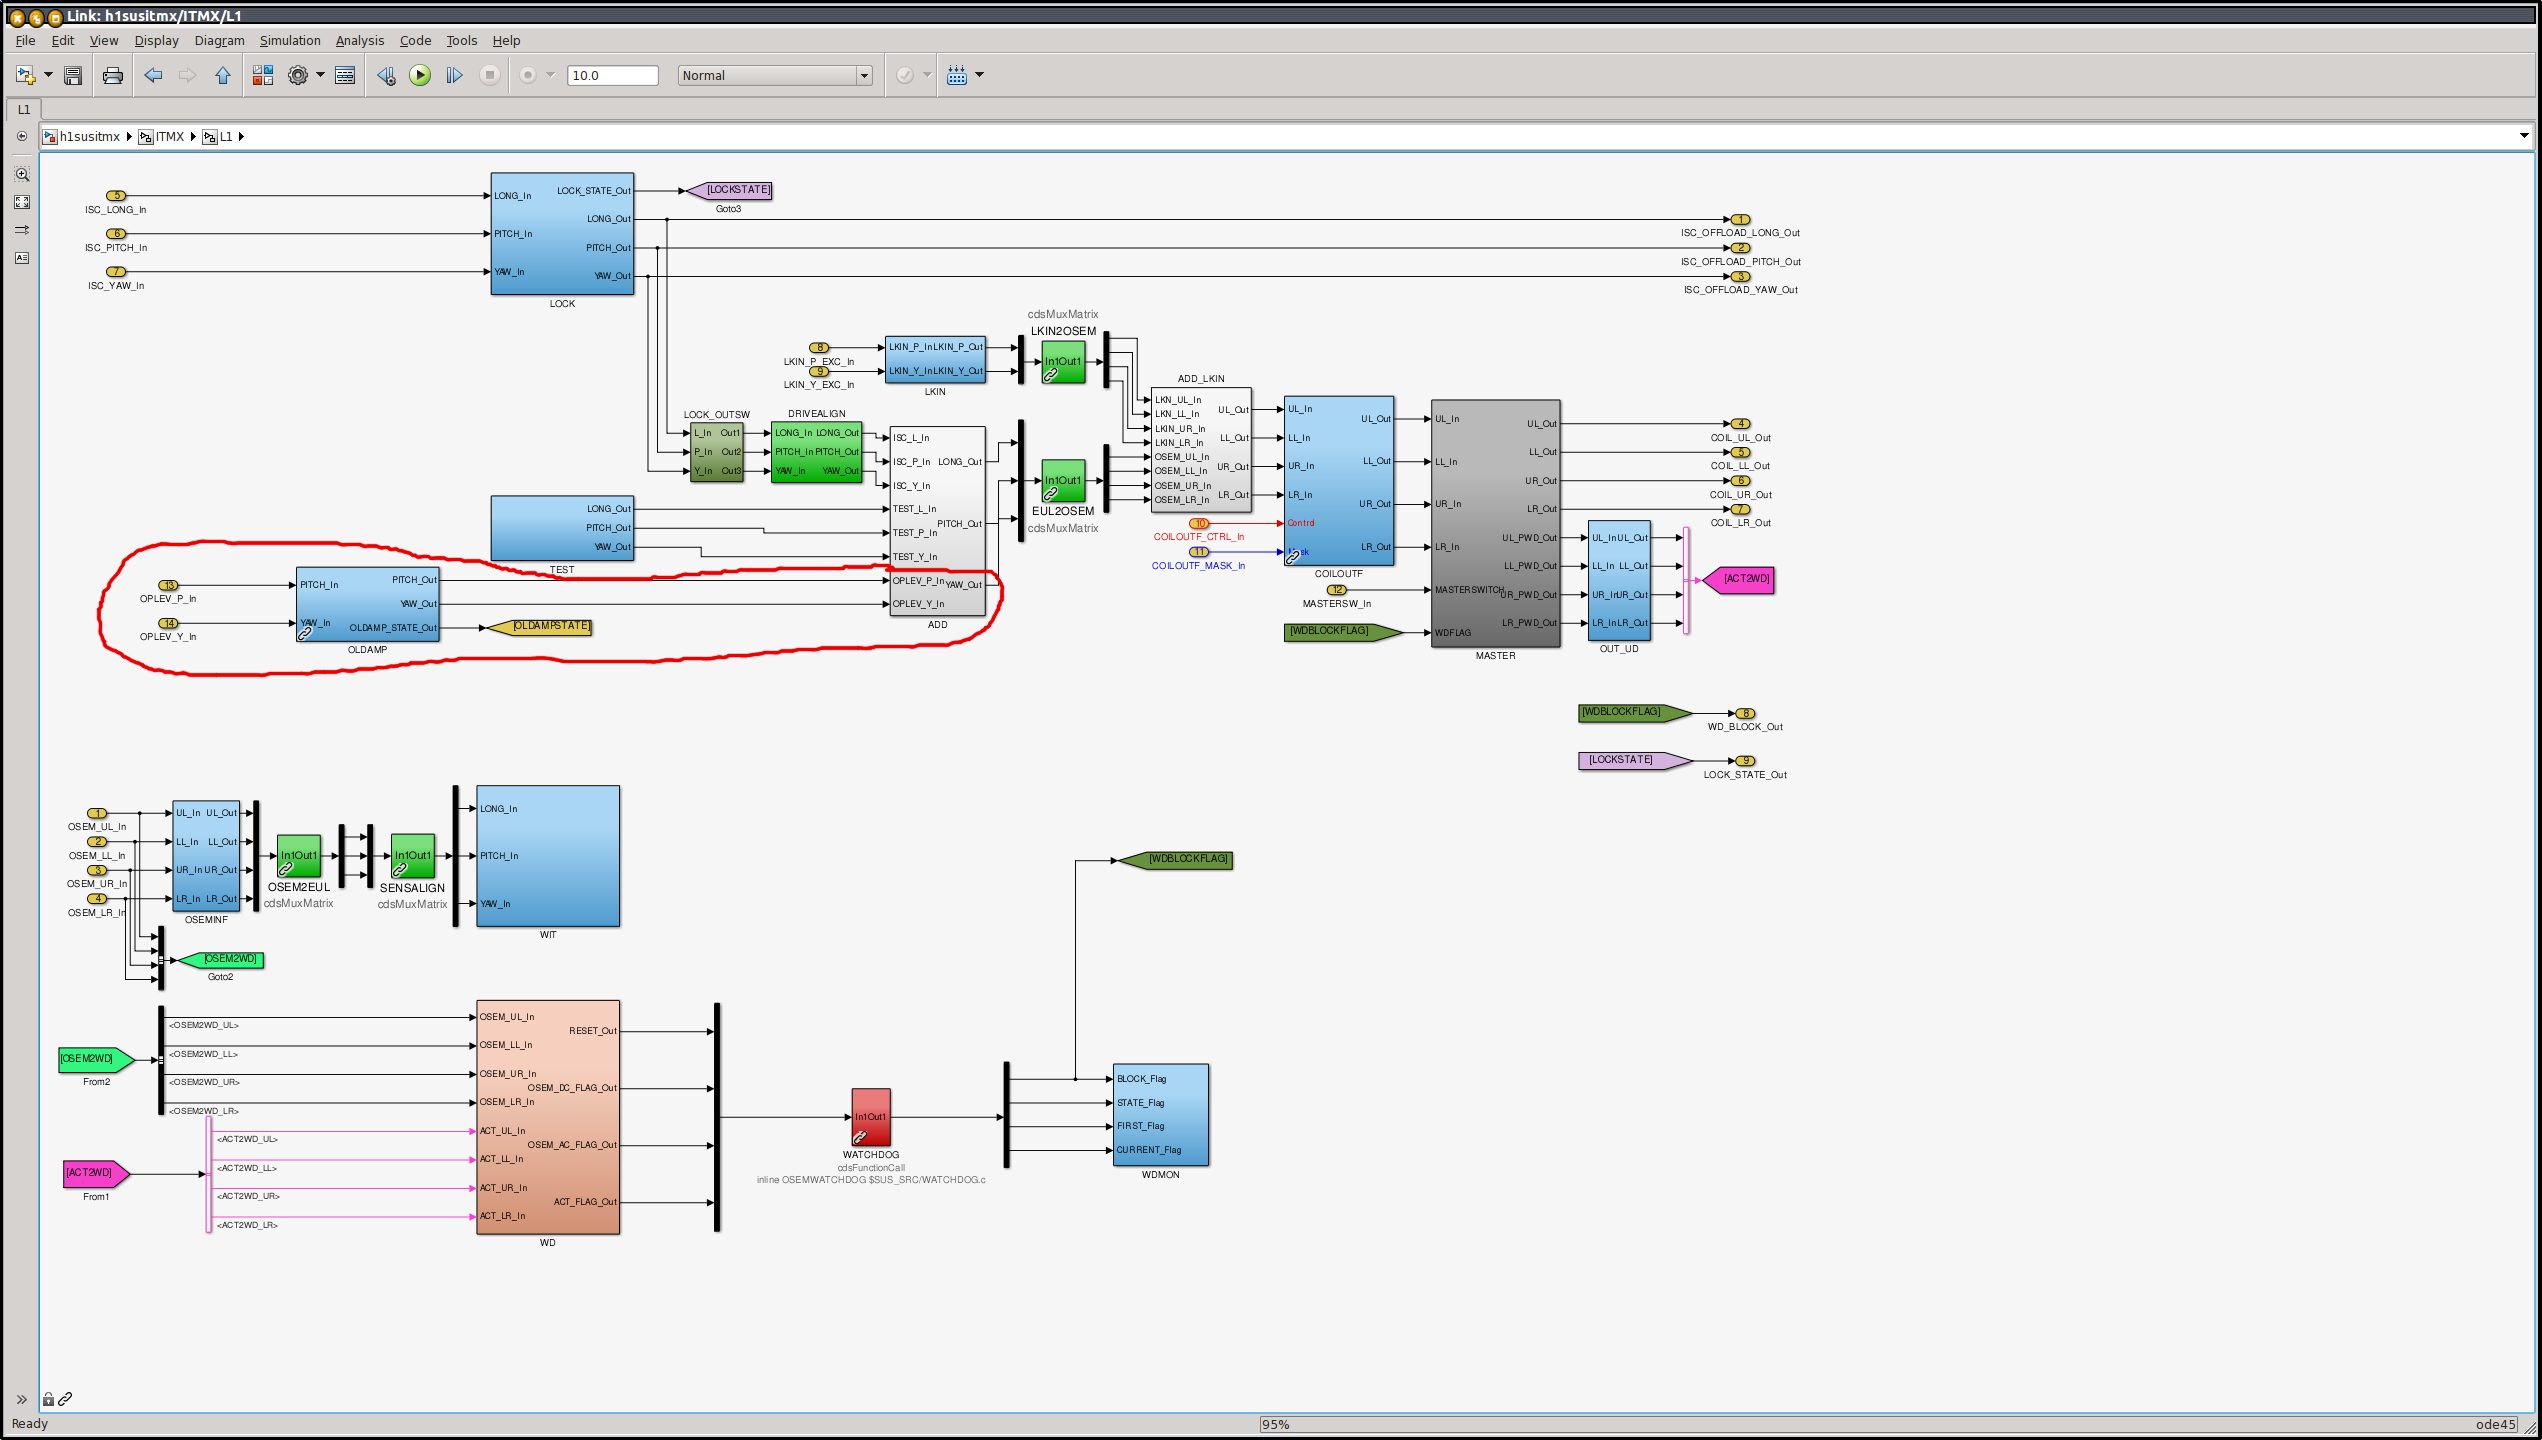
As we might need feedback loops from the optical lever to stabilize the motion of the test mass of ETMX and ITMX, the simulink models were temporary modified to include a link from the optical lever to the PUM and UIM masses.
This was done by copying over what has been done for the beamsplitter optical lever :
FOUROSEM_STAGE_MASTER.mdl was modified to include two oplev inputs going through the OLDAMP filter bank (copied from BS). cf FOUROSEM_STAGE_MASTER_before/after.png.FOUROSEM_STAGE_MASTER_oplevfeedback.mdlQUAD_MASTER.mdl was also copied and renamed QUAD_MASTER_oplevfeedback.mdl and points to the new FOUROSEM_STAGE_MASTER_oplevfeedback.mdl part for L1 and L2 stages (cf QUAD_MASTER_before/after.png)
A backup of the models h1sus{etmx/itmx}_Feb3rd2013.mdl was made under /opt/rtcds/userapps/release/sus/h1/models

I missed a few alogs explaning some modifications on the models. so here's the current status :
Today I used the nanoscan to measure the ITMX direct reflected beam size that makes it through the REFL path onto ISCT1.
I had previously done some more preparation for this measurement (since aLOG entry 9633), measuring the ITMX direct reflected beam power again on ISCT1 to be 31.6uW. This time the green beam was misaligned at the TMS, so was not coming through the X-arm. Also, ITMY was misaligned, and ETMX was misaligned, so there shouldn't have been anything that was adding to the measured power. It seems that either the green light, or X-arm flashes were contributing to the ~50uW I measured last time.
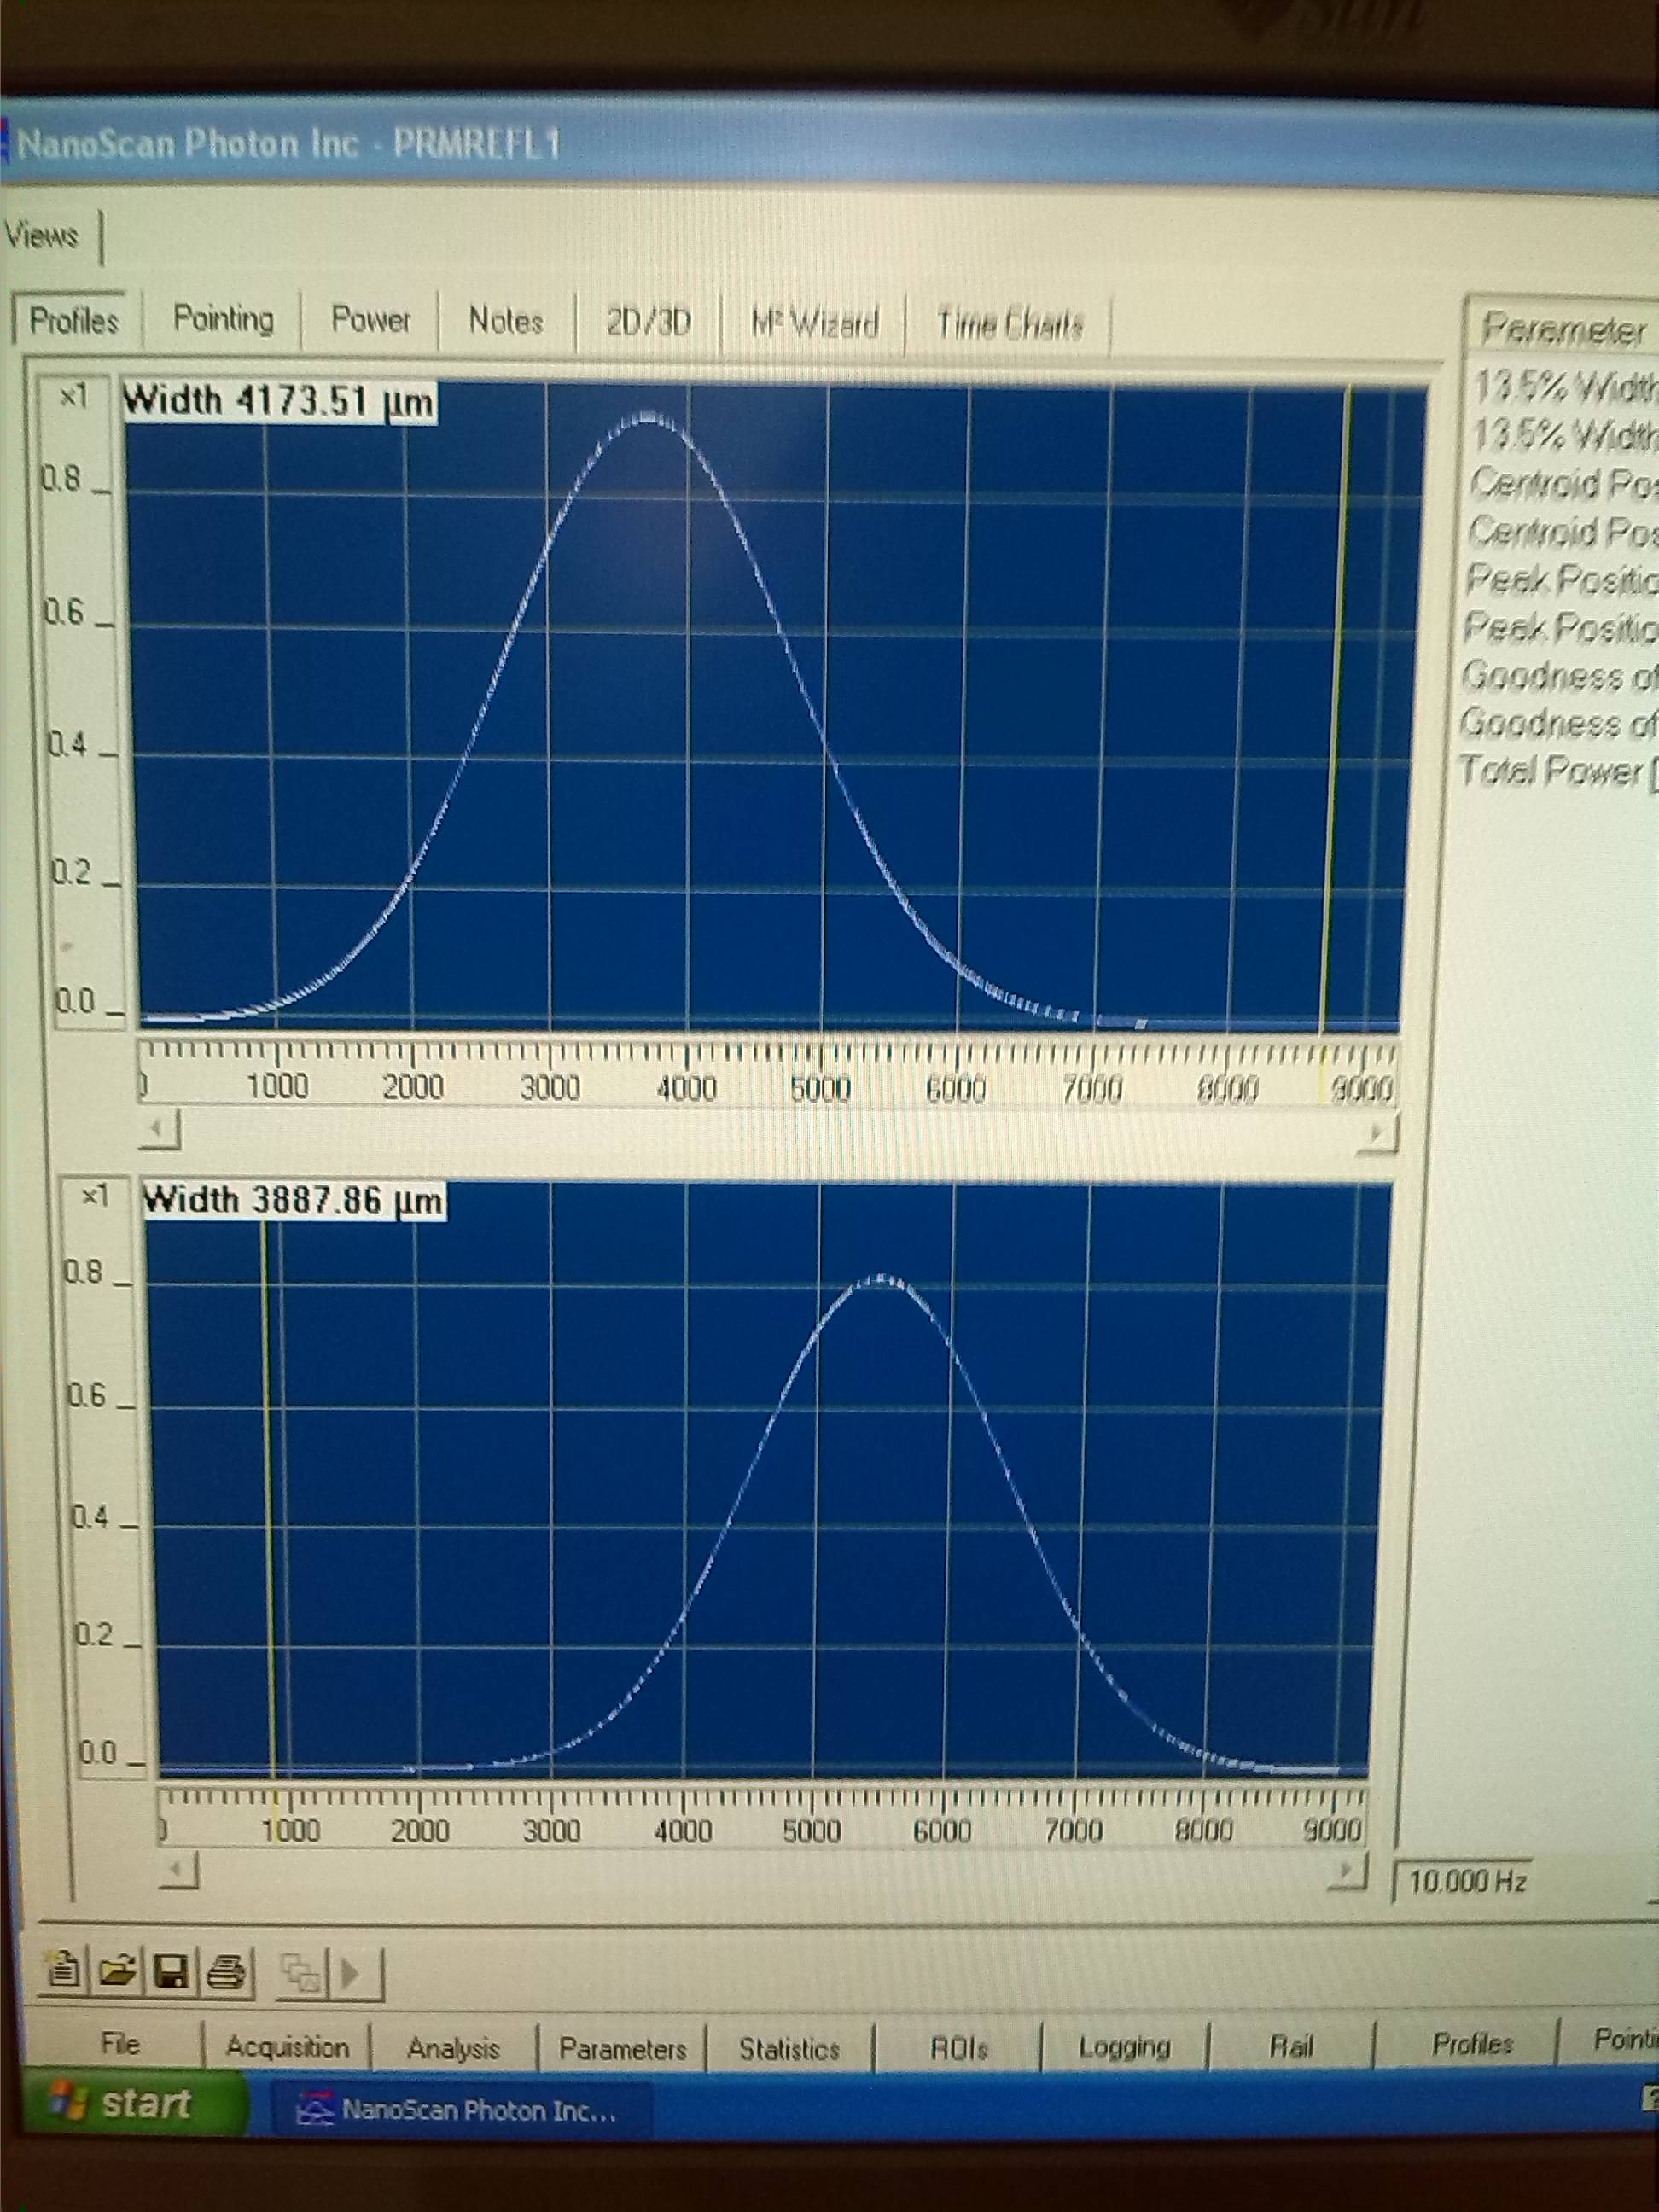
At the same time, I measured the PRM direct reflected beam size using the nanoscan. However, the capture settings I used for logging the data were probably not ideal for this measurement, so I would like to retake this data at some point. In any case, the preliminary measured PRM direct reflected beam sizes were wx=1949um and wy=2094um. These can be compared to the numbers I expect from my model: wx=2170um and wy=2138um.
At this time I tried taking a measurement of the ITMX direct reflected beam, but the nanoscan software kept complaining that the detector was "saturating". At 30uW this seemed unlikely to me, but it prompted me to turn off frame averaging. As soon as I turned off the averaing I saw that the beam was swinging around on the nanoscan, with peak to peak motion of roughly a beam size. This seemed like too much motion to get a decent measurement so I decided to wait until we had some quieter optics in the path between ITMX and ISCT1.
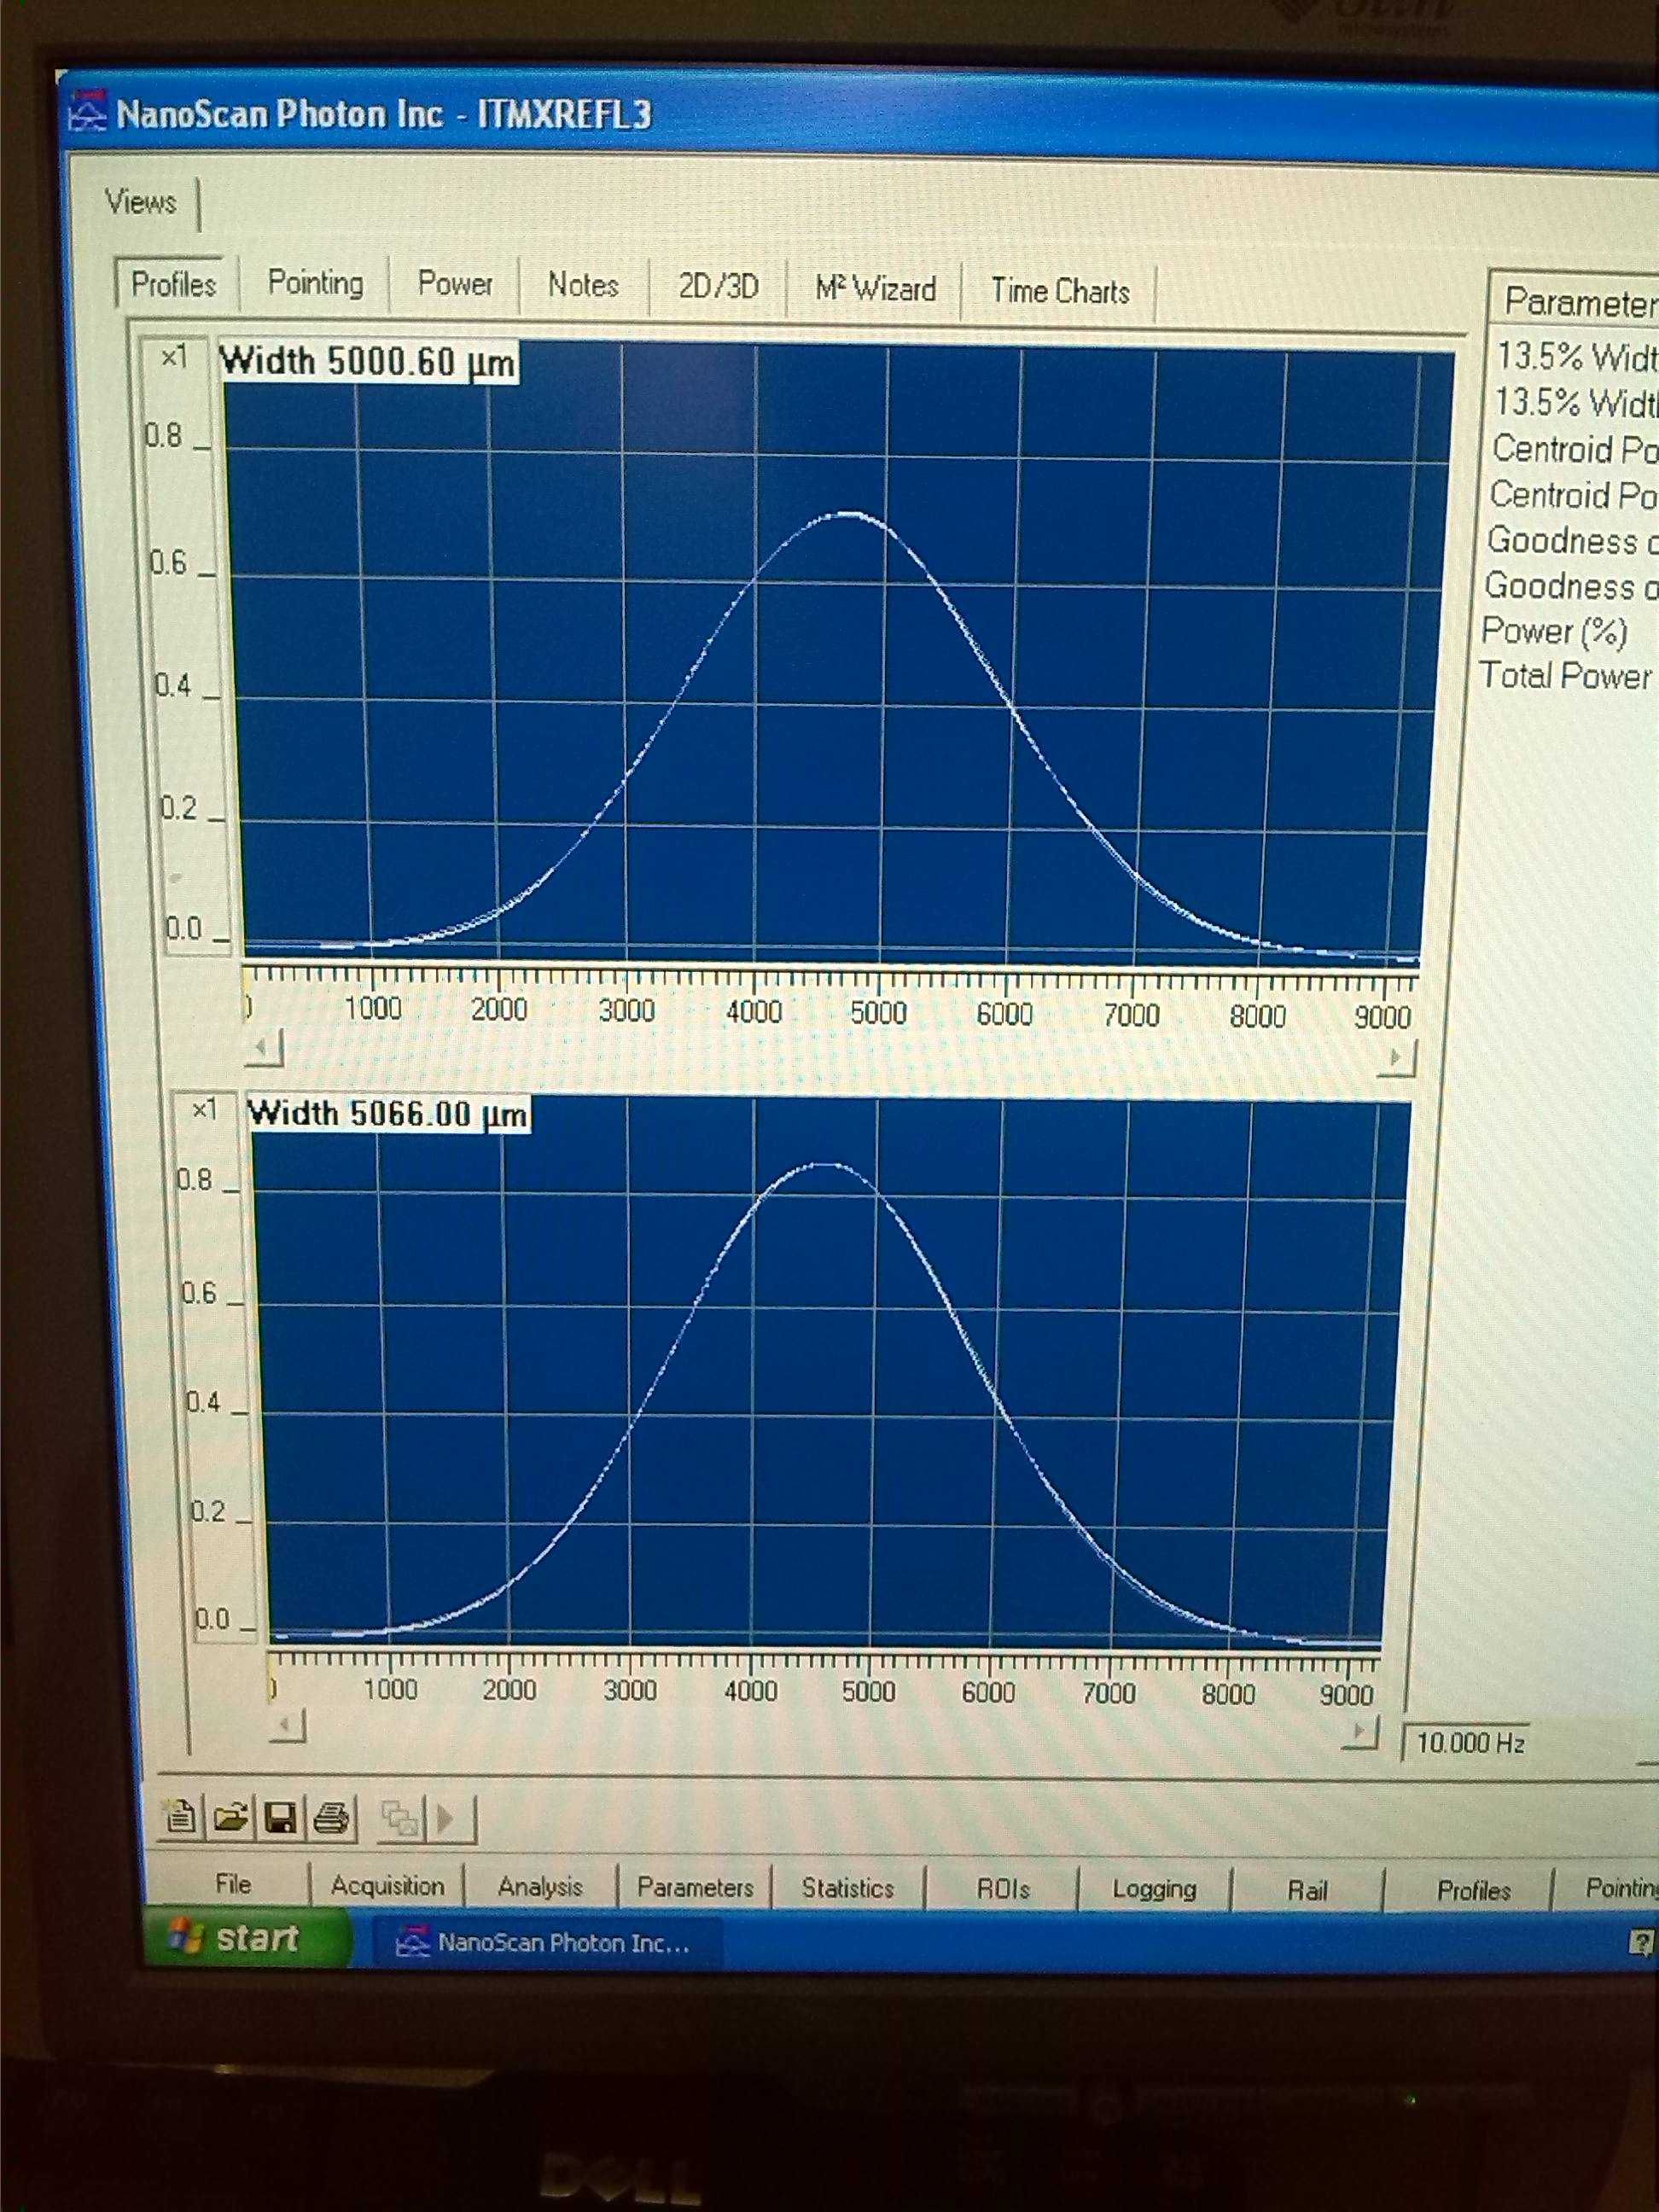
Today I went back into ISCT1 and looked again at the nanoscan data for the ITMX direct reflected beam. The ALS beam was misaligned at TMS, ITMY, ETMX and PRM were all misaligned. The beam motion seemed significantly less for the most part, although I did see it go through quiet and loud times. I logged data at 10Hz for around a minute, which I then averaged offline to get ITMX direct reflected beam sizes of wx=2525um and wy=2510um. The attached plot shows the beam sizes at this location that I expect from my model, for a range of different ITMX lens cases and PR2-PR3 distances. In the cold state, I expect that the ITMX direct reflected beam sizes should be on the cyan line. A naive interpretation at this stage is therefore either that the PR2-PR3 distance is longer than designed, or the ITMX on-thermal lens is weaker than we thought, but there are many variables which still need to be accounted for.
I did a little more analysis on the nanoscan data, and saw that the beam position data and beam radius data appeared correlated. This might be expected if the beam swings across the aperture during a scan, thus "smearing" the intensity over a wider distribution. In this case I would expect to see a 90deg phase lag between position data and beam size data, although that might be neglecting some specifics of how the slit is scanned across the PD. The two attached screenshots show the Gaussian fits for the PRM direct reflected beam and ITMX direct reflected beam. I also attached time series of the y-position and radius (which shows the correlation quite clearly).
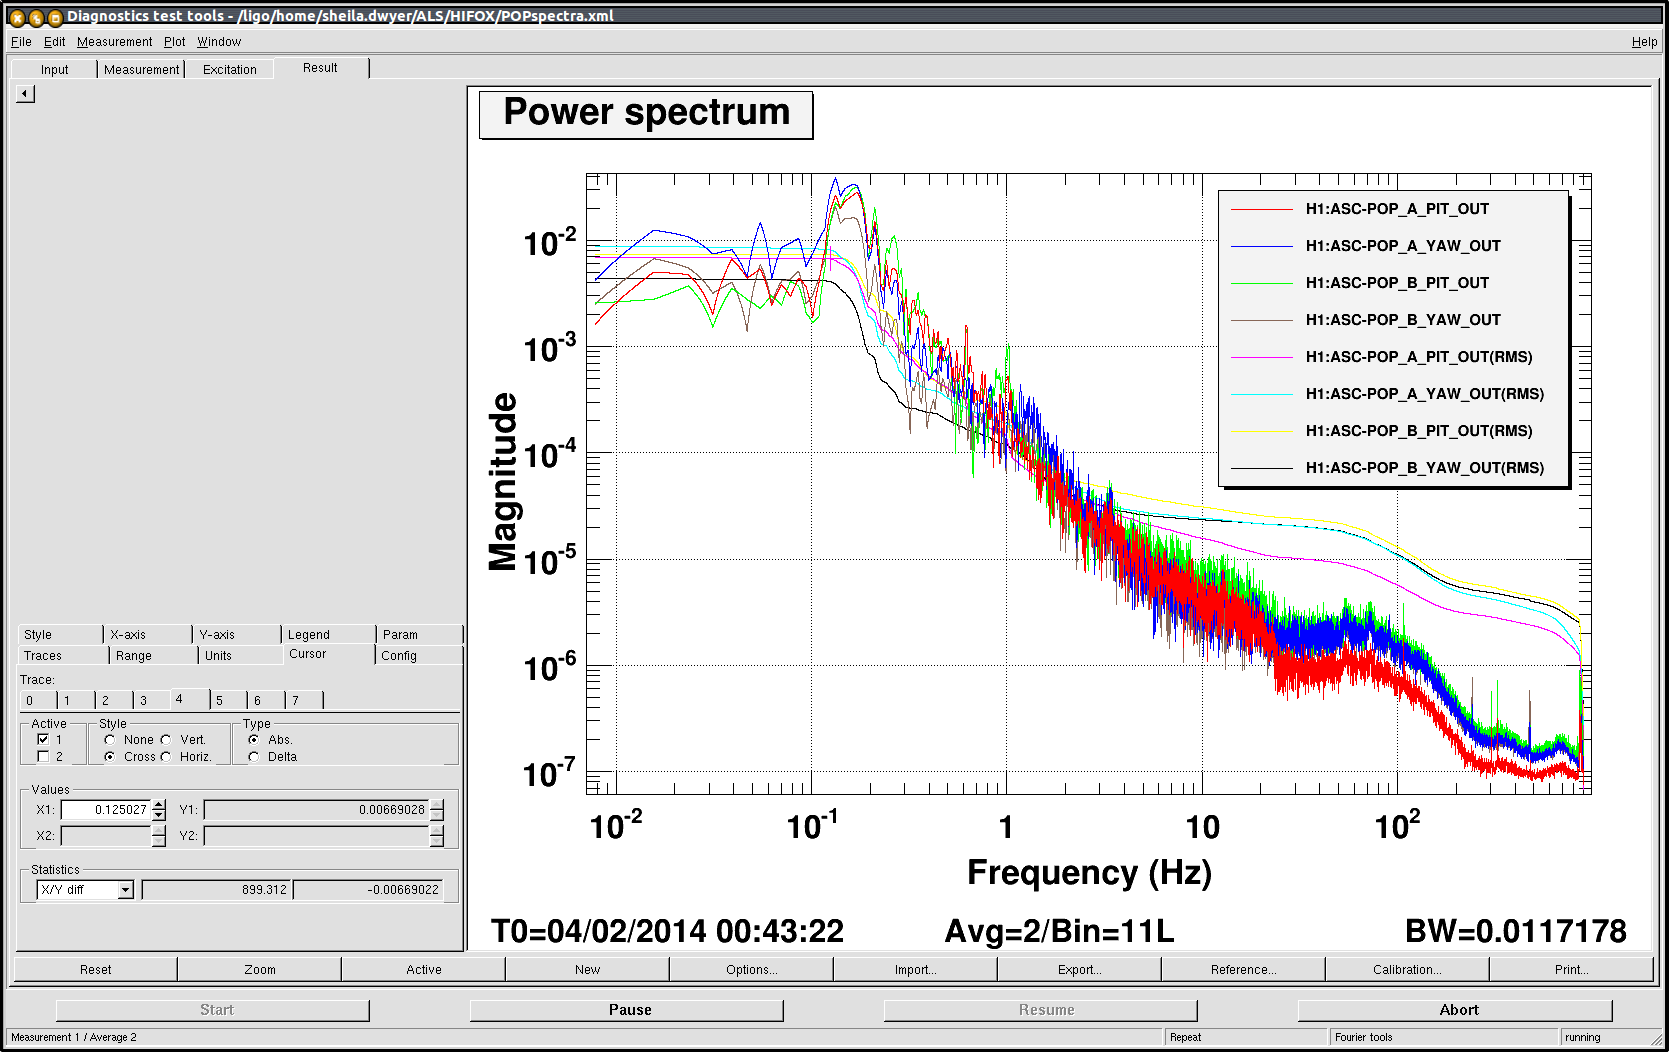
Finally I did some frequency analysis on the data, as shown in the attached ASDs.
In pitch there seem to be two main peaks, at 0.717Hz and 0.95Hz. Another peak appears at 1.167 Hz. The closest suspension pitch mode I can find to the 0.717Hz peak is 0.745Hz pitch mode from the HLTS. HSTS pitch mode at 0.6725Hz is also in the ballpark. The 0.95Hz peak is quite close to the HLTS yaw mode at 0.99Hz, and 1.167Hz mode is close-ish to the HSTS yaw mode at 1.09Hz, but I don't see any pitch modes matching up there.
In yaw there seem to be two main peaks. One again at 0.95Hz, and one at 2.267Hz. The 2.267Hz peak matches up pretty closely with the 2.253Hz BS yaw mode. I didn't see any Quad modes matching the peaks, so it seems that ITMX is not causing the motion.
In the top panel of the attached, red is the ETMX OL PIT, pink is the dark noise (this is ETMX OL PIT when there's no light on the OL, but a fake offset of 9900 counts was applied to OL SUM so the scaling of red and pink become the same).
The RMS of the red line for f>0.1Hz is about 0.15urad (that's about 0.5 urad pk-pk). The dominant hump at 0.4-0.5Hz is about 0.12urad RMS, but it seems like the microseism is adding another 0.9urad RMS, resulting in sqrt(0.09^2+0.12^2)=0.15urad RMS.
Dark noise is well below the PIT signal up to a few Hz.
Green is the OL SUM normalized by OL SUM DC, and then scaled by H1:SUS-ETMX_L3_OPLEV_PIT_GAIN. If the green stays on top of the red for some frequency band you'd be suspicious that the OL quadrants are measuring some noise that is incoherent across the quadrants (shot, dark), but that's not the case.
So OL seems to be measuring the angle at least for f<1Hz, probably we don't have to worry too much about injecting more noise than we want by using OL damping. Even if the actual PIT noise floor is as big as green (which is not likely), the RMS due to noise injection is not bigger than brown dashed curve.
OTOH, at least for the time when the measurement was done, it seems like the damping for 0.4-0.5Hz hump is not good enough, microseismic should be attacked too.

Commissioners remain in the control room. Earlier, Richard went to EX to investigate the dust monitor that Patrick reported below. The DM's behavior remains unresolved.
Doug and Jason are out of EY, leaving the station in laser hazard.
With uncontrolled position/controlled target differences of 10 & 13urads in Rx & Ry, the turn on of HEPI rings up the trilliums and makes ISI turn on (especially when HEPI trips) not one button. Are these tilts really needed?
Andres, Scott, & Jeff

   The H1-SR2 suspension has been installed in HAM4. No significant issues or problems were encountered during the installation.

   A big thank you to the Apollo crew for all their support with the prep work and the installation.
(Alexa, Sheila, Stefan, Evan)
Using the picomotors, we have centered the beam onto both POP A and POP B QPD. For reference... with a whitening gain of 45dB, H1:ASC-POP_A_SUM_OUTMON = 11450 cnts, H1:ASC-POP_B_SUM_OUTMON = 10436 cnts.
We have also calculated how many counts we expect on each quadrant: We have 8.8W into MC. There is 15% loss due to input optics losses (IMC and faraday), 3% transmission of PRM and 230ppm from PR2. This gives about 6.4uW for each quadrant of the QPD. With a responsivity of .8 A/W, a transimpedance of 1kOhm and a gain of 45dB, there is 1V on each quadrant. This amounts to about 3000 counts on each quadrant, which is consistent with what we see.
Once these were centered we wanted to get a (rough) calibration of the PIT and Yaw in terms of beam radii. To do this we moved the IM4 alingment slider until the QPD sum dropped to half of its centered value, then moved IM4 back until the sum reached it maximum again. This gives us an approximation of the beam radius in units of counts on IM4 slider. (for PIT, QPD A hwhm =1600 IM4 PIT, QPD B hwhm=1720 counts IM4 PIT).
Then we returned IM4 to its original alingment, (so the beam was again centered on the QPDs) and measured the response of the QPD PIT and YAW to moving IM4. We saw:
For the calibration of PIT and YAW in beam radii we get:
This is only rough.
We also saw that the QPDs are about 1.8 times the size of the beam
Attached are spectrum of the POP QPDs, and RMS, not calibrated. You can see that the beam motion is a small fraction (less than 1%) of the beam radius, so input beam motion (at PR2) is not the cause of our difficulty aligning the IR into the arm.
Stefan, Kiwamu
The PRMI lock is now quite solid. After we engaged a dither alignment system for ITMY, we turned on the ring heater on ITMY with a hope it is going to improve the mode matching.
We lost the lock after about 50 minutes.

Below are Aiden's plot and remarks:

I've attached some plots of thermal lens vs time for a RH running at 1W.

The slope of the linear section, dS/dt, from t = 2000s to 3000s is 6.75E-9 diopters per second per Watt.

The final steady-state defocus, S_steady, is about 13.75E-6 diopters. In the initial state, it takes t_S_steady1, 2037 (= 13.75E-6/6.75E-9) seconds to reach assuming an immediate and linear increase in defocus,
t_S_steady1 = S_steady/dS/dt

....

In other words, the 20W/2.1x = 9.4W should give the maximum mode matching after 2037s of linear increase in defocus AND in the steady-state.

I modeled the 18MHz sideband buildup in the H1 PRMI as a function of ITMY Rc to see how it compared to the observations made recently. The attached plot shows POP 18MHz I and Q signals over ITMY Rc. The leftmost side of the plot is for the measured value of ITMY Rc from the nebula page, with no ITMY substrate lens, and the measured value of ITMX Rc from the nebula page with an -80km substrate lens. MICH was locked using REFL45Q and PRCL was locked using REFL45I. The POP demod phase was tuned to minimize Q-phase signal at the starting ITMY Rc value. The input carrier power in the model is 10W, the 9MHz modulation depth is 0.1, and the 45MHz modulation depth is 0.07. No optics after the PR2 transmission were included in the model.
As expected, the buildup increases as PRX and PRY become better matched. In the model, the buildup increases to a maximum of around a factor of 10 from the initial value. This is a much larger increase than was seen in the experiment. This could be because the model does not include clipping at the BS, which would increase as the beam sizes increase (see lower panel of the plot). Also, it is possible that ITMY has a non-thermal substrate lens (no measurement data is available for this), putting it closer to ITMX in the no-ring-heater state. Beyond the maximum, the PRMI quickly becomes unstable. This may explain the lock loss in the experiment past the maximum POP18 buildup (though many other things could too).
I made a calibration of the IM4trans and MC2trans SUM channels into uW.
The conversion from W incident on the PDs to counts registered on IMC-IM4_TRANS_SUM_OUTMON is as follows:
[counts/W] = responsivity [0.16 A/W] x transimpedance gain [1000V/A] x differential to single input gain [2V/V] x whitening gain [36dB=63.1 V/V] x ADC gain [1.6384x10^3 cts/V].
This is actually the same for both MC2trans QPD and IM4trans QPDs: 2.087x10^9 [counts/W]
I used this calibration factor to calculate the power on IM4trans and MC2trans currently:
IM4trans counts ~= 57890 counts, which converts to 1.75mW. Comparing this with the expected power on IM4trans:
8.73W into IMC * 0.85 IO throughput * 2400ppm IM4 transmission * 0.1 transmission of BS between IM4 and IM4trans QPD = 1.78mW
MC2trans counts ~= 2.17x10^4 counts, which converts to 655uW. Comparing this with the expected power on MC2trans:
8.73W into IMC * (IMC gain = IMC Finesse/pi = 166 ) * 5.1x10^-6 MC2 transmission * 0.1 transmission of BS between MC2 and MC2trans QPD = 740uW.
Both these estimates for the power incident on each PD agree pretty well  so I'll go ahead and add a new filter called "cts2uW" in the SUM_OUTMON paths to give the outputs in uW incident on the PDs.
The fact that the SUM output is used to normalize PITCH and YAW signals meant that adding the filter in front of just the SUM channel increased the gains on PITCH and YAW significantly, affecting the IMC ASC loops. I have now put the cts2uW filters in the input filter banks for each segment of both QPDs. It works fine now, so the MC2trans SUM and IM4trans SUM are calibrated in uW. If anyone changes the whitening gains on these PDs, please be sure to adjust the calibration factor accordingly. I may look into automatically factoring the whitening gain into the calibration to avoid this issue in future.
Just to be clear, the calibration from counts to uW for both IM4trans and MC2trans was 0.032 uW per count. The number 2.087x10^9 [counts/W] was in error: this number should have been 3.3080x10^7 [counts/W]. Although the number in the alog post was in error, the correct number was used in the filters which were applied.
