Nothing coming from the h1iscey model is updating. Jeff tried restating the model, then restating h1iopiscey, its still not running.
[Stefan, Jeff K., Kiwamu]
We have aligned the BS this afternoon to maximize the amount of H1:ALS-C_TRY_A_DC.
This took some time since there was some confusion in the BS oplev and BS HEPI.
Current alignment biases :
H1:SUS-BS_M1_OPTICALIGN_P_OFFSET = -23
H1:SUS-BS_M1_OPTICALIGN_Y_OFFSET = 9
Current oplev nominal readout :
H1:SUS-BS_M3_OPLEV_PIT_OUTPUT ~ 5
H1:SUS-BS_M3_OPLEV_YAW_OUTPUT ~ 52
After aligning BS, H1:ALS-C_TRY_A_DC_VOLTS went to 0.3 which is higher than the value these days by a factor of 3. Also I see the red transmitted light becoming brighter as I aligned BS. This indicates that we are going back to the previous good alignment.
Before maximizing it we accidentally screwed up the BS alignment. It seems before Thomas centered the BS oplev the BS HEPI tripped for some reason. Therefore unfortunately the oplev centering was done with the wrong alignment. This complicated our alignment. Jeff untripped the BS HEPI with the intentional offsets enabled in V1 and V4 actuators which is the nominal configuration these days. Then we recovered the BS alignment by adjusting the top mass alignment biases. At the beginning we brought BS to roughly a good alignment by looking at the oplev trend and subtracting the offset introduced by the centering business. A fine alignment was done by maximizing H1:ALS-C_TRY_A_DC.
We were able to get H1:HPI-BS (in BSC2) running on Level 2, by - Running "ctrlDown BS" - Resetting all watchdogs - Turning on the master switch - Slowly ramping on the offsets using the master gain (which appears not to be controlled or used by the command scripts) - Hitting "isolate BS lvl2" The offsets buried in the V1 and V4 actuator filter banks, which are +2000 and -10000, respectively, were the major source of the H1 SUS BS misalignment. In case you missed it (like I did), Of the HEPIs involved in HIFO-Y, H1 HPI ETMY (in BSC6) H1 HPI BS (in BSC2) H1 HPI HAM1 are unlocked and floating, and controllable. H1 HPI ITMY (in BSC1) H1 HPI HAM2 H1 HPI HAM3 are locked.
I fixed a minor naming cut-n-paste error in h1iopsusex. I restarted all the SUS EX models to install the change. We will complete this modification tomorrow when we restart the DAQ (EDCU is purple partly due to this).
The EX software watchdog medm screen was created.
The daqd on x1dc0, x1nds1, and x1fw1 has been built from branch 2.7 and the data concentrator has been restarted to run the branch 2.7 versions.
JimW added another ~281 lbs to HAM6 and this got the lockers in the 'nearly loose' region. Temporary Viton was added under all masses. With it still locked, we then checked the Optical Table level and found it ~35mils runout. We loosened all the Horz HEPI set screws and then dropped the West-side corners ~1/32". This lowered the runout to <10mils and that is good enough to work on the ISI Lock/Unlock/Balancing. The HEPI Set Screws were resecured. Jim then worked on setting the Vertical CPS gaps/alignment. There may be a CPS Rack issue we need FClara to address tomorrow.
The x1work computer on the DTS is now running Ubuntu 12.04, updated from Ubuntu 10.04. A 1T hard drive was added as /data for database testing. Ubuntu 12.04 was installed on a separate 250G drive, the old Ubuntu 10.04 disk has been mounted as /usr1 in case there are files that need to be transferred to the new disk. Application software has been updated to the same software running in the LHO control room. The RSA fingerprint for x1work is now d5:ff:79:df:74:73:00:5e:89:06:ce:65:3d:8b:34:17
Daniel Halbe, Jess McIver
Daniel has shown a strong, persistent line at 6.8 Hz in all DOFs of the top stage BOSEMs of the ITMY since at least June 12.
As a follow up to his study, I looked for this line in the ITMY ISI and found it in stage 2: very sharply in RX, strongly in RY, somewhat fainter in Z, and much quieter in X, Y, and RZ.
The line is not seen in any DOF in stage 1, looking at the T240s.
Normalized spectrograms of representative DOFs are attached.
I have discovered a line very similar to this at Livingston and it occurs at 7 Hz. This line is found in Roll (very strongly) and not as strong in pitch. It appears to only show up in those two degrees of freedom and only in the top SUS mass. It does not show up in the ISIWIT channels or the top stage of the ISI. Also it does not show up in any of the other suspension stages.
I looked at spectrograms, time series, and ASDs for the CPS sensors on ST2 of the H1 ITMY ISI in all global degrees of freedom, but saw no evidence for a line at 6.8 Hz. An ASD of each CPS DOF during this time is attached in .fig form.
Alexa Sheila Stefan The I mon of the demod was not broken; I was using a bad cable to look at it. Now we are using the original demod again, using the I output, and the I mon and Q mon are on the scope visible from the ceiling camera (Imon is the x axis, Q mon is Y, both 500mV/div) We have the phase shifter still on external (remote controlled); the phase we are using now is 107.82 degrees and on the servo board IN1 polarity is negative. Right now we are locked with a gain of -8dB, and a screen shot of the IQ polar plot is attached. There is a lot of noise in I.
To date and the best of my knowledge, the only measurements of the 18-bit DAC noise have been those performed by J. Heefner, documented in T0900338, where the DAC noise is quoted as 150 [nV/rtHz] (and flat in the frequency band he probed). We'd learned from eLIGO (lessons by Tobin, myself,Matt, and Nic) that a DAC's noise floor changes when excitation is present, so Jay had measured the DAC noise while injecting a single-frequency line at ~100 [Hz], and then measured the high-frequency asymptote (his plots are on a linear x axis, without a grid so one can really only see the results above 100 Hz). 
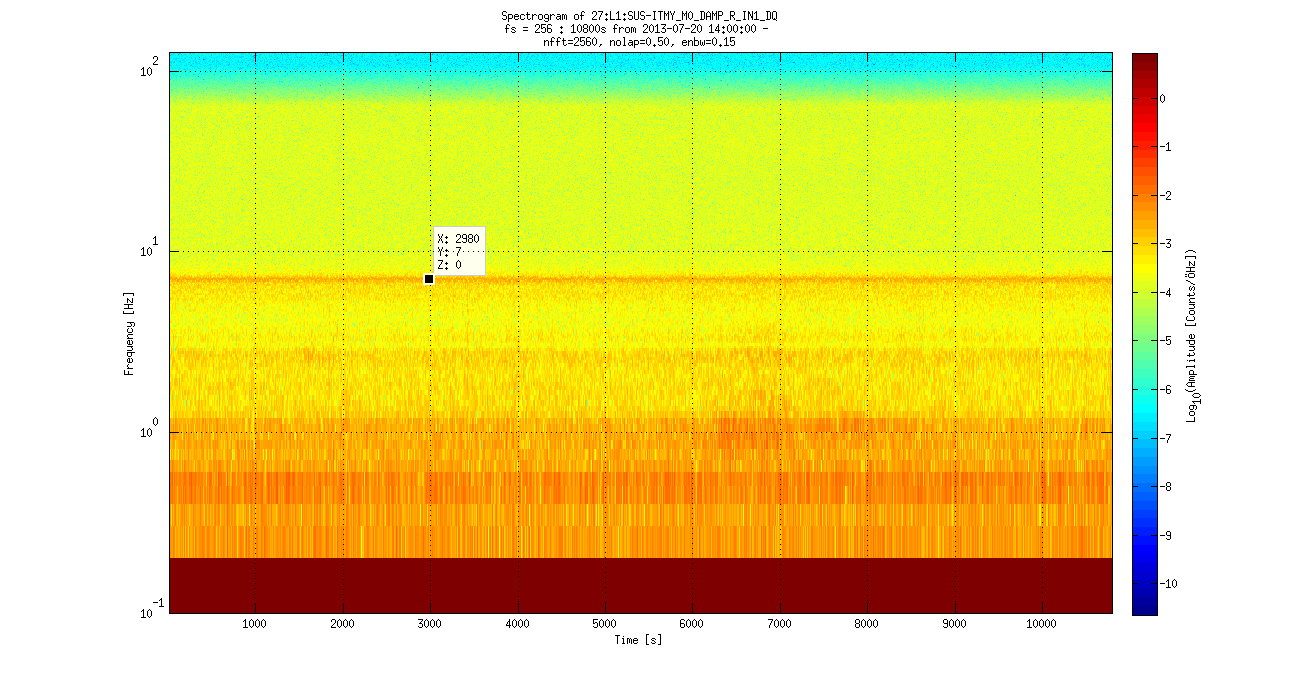
In the interest of suspension performance in the 0.1-10 [Hz] band where cavities are currently sensitive to their optic's motion, I've now characterized the noise in detail at low-frequency (0.05-1e3 [Hz], with focus on 0.05-50 [Hz] band), using a realistic output spectrum as the requested voltage. The results are attached and described below. Since the results are clearly non-linear, we may need to try different input spectra (working a little harder than I did to balance the SR785 range vs. noise) to really understand it. Naturally, we should also develop a model of the quantization noise, to see if we can differentiate this from just bad, non-linear electronics noise. Finally, we should also perform this same measurements on a 16-bit DAC. Note that, by default, the user-model-to-IOP-model exchange is done with zero-padding, as has become the default configuration for all models. -------- Plots and Captions 2013-07-21_2119_H1SUSMC2_DACOutput_ModeCleanerLocked_ASDs.pdf During a fully functional Input Mode Cleaner lock, this is the output voltage requested of the DAC at all three stages. The spectra seen at the TOP/M1 stage is totally confusing to me, so I ignored it, as it was distracting to this study to try and figure out. More on that to come later. As such, (and also informed by the input range vs. noise floor of the SR785 at these frequencies), I chose the Middle / M2 stage spectra as my representative spectra. experimentalsetup.pdf 
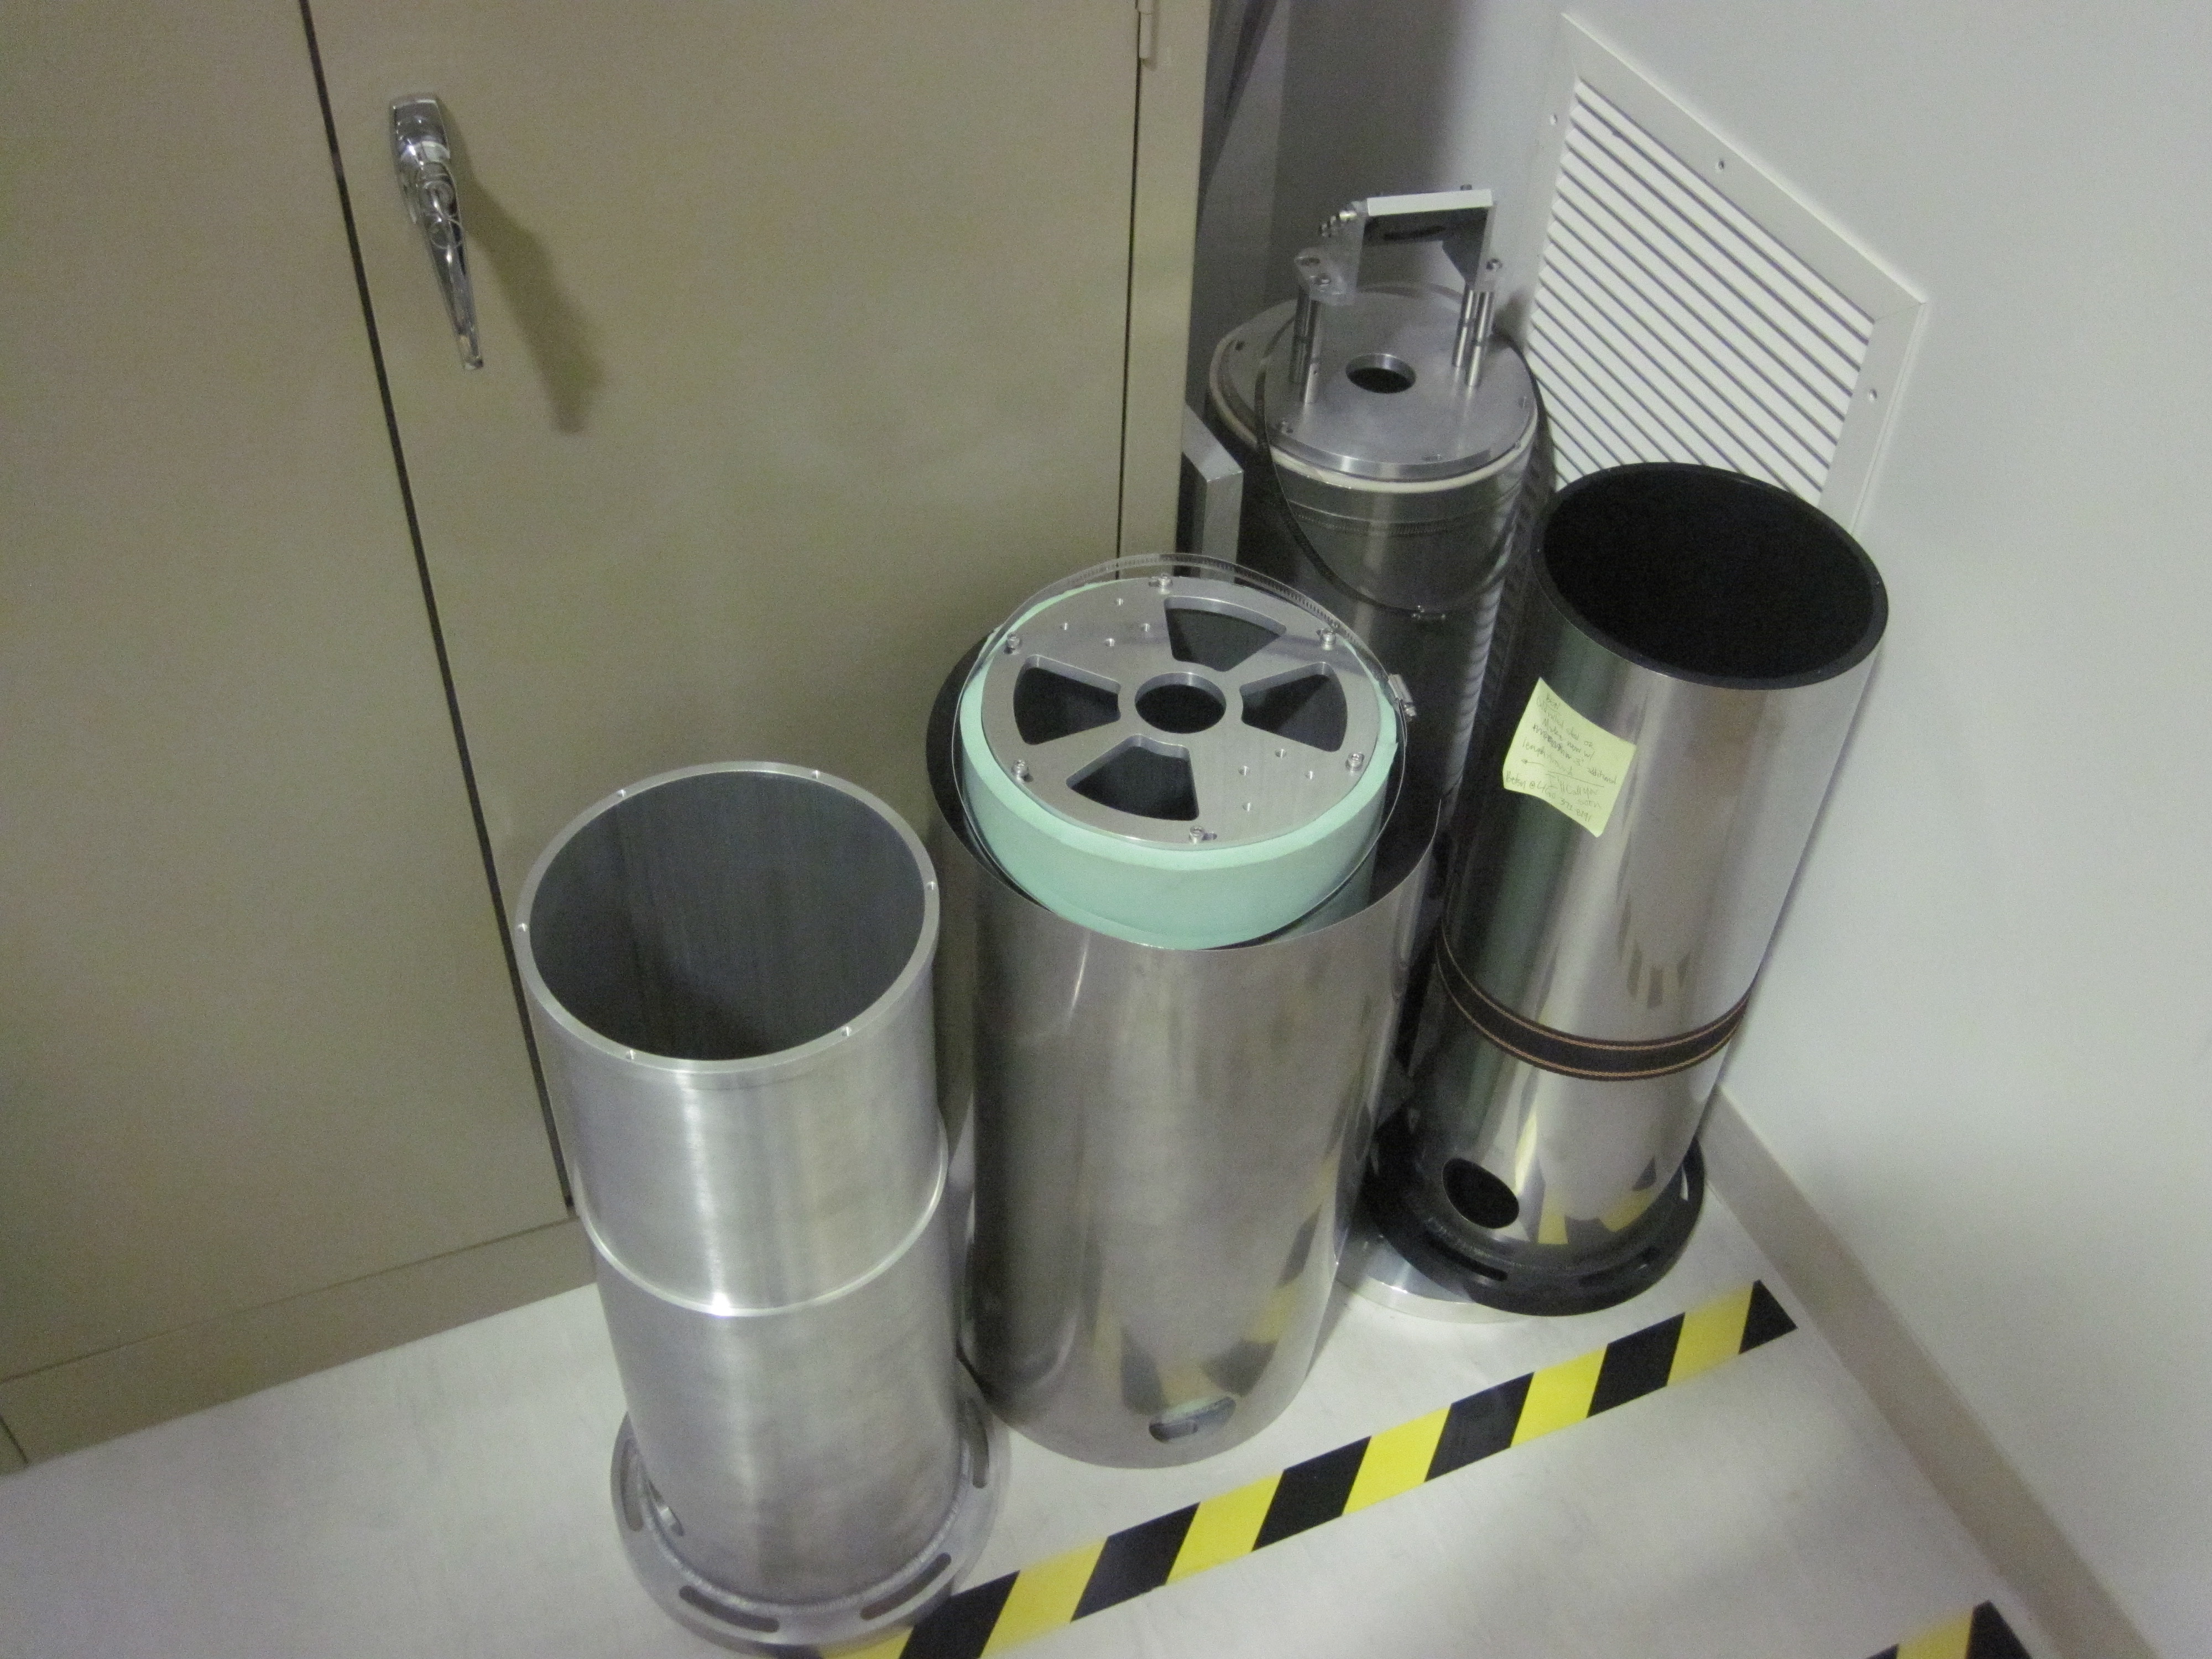
Diagram of how the experiment was set up. For this study, I commandeered the H1 SUS QUAD Test Stand. This is a fully-production quality test stand, running up-to-date software, and up to which nothing is hooked, so it was the perfect test bed. The Pomona box that was used to switch between output channels (borrowed from MIT) was a easy, convenient way to grab the signals, keeping them shielded, without having to mess with the usual breakout boards and clip leads -- a set up usually fraught with excess unwanted noise. 2013-07-21_H1SUSQUADTST_DACNoise.pdf The Results PG1: Here is the digitally requested spectrum, calibrated into voltage out of the AI filter (i.e. cts at the COILOUTF_??_EXC point, multiplied by the gain of the DAC, 20 / 2^18 [V/ct]). It is compared with the measurement noise floor (for the low-frequency, 0.05 - 50 [Hz] band, with -10 [dBVpk] SR785 input range), and the measured DAC noise with no digital output requested. The "traveling notches" in the requested drive are used to carve out at the DAC noise without disrupting the main frequency content of the signal. Note that because of SR785 range vs. noise issues, I sent out a requested signal with a factor of 10 less RMS voltage at 1e-2 [Vrms]. This is compared with the M2 stage (with 1e-1 [Vrms]) and PG2 - 4: The measured DAC noise output at the AI chassis for 3 DAC channels. We see, rather obviously that none of the notches below 10 [Hz], indicating a several elevated DAC noise floor. I've included a quick by-eye fit to the noise, which indicates that the DAC noise is 6e-6 * (10 [Hz] / f) [V/rtHz], with this excitation. Notes: - Even though the SR785 measurement is focused on the 0.05 - 50 [Hz] band, the full spectrum out to several [kHz] is requested during all measurements. - It's unclear to me why the shape and level of the DAC noise changes when I switch to the higher measurement band (10 to 810 [Hz]). Since I saw the DAC noise floor after the natural 100 [Hz] roll-off of the output spectra while retaining the 30 [Hz] notch (and it was Sunday at 8pm), I didn't bother traveling the notch any further, and therefore only have one measurement for each channel in this band. ----------- Details: The template for the mode cleaner output request spectra can be found here: ${SusSVN}/sus/trunk/HSTS/H1/MC2/Common/Data/2013-07-21_2119_H1SUSMC2_DACOutput_ModeCleanerLocked_ASDs.xml The input spectra is defined by the following AWGGUI Foton String which filtered white ("uniform") noise: amplitude = 100000 to get 1e-2 [Vrms] zpk([1.3;1.3;1.3;1.3;1.3;1.3],[0.3;0.3;0.3;0.3;0.3;0.3],1,"n")ellip("LowPass",4,1,80,100) notch(0.47,10,200)notch(0.5,10,200)notch(0.52,10,200) notch(0.9,10,200)notch(1,10,200)notch(1.1,5,200) notch(4.7,10,200)notch(5,10,200)notch(5.2,5,200) notch(10,5,200)notch(11,5,200)notch(12,2.5,200) notch(30,5,200)notch(32,5,200)notch(34,2.5,200) I'm *sure* there's a more elegant way of defining it, but ... so it goes. The captured digital output spectra templates can be found here: ${SusSVN}/sus/trunk/QUAD/H1/QUADTST/Common/Data/18Bit_DACNoise_2013-07-21/ 2013-07-21_H1SUSQUADTST_DACNoise_COILOUTF_AvgASDw0p45-0p5-0p55HzTipleNotch_ASDs.xml 2013-07-21_H1SUSQUADTST_DACNoise_COILOUTF_AvgASDw0p9-1-1p1HzTipleNotch_ASDs.xml 2013-07-21_H1SUSQUADTST_DACNoise_COILOUTF_AvgASDw4p5-5-5p5HzTipleNotch_ASDs.xml 2013-07-21_H1SUSQUADTST_DACNoise_COILOUTF_AvgASDw10-11-12HzTipleNotch_ASDs.xml 2013-07-21_H1SUSQUADTST_DACNoise_COILOUTF_AvgASDw30-32-34HzTipleNotch_ASDs.xml The raw SR785 data files can be found here: ${SusSVN}/sus/trunk/QUAD/H1/QUADTST/Common/Data/18Bit_DACNoise_2013-07-21/SCRN*.TXT with a key to what each number means in ${SusSVN}/sus/trunk/QUAD/H1/QUADTST/Common/Data/18Bit_DACNoise_2013-07-21/2013-07-21_MeasNotes.txt The data is analyzed, and plots are produced with the following script: ${SusSVN}/sus/trunk/QUAD/H1/QUADTST/Common/Scripts/plot18bitdacnoise_20130721.m
I used Matlab to model the quantization noise associated with Jeff's measurement. Here's the punchline: The "hiFreq" measurement series is consistent with quantization noise. The excess noise seen in the "loFreq" measurements is not.
The attached plot tells the story. The blue curve (mostly submerged under the red one) is the spectrum of Jeff's excitation, calculated with double precision as the front end would do. The solid red curve is what you get after applying 4x interpolation, and rounding the signal so it matches the 18-bit precision of the DAC. The 18-bit curve overlaps the double-precision curve almost everywhere -- except in the bottom of the notch and past the cutoff of the LP filter. In those two places, it's limited by round-off error, also known as "quantization noise". This noise floor is shown by the dotted red curve, which is the spectrum of the double signal minus the 18-bit signal.
The black curves are taken from Jeff's measurements. For the solid curves, the excitation was on; for the dotted curves it was off (requested DAC output = 0). The dotted curves are presumably limited by the electronics noise of the DAC. As for the solid curves, the "hiFreq" data reaches the quantization noise limit in the notch and outside the LP cutoff. The "loFreq" data appears to be running into some other noise floor. As Jeff noticed, the loFreq and hiFreq curves suspiciously disagree about the depth of the notch.
Side notes
Suggested next steps
The dominant noise source of a low noise DAC, when driven near its full range is the integrated non-linearity (INL). The exact shape of this noise might depend on the exact drive, ie., it could very well be different for a broadband signal vs single frequency, it might look different for high vs low frequency drive signals.
Communication was lost with the dust monitor at end X, I believe last Friday. The IOC was reporting errors like 'Command not echoed: ' and a random symbol character. Corey power cycled the Comtrol at end X for me, but this did not fix it. I went out to end X and found the dust monitor moved and off. I checked the fuse and it was blown, so I replaced it. After resetting the front panel options I called Dave and he restarted the IOC. This fixed it. I also removed the dust monitor at location 2 at end Y that was reading counts even with the zero count purge filter attached. This dust monitor is labeled 'S'.
The SEI teams at Stanford and LASTI are currently testing the new Cartesian basis bias correction in the isi/common/isi2stagemaster.mdl. Please do not svn update the trunk/isi/common directory from the cds_user_apps repository without talking to someone locally from one of the SEI teams.
For more details, see the log entry made by Hugo Paris on Friday 19 July 2013 titled "BSC/HAM ISI Models & MEDM - CART BIAS Update" in the SEI log.
Charles Celerier
Stanford SEI Team
I changed the demod for the PDH at end y over to the second channel in the same chassis. For this I had to change an SMA cable, so the phase will have shifted. While I was there I had a look on the table to see if there was any evidence of clipping, I didn't see any although the beam is kind of close to the edge of the 2 inch beamsplitter right after the periscope. I also readjusted the centering on the refl PD, mostly in yaw (the beam wasn't far off). I set up the scope in XY mode with I mon on the X axis and Q mon on the Y axis so we can use that to retune the phase. Strangely, the RF level on the bbPD for the PLL dropped suddenly at around 19:05 UTC. I'm not sure why that happened, the crystal frequency offset sent by beckhoff did not change and the FSS seemed to be locked the whole time. I changed the temperature of the end station laser from 31.35C to 31.45C, the pll is locking fine now.
The existing ASC_CUST_TIPTILT_OVERVIEW_all.adl (intended to show an overview of all HTTS/TipTilts) had been a renamed version of SUS_CUST_HAUX_OVERVIEW_all.adl with no further adaption, so I got it working.
This involved renaming a lot of buttons, signals and related displays, applying the new calling conventions via macro text files for all related displays, and compacting the layout to allow squeezing in a fifth optic at the bottom.
The new screen has been committed and linked to the LHO SITEMAP.
LLO might want to svn up and link it also.
Restarted cdsfs1 file server after RAID controller "locked up" over the weekend.
Summary: The HIFO-Y feature at 70 Hz is produced by both ALS periscopes on ISCT1. The features below 1 Hz are coherent with ground motion and OSEM sensors. We did not identify the dominant source of noise between 0.8 and 2 Hz, though this band contributes little to the HIFO-Y RMS. We may be able to reduce the RMS by using cylindrical periscopes that have resonant frequencies closer to 250 Hz, but we will also likely get a free factor of about two reduction in RMS (in the 60-80 Hz band) after noisy installation activities cease.
Vibration coupling to HIFO-Y was reduced by establishing a science mode and a commissioning mode for PSL air handling (Link). There remain two frequency bands that contribute significantly to the HIFO-Y RMS, 60-80 Hz, and 0.3-0.7 Hz.
Figure 1 shows spectra for the PEM sensors that we recently installed whose signals have the highest coherence with the HIFO-Y signal above 1 Hz. The PSL was operating in science mode. The accelerometer that we mounted temporarily on one of the two similar ALS telescopes on ISCT1 (red trace), the one that carries infrared light, has high coherence with and similar shape to the 50-100 Hz band noise in HIFO-Y (red and black traces). Further excitation tests on the ISCT1 table confirmed that the 70 Hz feature is associated with the lowest resonant frequencies of both ALS periscopes. Neither the green nor the infrared periscope appears to dominate, and I could find no particular source of, e.g., backscattering noise. It may be that the noise is associated with the differential motion of the two periscopes in the locked path.
The other coherence features in the spectrum are, at about 180 Hz, one of the higher-Q resonances of the PSL periscope – perhaps driven by vibrations at the 60 Hz harmonic. These 180 Hz vibrations may be smaller after installation, and if they are not suffieciently smaller, we may be able to damp at this frequency. The 12 and 13 Hz coherence regions are produced by table sway resonances of ISCT1. I am less certain about the feature between 5 and 6 Hz, but there is a building resonance at that frequency excited by wind. The seismometers, some distance from the PSL and ISCT1, also show strong coherence with HIFO-Y at 5.5 Hz, supporting the building resonance interpretation.
Coherences with features in the low frequency region are shown in Figure 2. Seismometer and OSEM signals have high coherence with the HIFO-Y signal, except in the band between 0.8 and 2 Hz. We did not find the source of noise in this region.
It may be useful for the DetChar group to look for coherence in this 0.8-2 Hz band (I only guessed the most important channels) and, if none is found, search for upconversion between the 0.1-0.7 Hz band and, say, the 1.2-1.8 Hz band.
It may be possible to reduce the ALS RMS by replacing the periscopes with periscopes that have higher resonant frequencies. We can probably get from 70 Hz to about 250 Hz by using the cylindrical periscopes from iLIGO. Stefan also suggested that we use a single periscope for both the red and green beams, reducing differential motion. I placed an accelerometer on the double periscope, also on ISCT1, and found the lowest resonance to be about 60 Hz. It is not clear to me whether putting both beams on a 60 Hz periscope or keeping them separate on 250 Hz periscopes, would result in the better RMS.
We may get a free factor of about 2 reduction in RMS contribution from the periscope motion after installation activities cease, because Figure 3 shows that ground motion in this band was about a factor of 2 lower during S6. After installation we would expect the ground motion to drop back down to the S6 level, reducing the need to change periscopes.
Figure 4 is a photo of the cylindrical periscopes from iLIGO that we gathered together near the squeezer bay with Corey’s help. None of them are complete, some parts would probably have to be remade.
Robert Schofield, Stefan Ballmer, Emily Maaske, Terra Hardwick, Vincent Roma, Brian Dawes, Tristan Shoemaker
I have computed the coherence between H1_ASC-Y_TR_A_NSUM_OUT_DQ and many seismic and suspension channels in the 0.1-2 Hz band. As Robert noted, there is significant coherence between many of the seismic channels and the output channel. There are also a few suspension channels that also indicate high coherence in the 0.6-0.8 Hz band. I can also broaden my scope if there is interest. This is a slightly random channel list, and if there are channels that people would think could be interesting, I am happy to include them.
(Alexa, Kiwamu, Keita, Daniel, Sheila, Robert, Stefan) Last night, at 17:50 local time, we turned off the BSC6 clean room... We observed a sharp step shortly afterward (probably due to a quick realignment) on both green reflected light and transmitted light, followed by a 15h slow drift. We then decided to realign the REFL diodes at EY. But surprisingly, to lock the green light, we had to move the ITM pitch by 0.7urad, ETM pitch by -1.6urad, and TMSY by -8urad to get back to a good alignment. Meanwhile we also had to flip the EY PDH servo sign. We don't know why that happened. Image A: The the green refl diode, ALS-Y_REFL_A_DC power is falling off the PD over the duration of about 15h. Image B: We are also losing a little bit on ALS-Y_REFL_B_DC Image C & D: The clean room transient is also visible in the TMSY OSEMs as a step. The HPI IPS's show a glitch, but no step. (The large step on HEPI is the lock loss.) Image E: The corner green power (ALS-C_TRY_A_DC_VOLTS) and beat note RFMON actually stepped up initially, but then dropped over ~15h. For tonight we switched the clean room on again around 5pm
Remember that the clean room is also a large heater ~ 10KW
Temperature zone 202D shows a step change in temperature at that time. I am unable to post a plot from home for some reason but if you look at the FMCS signals for ENDY and look for the 4 temperature sensors in the VEA - these are labelled 202A,202B,202C,and 202D; you will see that zone D in room 202 took a dive when you turned off the cleanroom. This sensor is low on the wall near the return air grills. The temperatures inside the cleanroom were probably impacted even more.
Plot now attached.
Also, the cleanroom will impart a very small positive pressure inside the plastic curtains - hence the flow out of the cleanroom. This may account for the step change while the temperature change has given you the slow drift???
John
There is no signal coming out of the I mon at the end station PDH demod. Since there was a PDH signal on Q mon I swapped the cable so that Q goes to In 1 on the PDH board. Both I mon and Q mon are on the scope visible from the ceiling cam right now, both 500mV/div. I also switched the phase shifter from local to remote control, and roughly tuned the phase to 186.92 degrees.
I set up a delayed measurement for MC3 :
It will start this week end on SUNDAY evening from 5:38 pm, and will run for ~ 3 hours
MC3 locking and damping filters will be turned off as well as the alignment offsets