Displaying reports 76541-76560 of 83334.Go to page Start 3824 3825 3826 3827 3828 3829 3830 3831 3832 End
Reports until 16:56, Monday 08 July 2013
H1 AOS
hernan.daveloza@LIGO.ORG - posted 16:56, Monday 08 July 2013 (7010)
LLO Y-arm Pcal Periscope

The LLO Y-arm Pcal Periscope was taken out of the pre-alignment cradle and wrapped with two C3 HAM-DOOR fabric, see picture. Tomorrow will be wrapped, crane, and put in a crate ready to be delivered to LLO.


pablo

Images attached to this report
H1 SEI
vincent.lhuillier@LIGO.ORG - posted 16:34, Monday 08 July 2013 (7007)
Low frequency Noise - BSC-ISI

After correcting the routine (Routine 6 used since OAT) used to build the blend filters, I reloaded the new blend filters for all BSCs (1,2,6). With the new set of blend filters, less L4C noise should be introduced when the T240s are used in the stage 1 super sensors.

LHO General
corey.gray@LIGO.ORG - posted 16:27, Monday 08 July 2013 (7003)
Ops Day Summary

Test Stand cables run at EX (Filiberto & Crew)

GV5 closed (Kyle) & Dome Spreader moved over beam tube (Apollo)

TMS SUS crew working on Upper Mass at EX (Jeff & Andres)

Manifold Cryopump Baffle staging (Thomas)

hard power reset of SUS BSC123 to clean up noise from suspected power glitch (Vincent)

HAM6 doors being removed

SEI crew working on HAM6-ISI

New filters installed on ETMy Suspension (Arnaud)

PCal work in H2 PSL continues, no crane work today (Pablo, Colin, Rick)

LHO VE
kyle.ryan@LIGO.ORG - posted 16:12, Monday 08 July 2013 (7009)
Helium removal
2.8 x 10⁻⁷ torr*L/sec before opening GV5 -> 1.8 x 10⁻⁷ torr*L/sec 15 mins after GV5 open
LHO VE
kyle.ryan@LIGO.ORG - posted 16:11, Monday 08 July 2013 (7008)
GV5 soft-cycled for craning


H1 INS
jodi.fauver@LIGO.ORG - posted 15:40, Monday 08 July 2013 (7006)
HAM6
Both cleanings at HAM5/6 completed before lunch. Door removal started after lunch. North door removed first and particle count taken. Cleanroom moved to the north. South door removed and particle count taken. Soft covers on both doors.
H1 SUS
arnaud.pele@LIGO.ORG - posted 12:37, Monday 08 July 2013 (7004)
ETMY open loop model vs measurement

Attached is a comparison between the measured and modeled open loop of the control applied to the top mass of ETMY in long. The configuration during the measurement was similar as the one took previously (cf aLog 6969), with the damping/filter gain set to 3 instead of 1 for L (config used for running the interferometer). Once again the measurement matches the model, and surprisingly, even with a phase margin of 13º, the system stayed stable for days.

Now that we trust our model, the 2.1 filters will be installed today on ETMY.

Non-image files attached to this report
H1 ISC
stefan.ballmer@LIGO.ORG - posted 21:03, Saturday 06 July 2013 - last comment - 08:03, Monday 08 July 2013(6997)
Left Half-H1 running
Good data starts at 07/07/2013, 03:57:00 UTC

H1:ASC-Y_TR_A_NSUM_OUT_DQ should hover around 250cts, which is half of the full 500cts.

Comments related to this report
stefan.ballmer@LIGO.ORG - 21:10, Saturday 06 July 2013 (6998)
Noise plot for tonight.

The decrease around 1Hz is real, probably partly due to VCO noise, and partly due to alignment.

The increase above 100Hz is due to the loop shape - I am running with a higher UGF tonight.
Non-image files attached to this comment
stefan.ballmer@LIGO.ORG - 17:19, Sunday 07 July 2013 (6999)
The good stretch lasted from 03:57 to 08:22 UTC on 7/7/2013.
Images attached to this comment
stefan.ballmer@LIGO.ORG - 19:45, Sunday 07 July 2013 (7000)
Some relaxing filtering work brought the >100Hz contribution down a bit. We get 5Hz RMS across the whole band.
Also, the 0.5Hz-2Hz suspension stuff is likely an artefact of using the transmitted DC light. It improved significantly with alignment. And it is about the same order of magnitude when we sit exactly on fringe (with 500cts), and should have significantly reduced frequency coupling.

Again left it running, starting at 02:26 (July 8 2013).
Images attached to this comment
joshua.smith@LIGO.ORG - 21:20, Sunday 07 July 2013 (7001)
HI Stefan,

I think turning off the pump near HAM3 has removed a sharp line at 65.5Hz, but the rest of the structure around 60-70Hz was unchanged. 

The plots below show: 

1) A coherence plot between ASC-Y_TR_A_NSUM_OUT_DQ and ISI-HAM3_BLND_GS13X_IN1_DQ from one of your early locks last week (June 29) and from this weekend's lock (July 7). The major difference is that the big coherence peak at 65.5Hz is gone. The coherence at 3.5, 5, and 41.5 looks a tad higher, but maybe just due to differing seismic conditions at the time (will check some more times). 

2) Uncalibrated spectra of ASC-Y_TR_A_NSUM_OUT_DQ for the same two times. Here you can see that the 65.5Hz peak is gone. 

We'll keep searching in other places for stronger coherence in the 60-70Hz range. 

Josh
Non-image files attached to this comment
joshua.smith@LIGO.ORG - 08:03, Monday 08 July 2013 (7002)
FWIW, while Michael Coughlin and I were searching in coherence we found two more ASC-Y_TR_A_NSUM_OUT_DQ peaks that are coherent with HAM motion. The peak at 58.5Hz is coherent with HAM2 ISI and the peak at 41.5 with HAM3 and HAM2 (also in CS MICs). These don't have much contribution to your RMS though. The first plot shows the coherence peaks, the second plot shows which peaks in the ASC-Y_TR spectrum these correspond to. 
Non-image files attached to this comment
H1 AOS
stefan.ballmer@LIGO.ORG - posted 19:00, Saturday 06 July 2013 (6996)
Low frequency only RMS plot
Here is an RMS plot in today's (aligned...) configuration, intentionally cut off at 50Hz.
(The high frequency stuff is about the same)
Non-image files attached to this report
H1 ISC
stefan.ballmer@LIGO.ORG - posted 17:45, Saturday 06 July 2013 - last comment - 18:42, Saturday 06 July 2013(6994)
Will the true 00-mode please stand up!
(Daniel, Stefan)

Based on yesterday's mode scan we identified where the 00 mode should be (tiny peak, with transverse modes spaced at 17890Hz to the right).

We did a dither alignment, first green (moving TMSY, ITMX and ETMX), then locked on the now identified 00-mode (moving PR2 and IM4).
That gave us 500 cts in the transmission quad sum (up from 250 counts).

Attached is the mode scan after the alignment.
Images attached to this report
Comments related to this report
stefan.ballmer@LIGO.ORG - 18:42, Saturday 06 July 2013 (6995)
We also used the opportunity of having measured the 00 mode offset frequency in a grossly misaligned state.
We can set a limit on the effecy of alignment on frequency offsets.

00-mode in grossly misaligned state (yesterday): -22842Hz
00-mode in aligned state (today):                -22856Hz

The difference is only 14Hz. Given that both numbers were derived by finding the top of the fringe with about 10Hz RMS fluctuations, the error in that measurement is also about 14Hz.
H1 ISC
stefan.ballmer@LIGO.ORG - posted 23:33, Friday 05 July 2013 - last comment - 17:18, Saturday 06 July 2013(6990)
Cavity Mode Scan
(Daniel, Stefan)

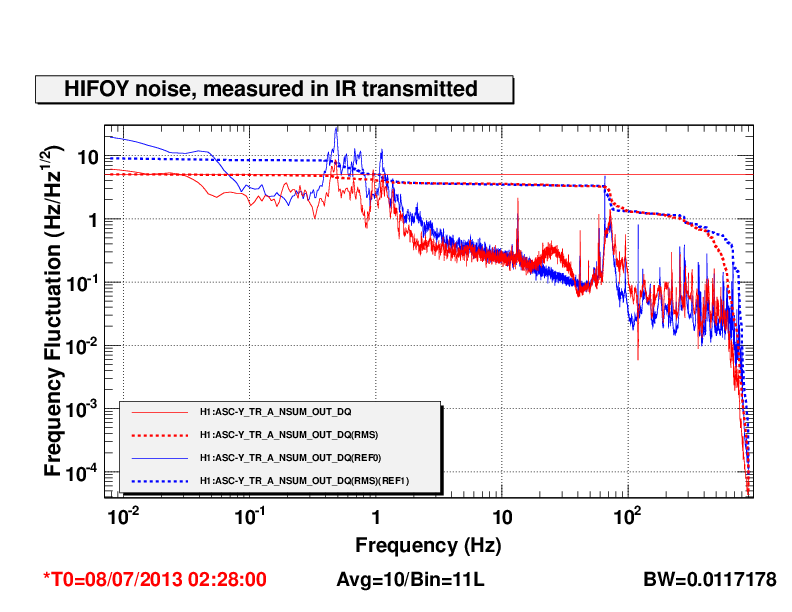
First we realized that the 10x higher fluctuations we obserbed on Wednesday were entirely due to alignment. So we tweaked up what we thought was the carrier, and indeed reproduced the ~8Hz RMS performance.

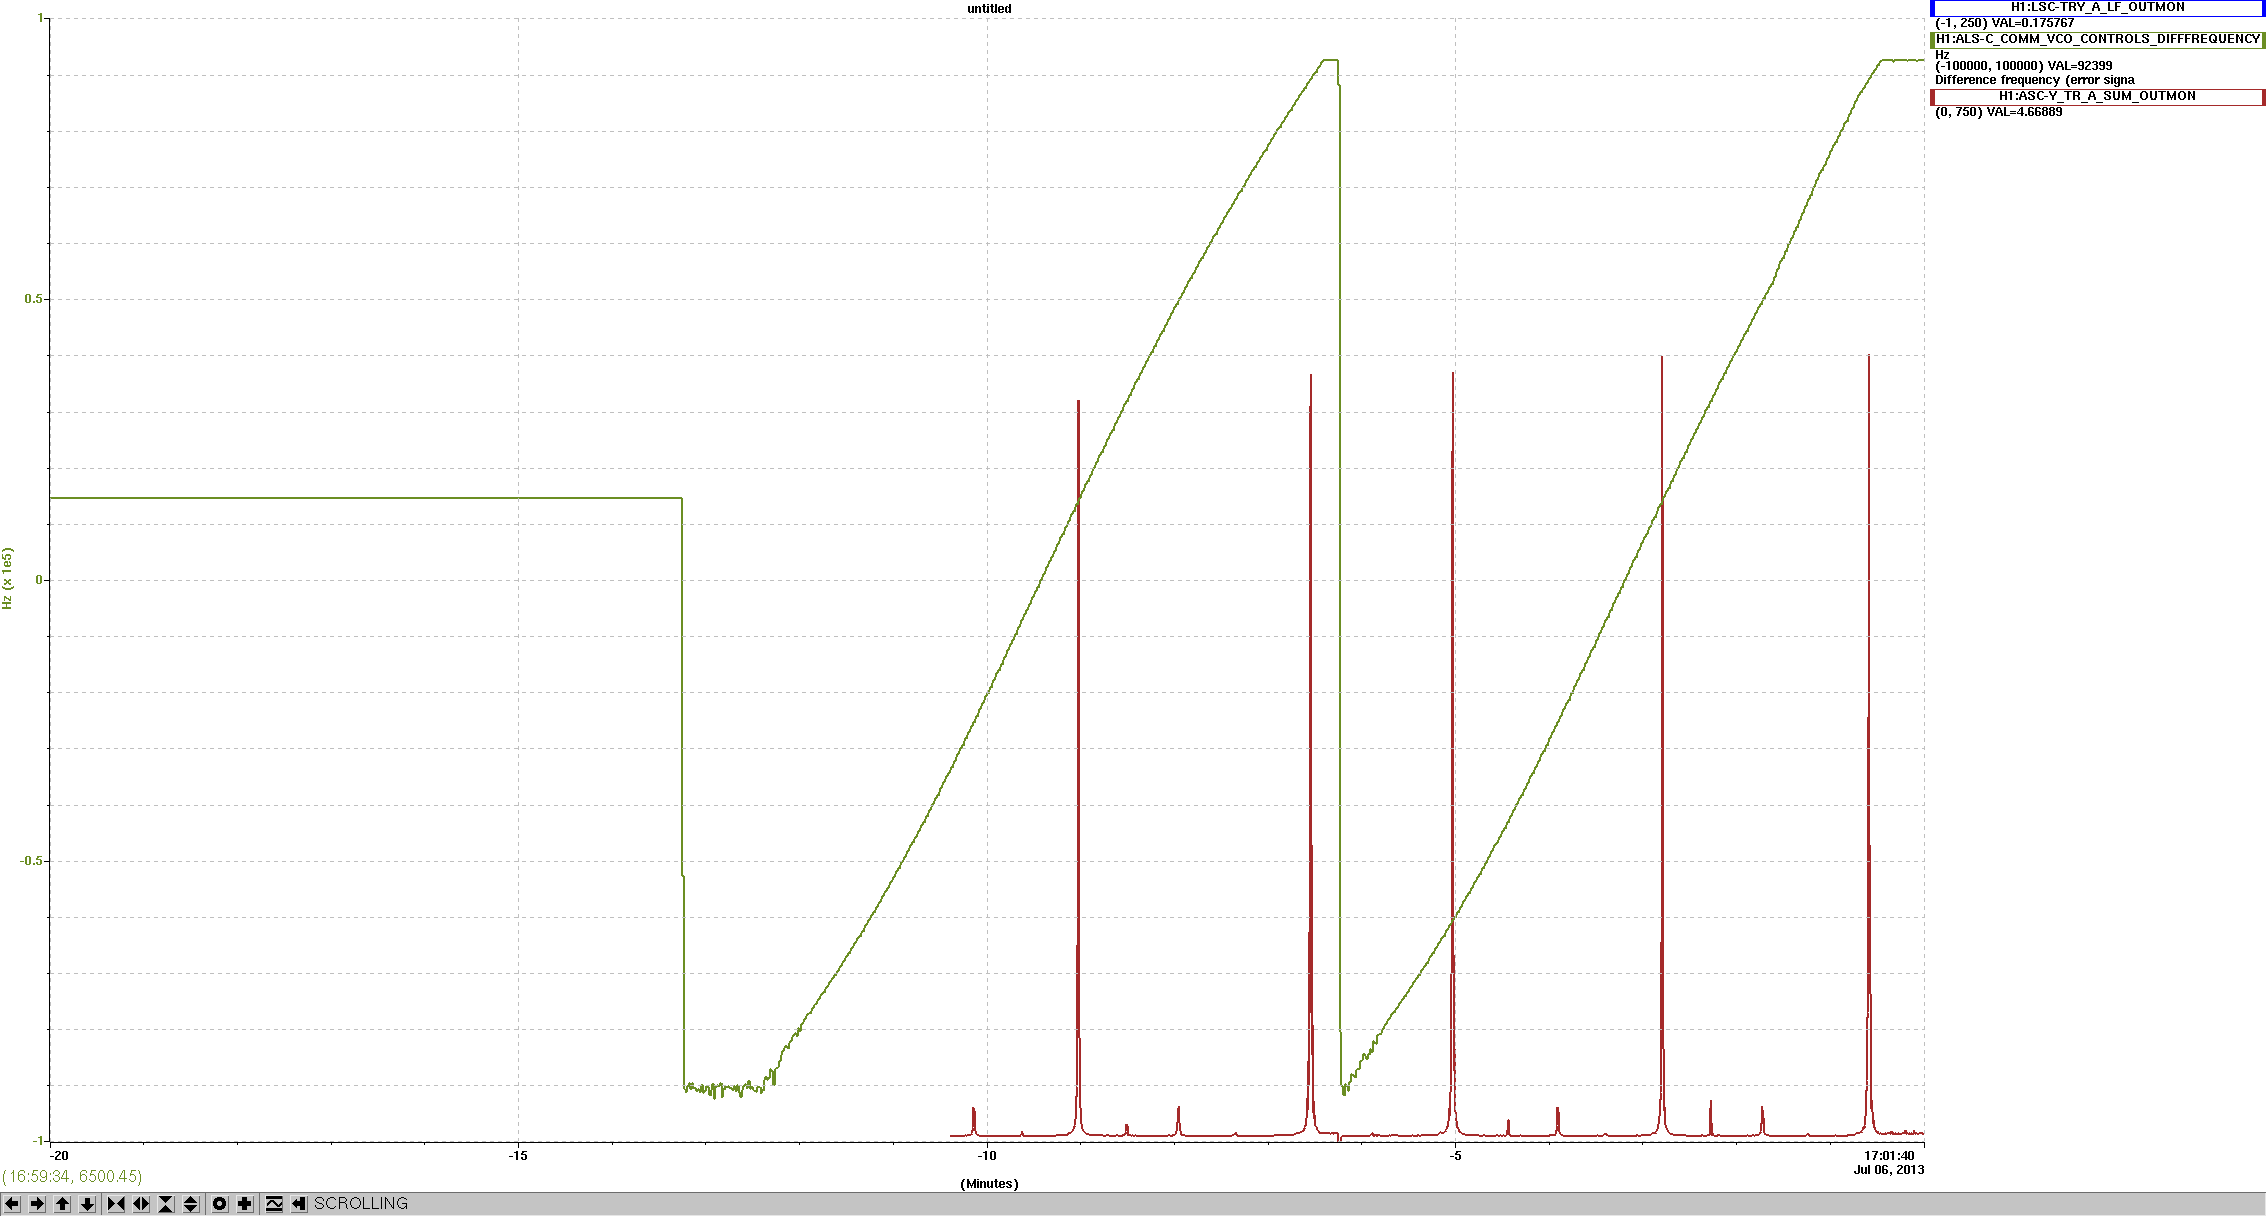
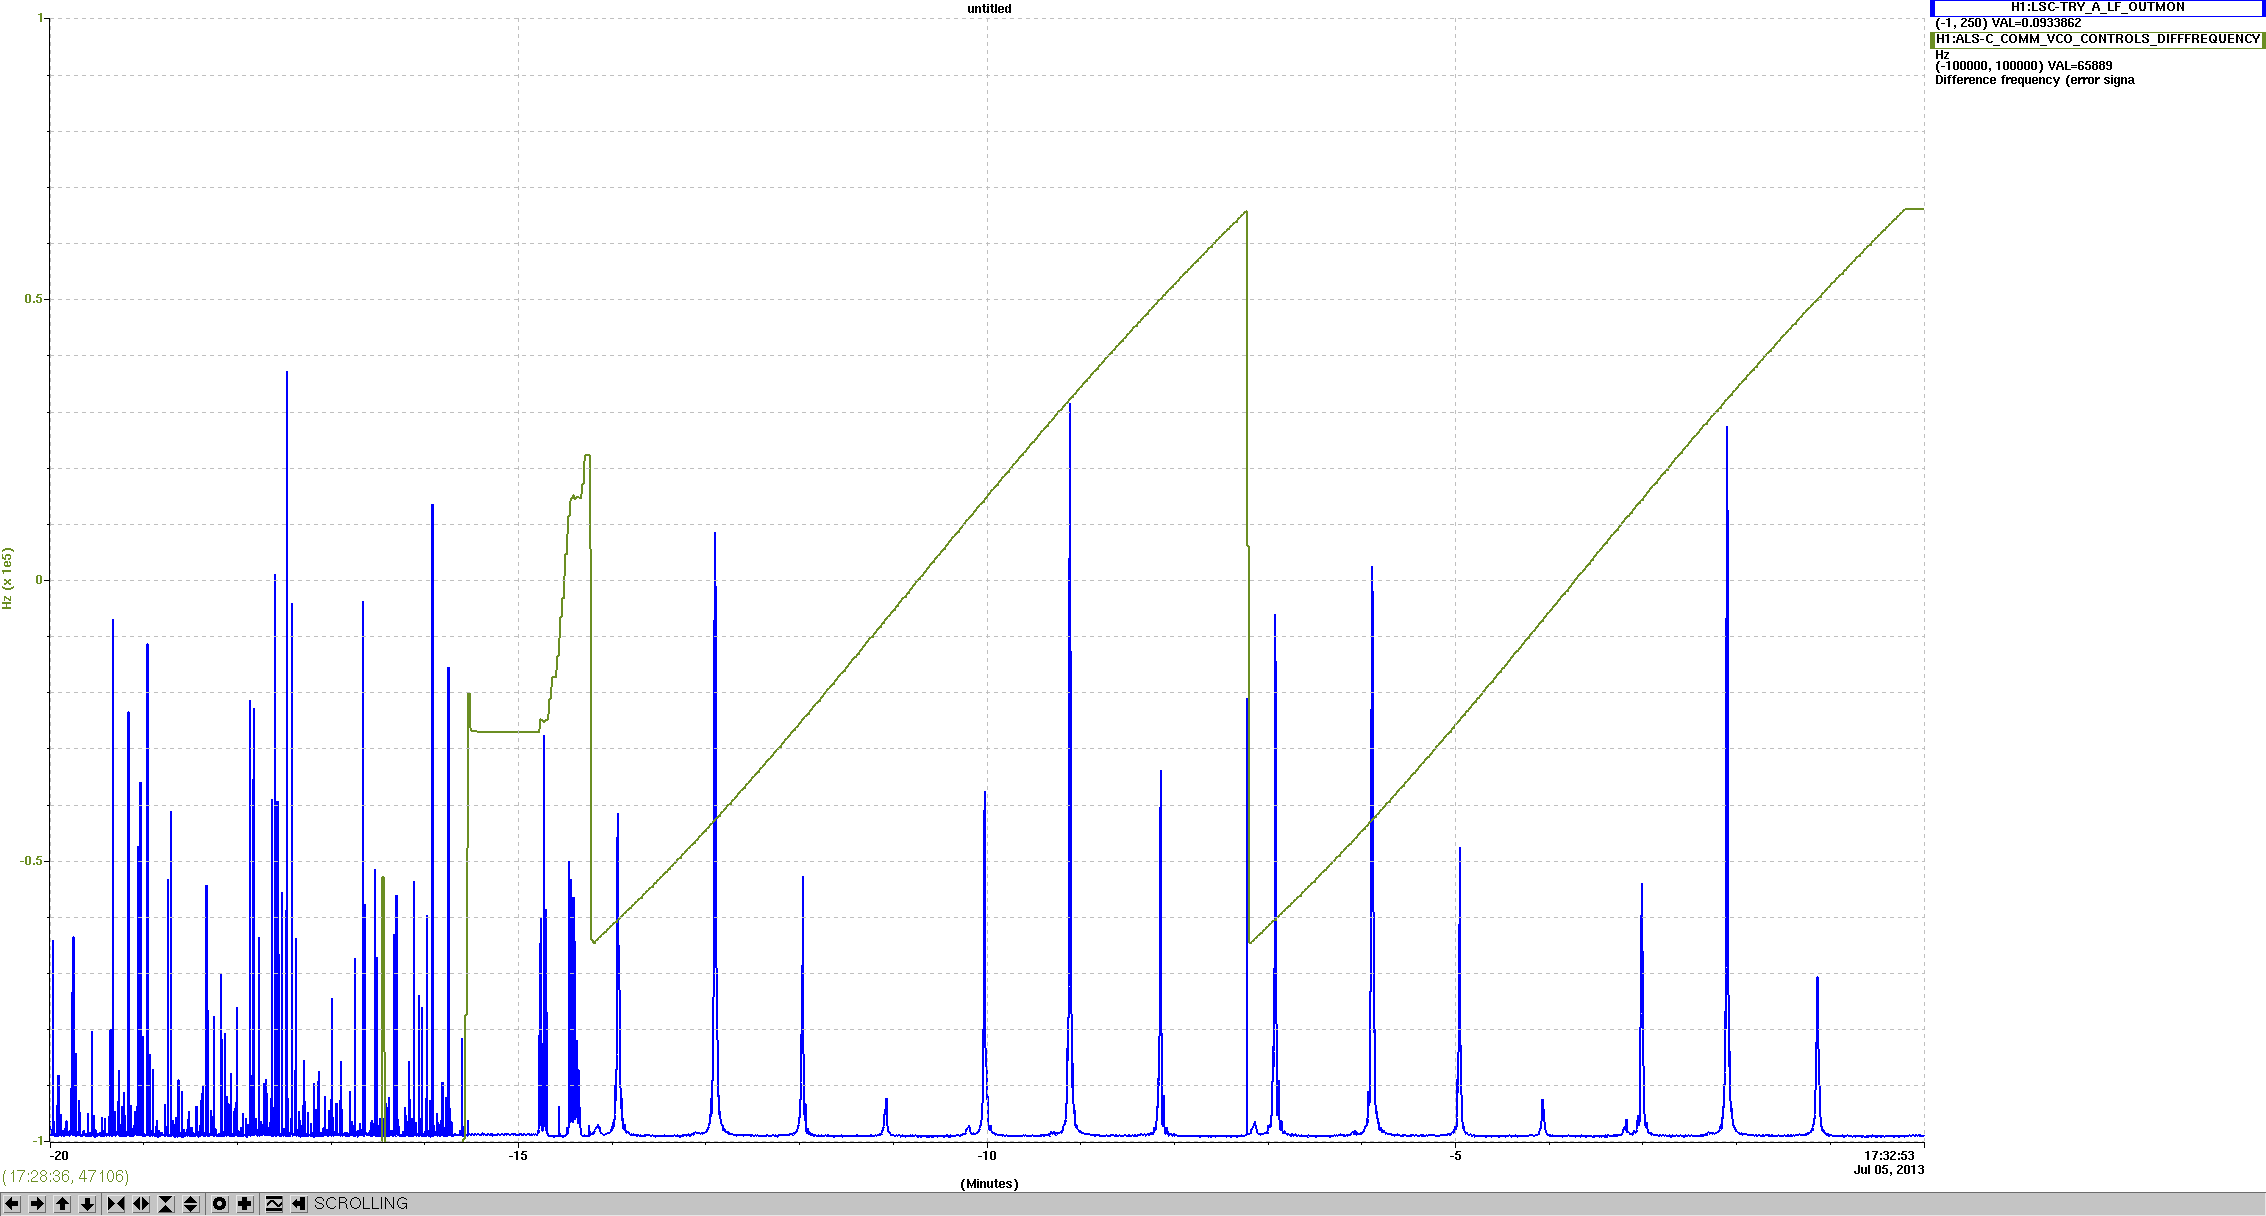
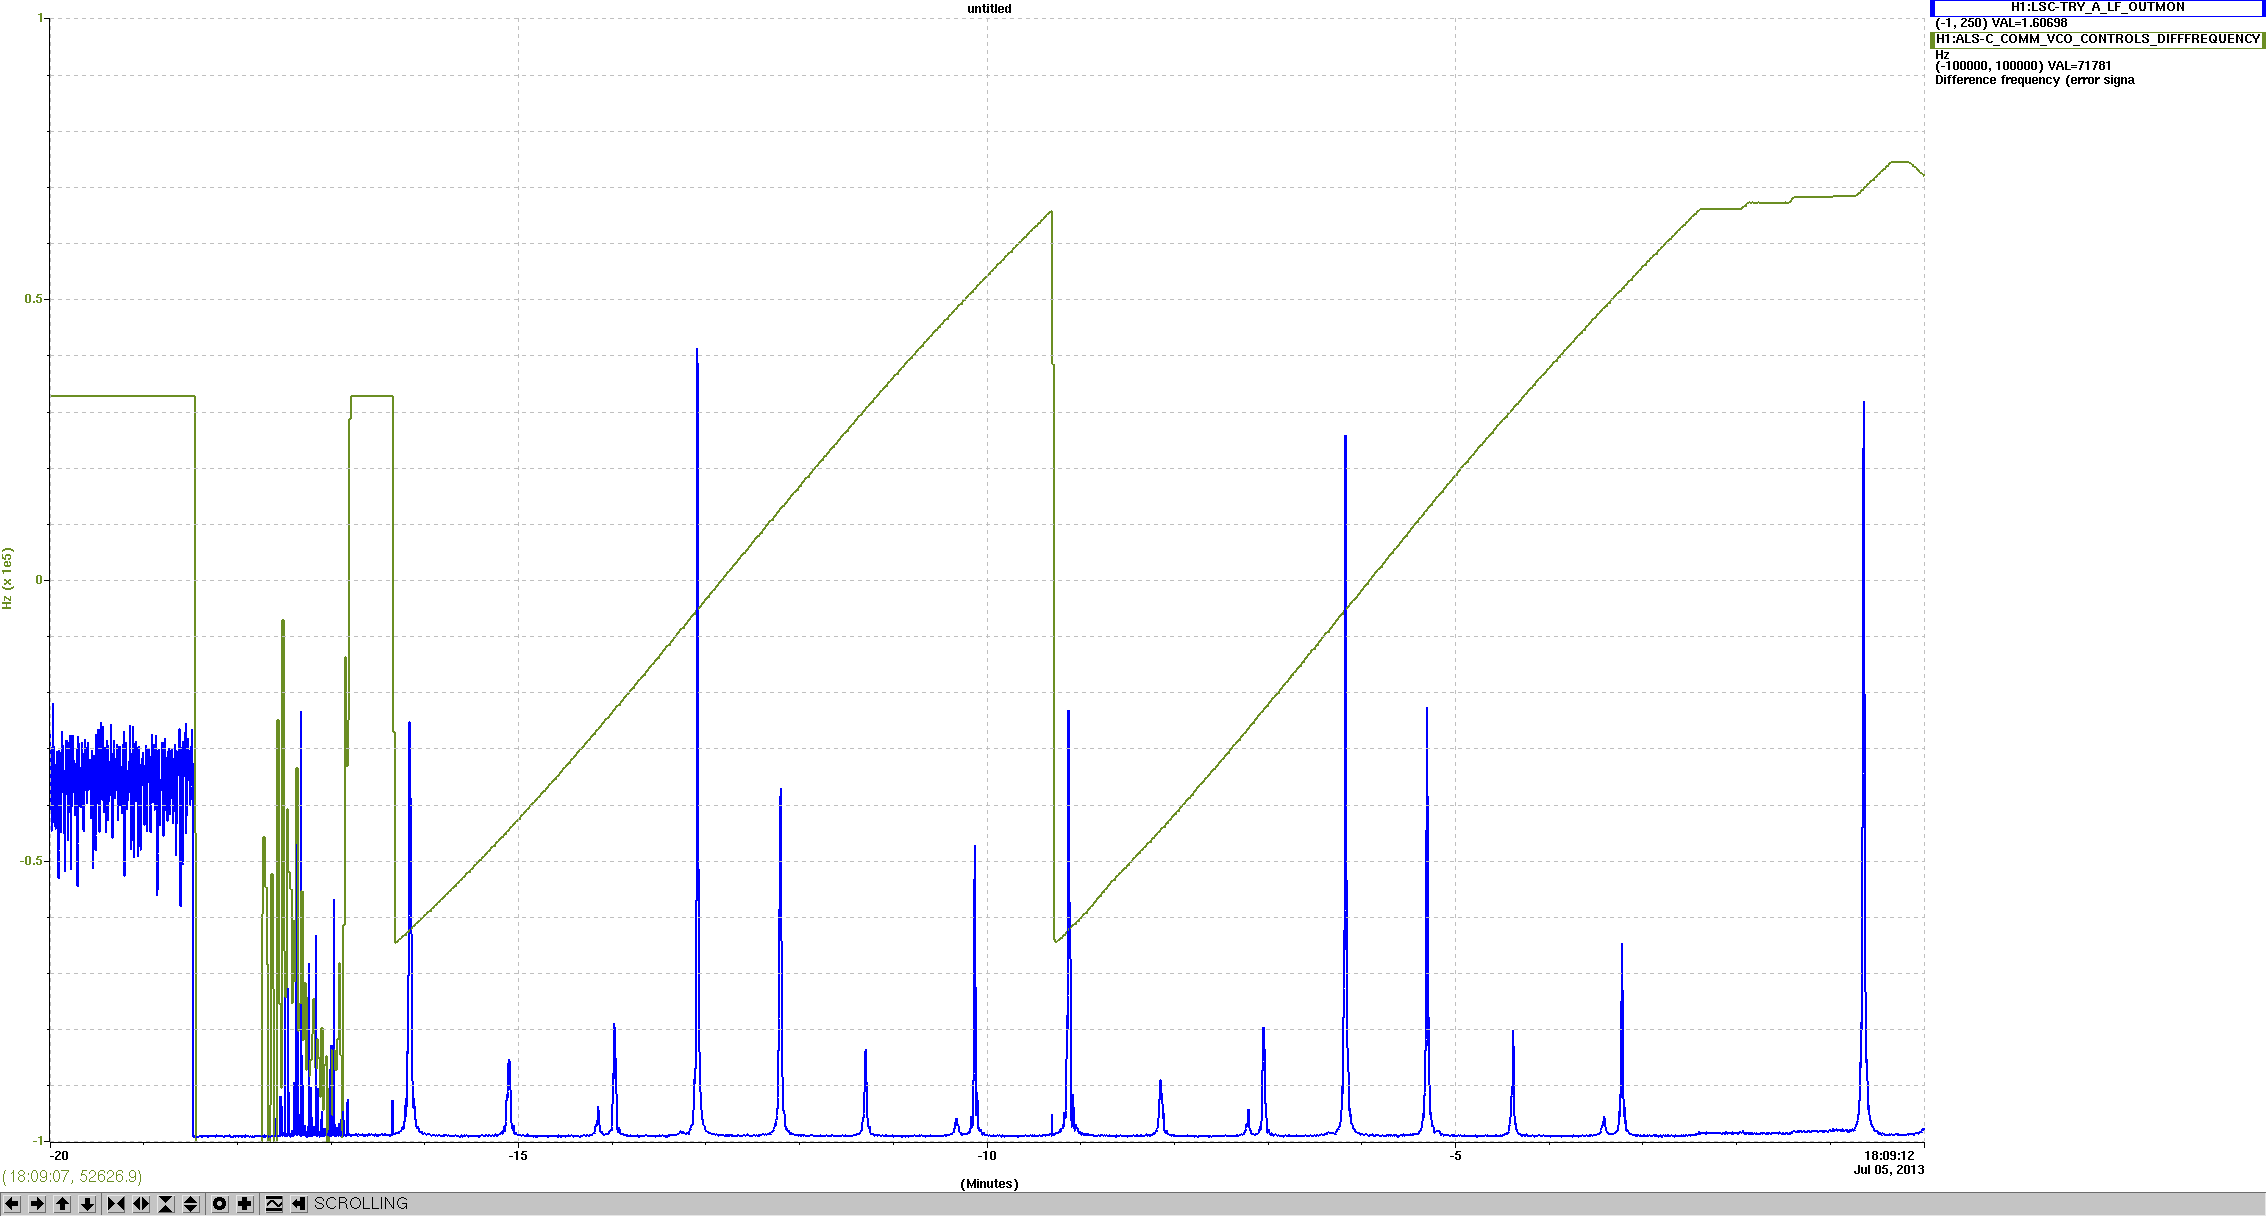
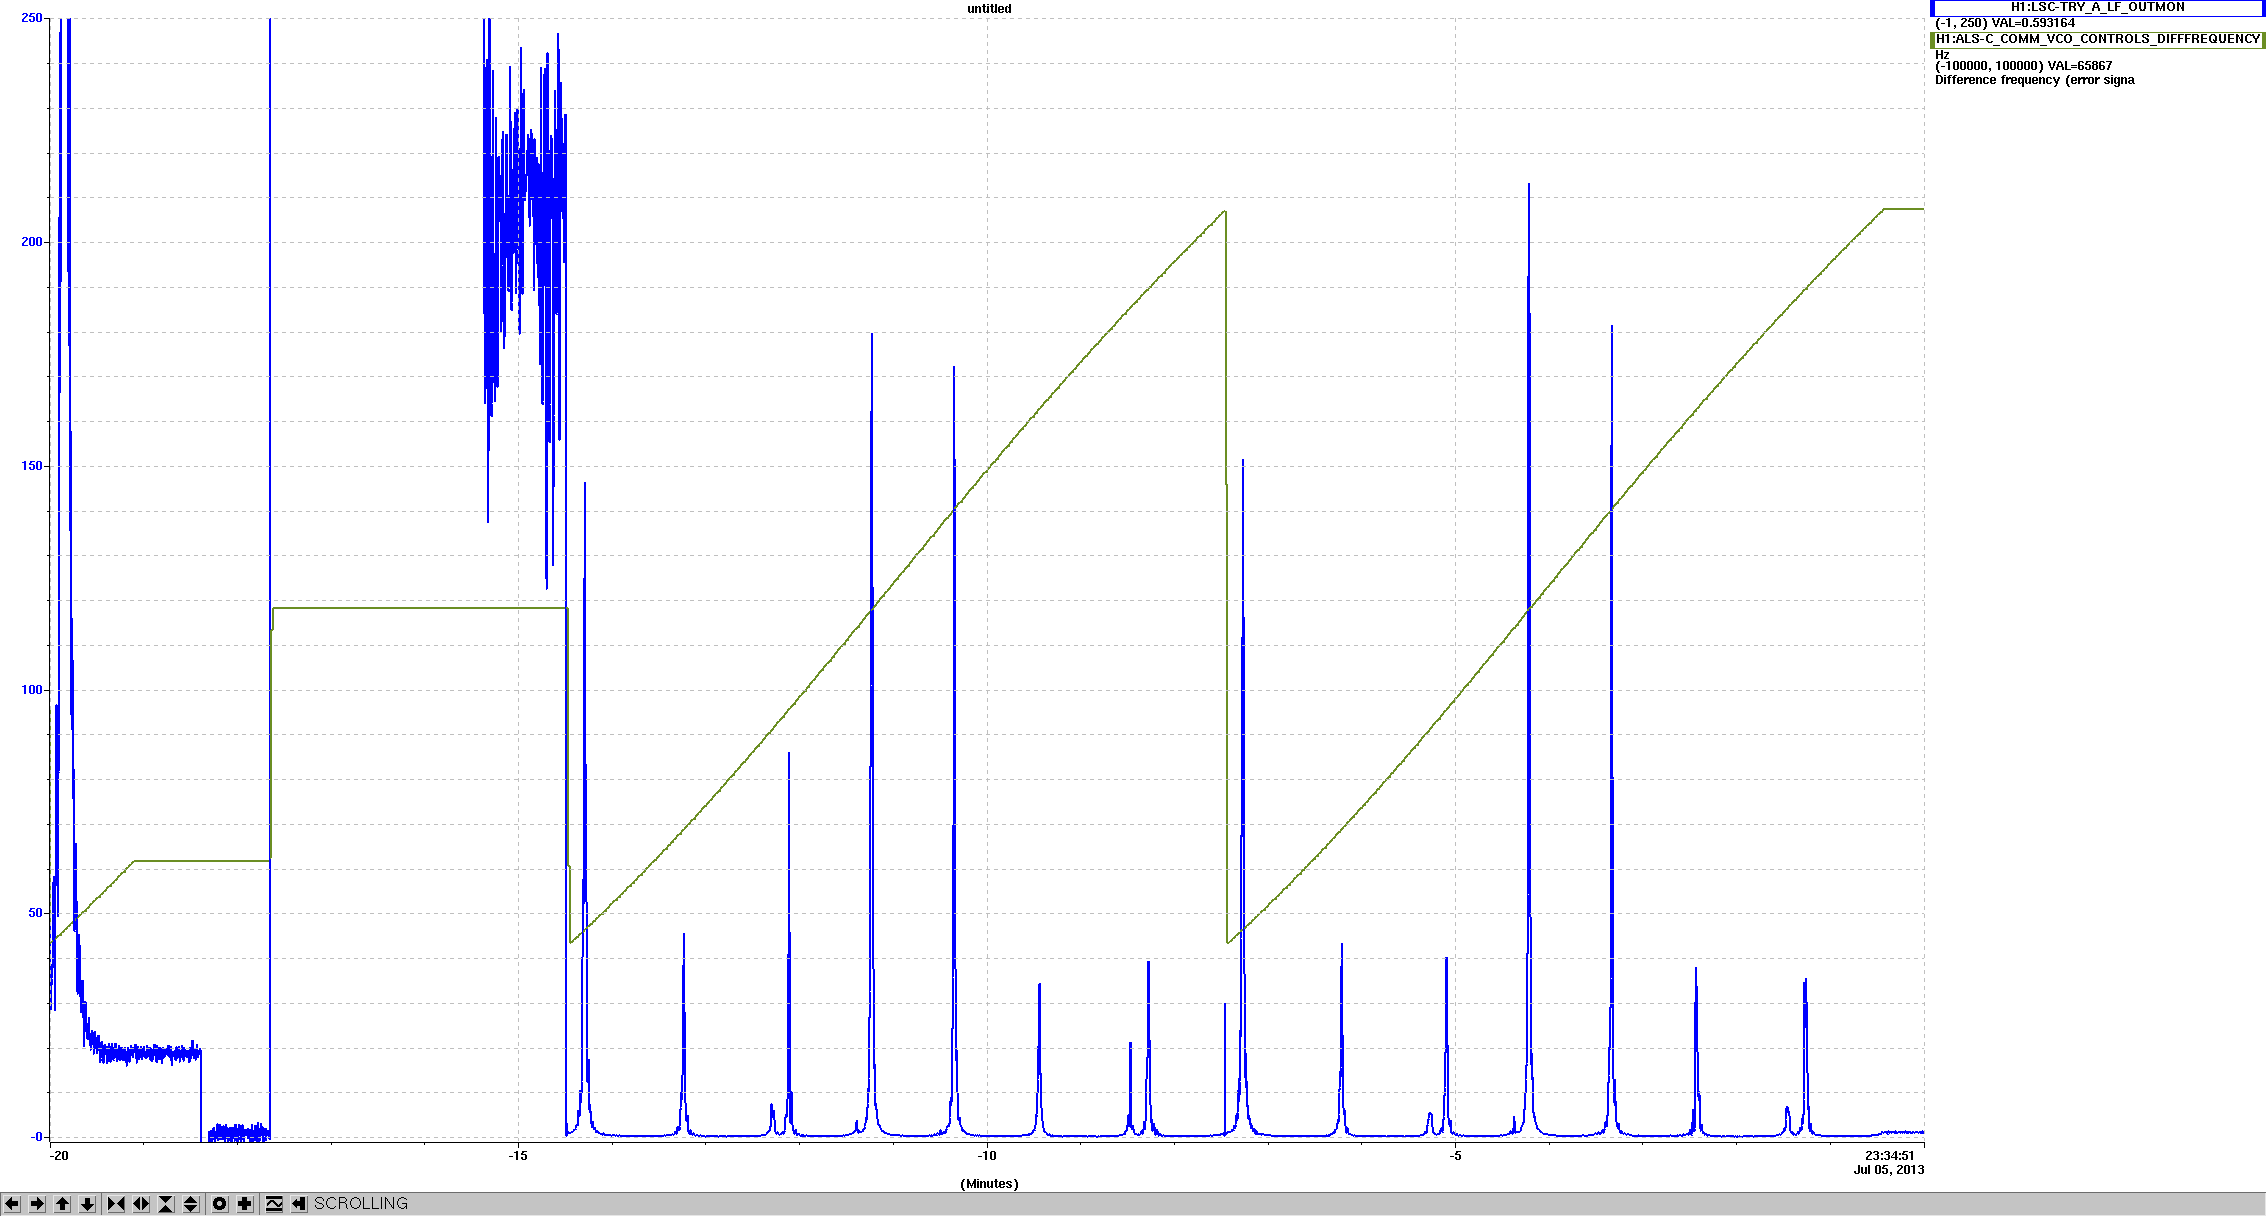
At this stage we rand a mode scan (attached, plots 1 sand 2). The two attached plots are from two adjacent locks - they differ by 1/2 FSR, as expected.
For the 2nd one, the modes sit at

H1:ALS-C_COMM_VCO_TUNEOFS = [-4.744, -3.242, -1.882, -1.638, -0.380,  0.877,  2.187,  3.557,  3.837,  5.348]  V
Frequency offset           =[-62075, -44240, -26212, -22842, -05055,  12770,  30803,  48585,  52070,  69855] Hz

The transverse mode spacing 8945Hz ( 17890 Hz on the VCO)
The odd this is that the frequencies make most if the 10 mode is the biggest.

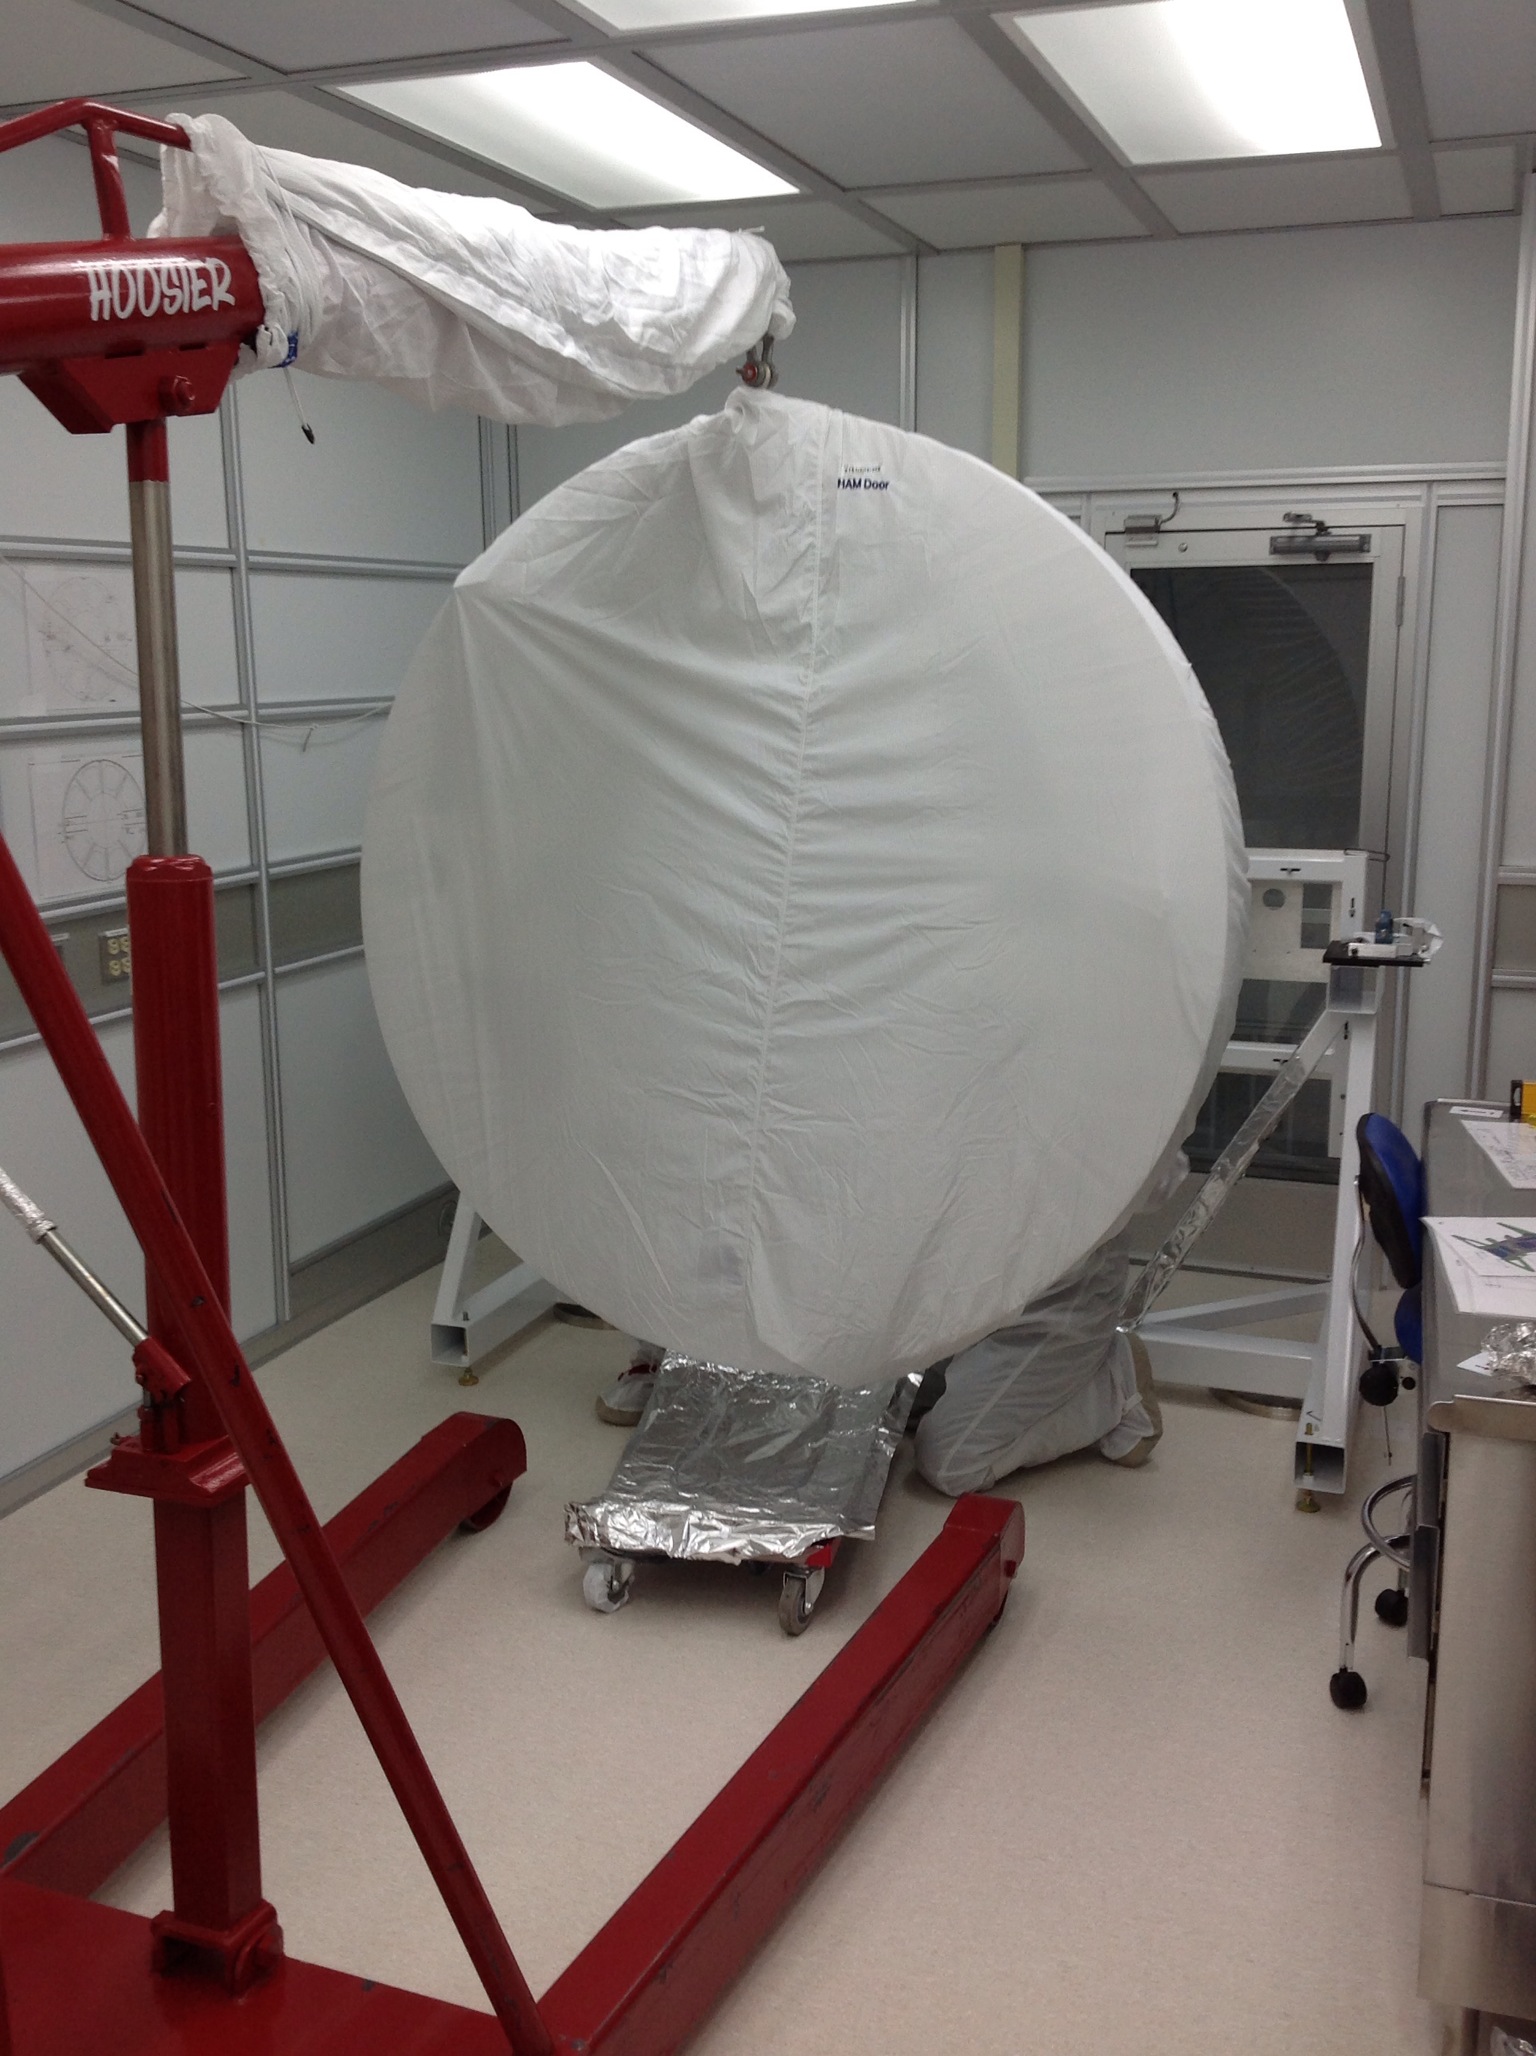
We also redid the transmon camera and LSC diode, taking out the ND filter which distorted the view. While the new image is not distorted, we still don't get a nice modal picture. Not sure why.


Images attached to this report
Comments related to this report
stefan.ballmer@LIGO.ORG - 23:36, Friday 05 July 2013 (6991)
Here is another mode scan after the alignment drifted off more.

We now suspect that we maximized the wrong mode.
Images attached to this comment
daniel.sigg@LIGO.ORG - 17:18, Saturday 06 July 2013 (6993)

Do the frequencies all add up? With a curvature of 2300 m and a cavity length of 4000 m, the individual g parameters are -0.739. The transverse mode spacing then becomes cos-1–(g2 g2)1/2 = 0.765. Multiplying by the FSR, we get 28.7 kHz. Or, –8.8 kHz, if we subtract one FSR. The green cavity field is upshifted relative to the corner. This means that the mode at the smallest apparent scan frequency is the 00 mode.

H1 ISC
daniel.sigg@LIGO.ORG - posted 13:43, Friday 05 July 2013 - last comment - 17:08, Saturday 06 July 2013(6988)
Green sidebands

Yesterday we found a rather large contamination in the corner ALS COMM signal. There is highly non-stationary line around 24.5 MHz. Suspecting this maight be the green RF sidebands that are leaking through, we went to EY to look for their exact location. Measuring the transfer function from the FIBR servo to the PDH error signal, we were unable to identify the sidebands. Next, we took a close look at the notch feature which marks the first FSR. It is located at FSR = 37.4658 kHz with an uncertainty of 0.1Hz. The 3 dB points (down from the flat part) are at 37.426 kHz and 37.506 kHz, 80 Hz wide.

The cavity length then becomes FSR / 2 / c = 4000.88 m.

The RF frequency is f_M = 24.515730 MHz. Dividing by the FSR we get
f_M / FSR = 654.350, or in other words the sidebands ar expected at 0.35* FSR =  13.113 kHz +/- 0.065 kHz.

Looking again at the full sweep and zooming in near 13.1kHz we indeed see a tiny feature in the phase plot around 13.188 kHz. It moves to 12.868 kHz when the RF sidebanda frequency is lowered by 300 Hz.

The only other features in the sweep which are clearly identifyable are at 17.739 kHz and 19.731 kHz symmetrically around half the FSR. These are most likely the second order modes. Dividing 17.739 kHz by 2 we get a corresponding mode spacing of 8.87 kHz. For OAT the mode spacing was measured at 8.92 kHz with a different ITM at a different position.

Comments related to this report
stefan.ballmer@LIGO.ORG - 23:14, Friday 05 July 2013 (6989)
(Daniel, Stefan)

The spurious frequency we observed at the corner beat node is 24.5025 MHz. This is inconsistent with the end station pdh signal.

This signal fluctuates between -25dBc and -8dBc  (-55dBm to -38dBm, with the beat node sitting at -30dBm).

We left a Minicircuit 50MHz high pass in that line - this fixed the glitches in the PFD.
daniel.sigg@LIGO.ORG - 17:08, Saturday 06 July 2013 (6992)

If the spurious signal is a modulation on either the green cavity beam or the corner SHG beam, its modulation would show up symmetrically around the beat node at 78.92 MHz. Meaning the observed line at 24.5025 MHz would corrspond to an offset of 54.4175 Mhz. Or, 27.2088 Mhz, if starts on the 1064 nm beam.

Displaying reports 76541-76560 of 83334.Go to page Start 3824 3825 3826 3827 3828 3829 3830 3831 3832 End