john.worden@LIGO.ORG - posted 09:48, Wednesday 11 December 2013 (8904)
Restart Roughing at X End
Valved in the roughing pump at X end ~9:30.
Valved in the roughing pump at X end ~9:30.
Alexa, Sheila, Cryus, Dave, Arnaud
We went to end X to start working on the table there this afternoon. calibrated the PDs on the table, preparing to set up the PLL. Along the way Cyrus helped us with a problem connecting the End X beckoff computer to SVN (restarting the windows machine) and Dave restarted an epics gateway. We saw that we have half the fiber transmission in the wrong polarization, so we will need to adjust it in the morning. We tried to align the two beams to interfer on the beam splitter, but with only 10uW or so in the fiber beam.
We sent the green beam into the transmon, locked the QPD servos, and set up irises once the ETM and transmon offsets were restored. We then raised the front apperature of the EOM, where the beam seemed to be clipping. This greatly improved the beam shape going into the chamber. After that we looked for the return beam, and could not find it. Arnaud had a look at what might have changed for us. He saw a change of about 40urad in HEPI, but that doesn't seem like enough to explain us completely not seeing the beam.
ISC EX PD Calibrations
Fiber rejected polarization 20uW, 0.23V,30dB gain TI=2000 Ohms, meaning responsivity= 0.19A/W
Fiber transmission monitor- 40uW out of fiber, light on PD too small to measure (we are using the old measurement of the splitting ratio 6%) 0.03V, 2000 Ohms, 30dB gain, gives responsivity 0.208 A/W
Laser IR monitor 0.35mW on PD, 1.68V, 2000 Ohms, 30dB, 0.08 A/W. The beam splitter right before the PD has a spliting ratio of 0.55%.
Green laser monitor (this is the beam rejected from the Faraday, so the power observed here depends on any polarization drift as well). with 53 mW of532 coming out of the laser, we have 0.8 mW on this PD, so a splitting ratio of 1.9%
Fiber BBPD (Fiber A) 0.56mW, 2000 Ohms, no gain, 0.14V responsitivty of 0.125 A/W
[Mark B Chris W Arnaud]
After modifying the tip tilts model this afternoon, I adapted the adl files to match with the new channel names, in order to resurrect the medm screens. The filterfile, as well as the snap file were also adapted. The only thing missing in order for the system to work is to connect the masterswitch, which will be done tomorrow morning. Other than this, everything seems fine, cf screenshot
Details of the process :
* Created a htts folder in /opt/rtcds/userapps/release/sus/common/medm/
* Copied the 42 adl files located in /opt/rtcds/userapps/release/asc/common/medm/asctt in the new htts folder
* Modified their filename from ASC_CUST_TIPTILT* to SUS_CUST_TIPTILT*
* Modified the content of each of them by changing the ASC/asc occurences to SUS/sus and ASCTT/asctt to SUSHTTS/sushtts (except for the IOP channels which were unchanged)
* Modified the sitemap to point out to the correct adl files
* Modified the H1SUSHTTS.txt filterfile that has been generated when installing the model this afternoon, to make it match with the old H1ASCTT.txt filterfile thanks to some magic tricks from Chris
* Created a softlink H1SUSHTTS.txt -> /opt/rtcds/userapps/release/sus/h1/filterfiles/H1SUSHTTS.txt
Bonne nuit !
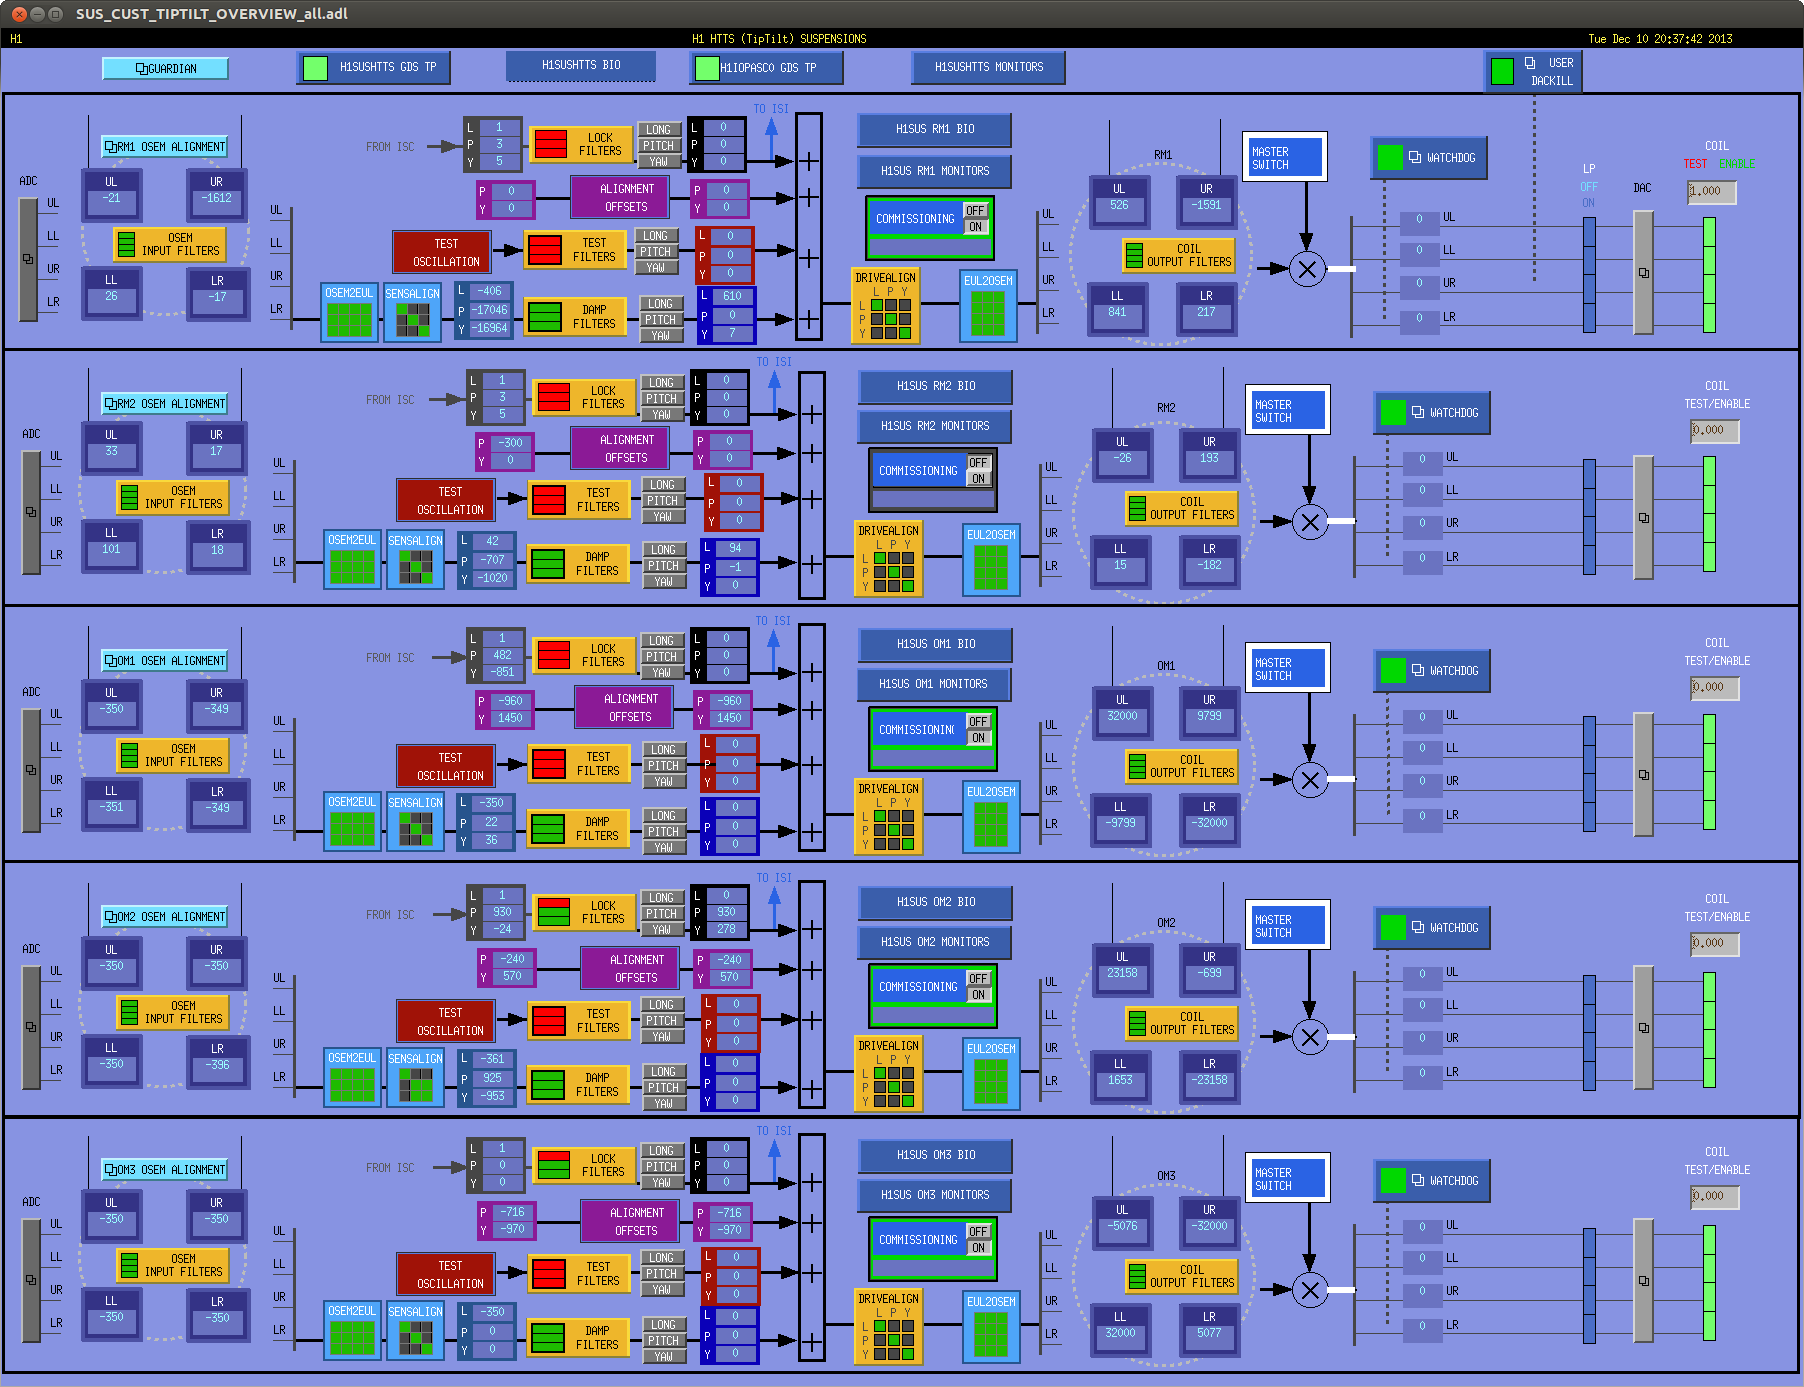
Now the master switch is connected, RMs medm screens are functioning, as well as the damping
I looked into IMC alignment changes from before we started the pump down, to the current position. What I found is that MC1 pointing has changed dramatically. Pitch is changed by 332urad, and yaw by 184urad, when comparing the optic as it hangs without any drive. MC2 has seen changes as well, but smaller, with ptich changed by 52urad and yaw 12urad.
The MC1 pointing changes reuslt in beam position changes of 5.3mm in pitch and 3mm in yaw, at 16m. Very signiicant.
| no drive to optics | change in optic position, 11/25 to 12/10, in um and urad | beam shift in position at 16m, in mm |
| MC1 - M3 | ||
| L | 1 | |
| P | 332 | 5.3 |
| Y | 184 | 2.9 |
| MC2 - M3 | ||
| L | -7 | |
| P | 52 | 0.8 |
| Y | 12 | 0.2 |
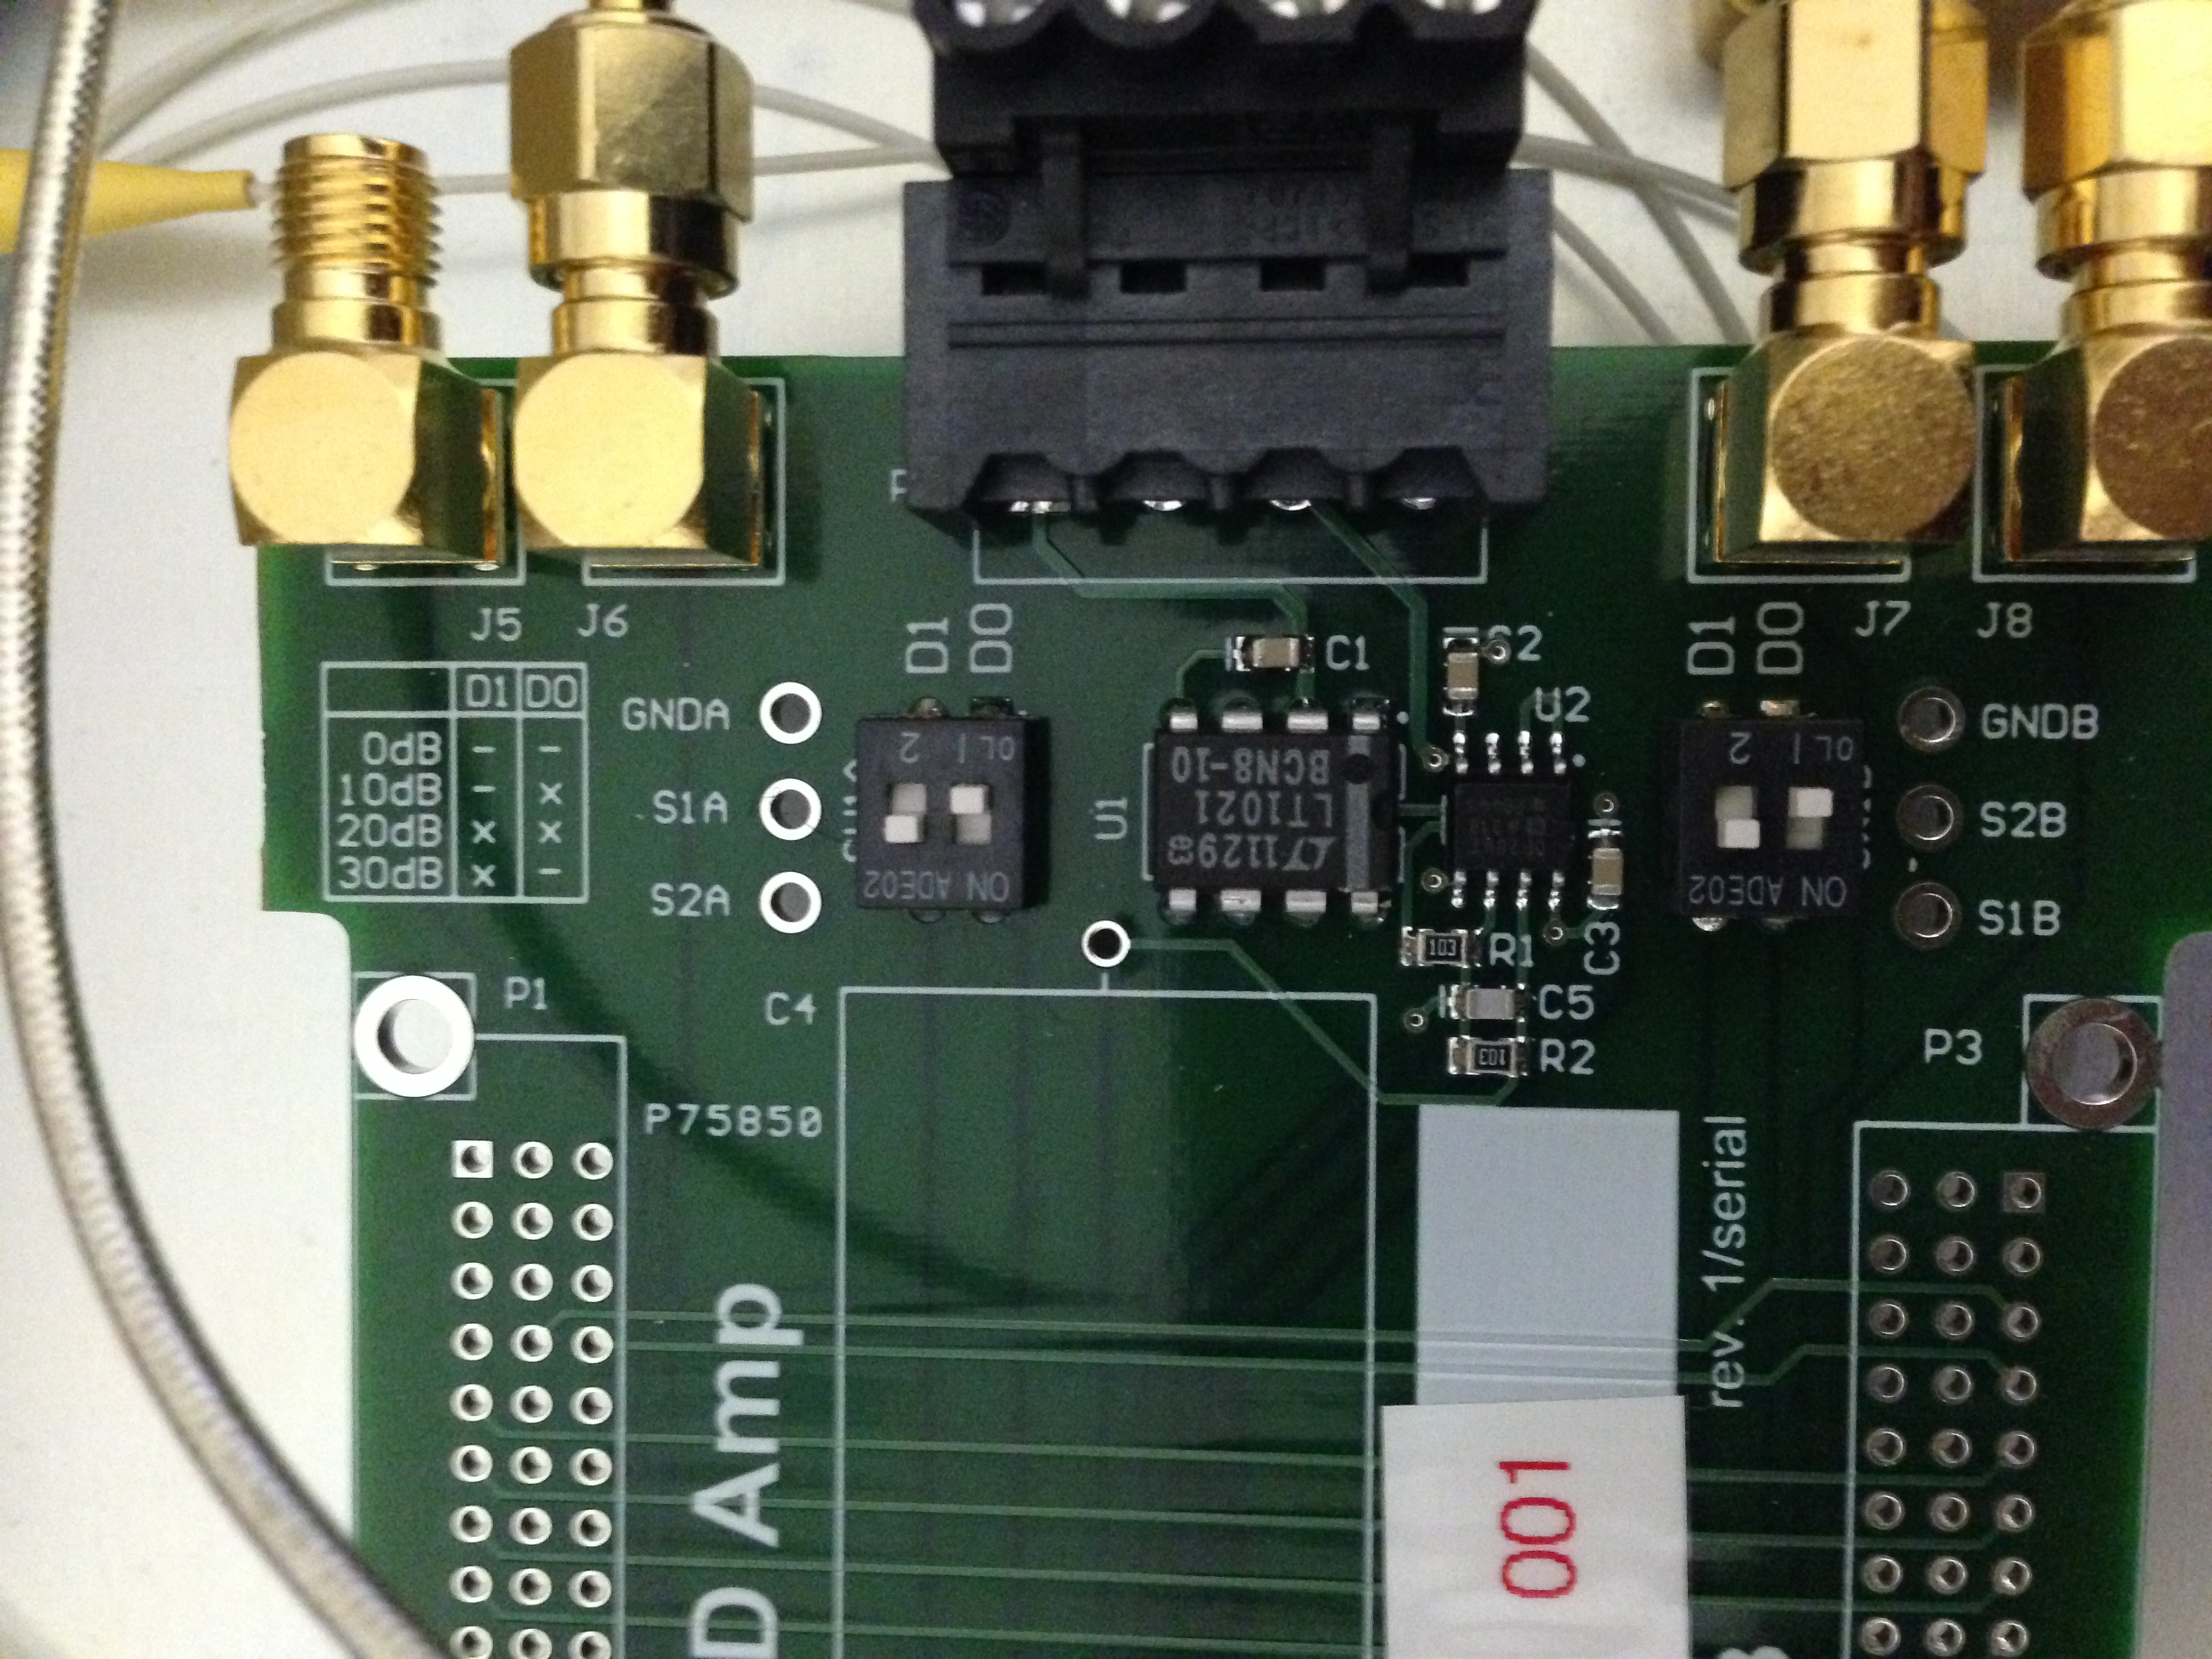
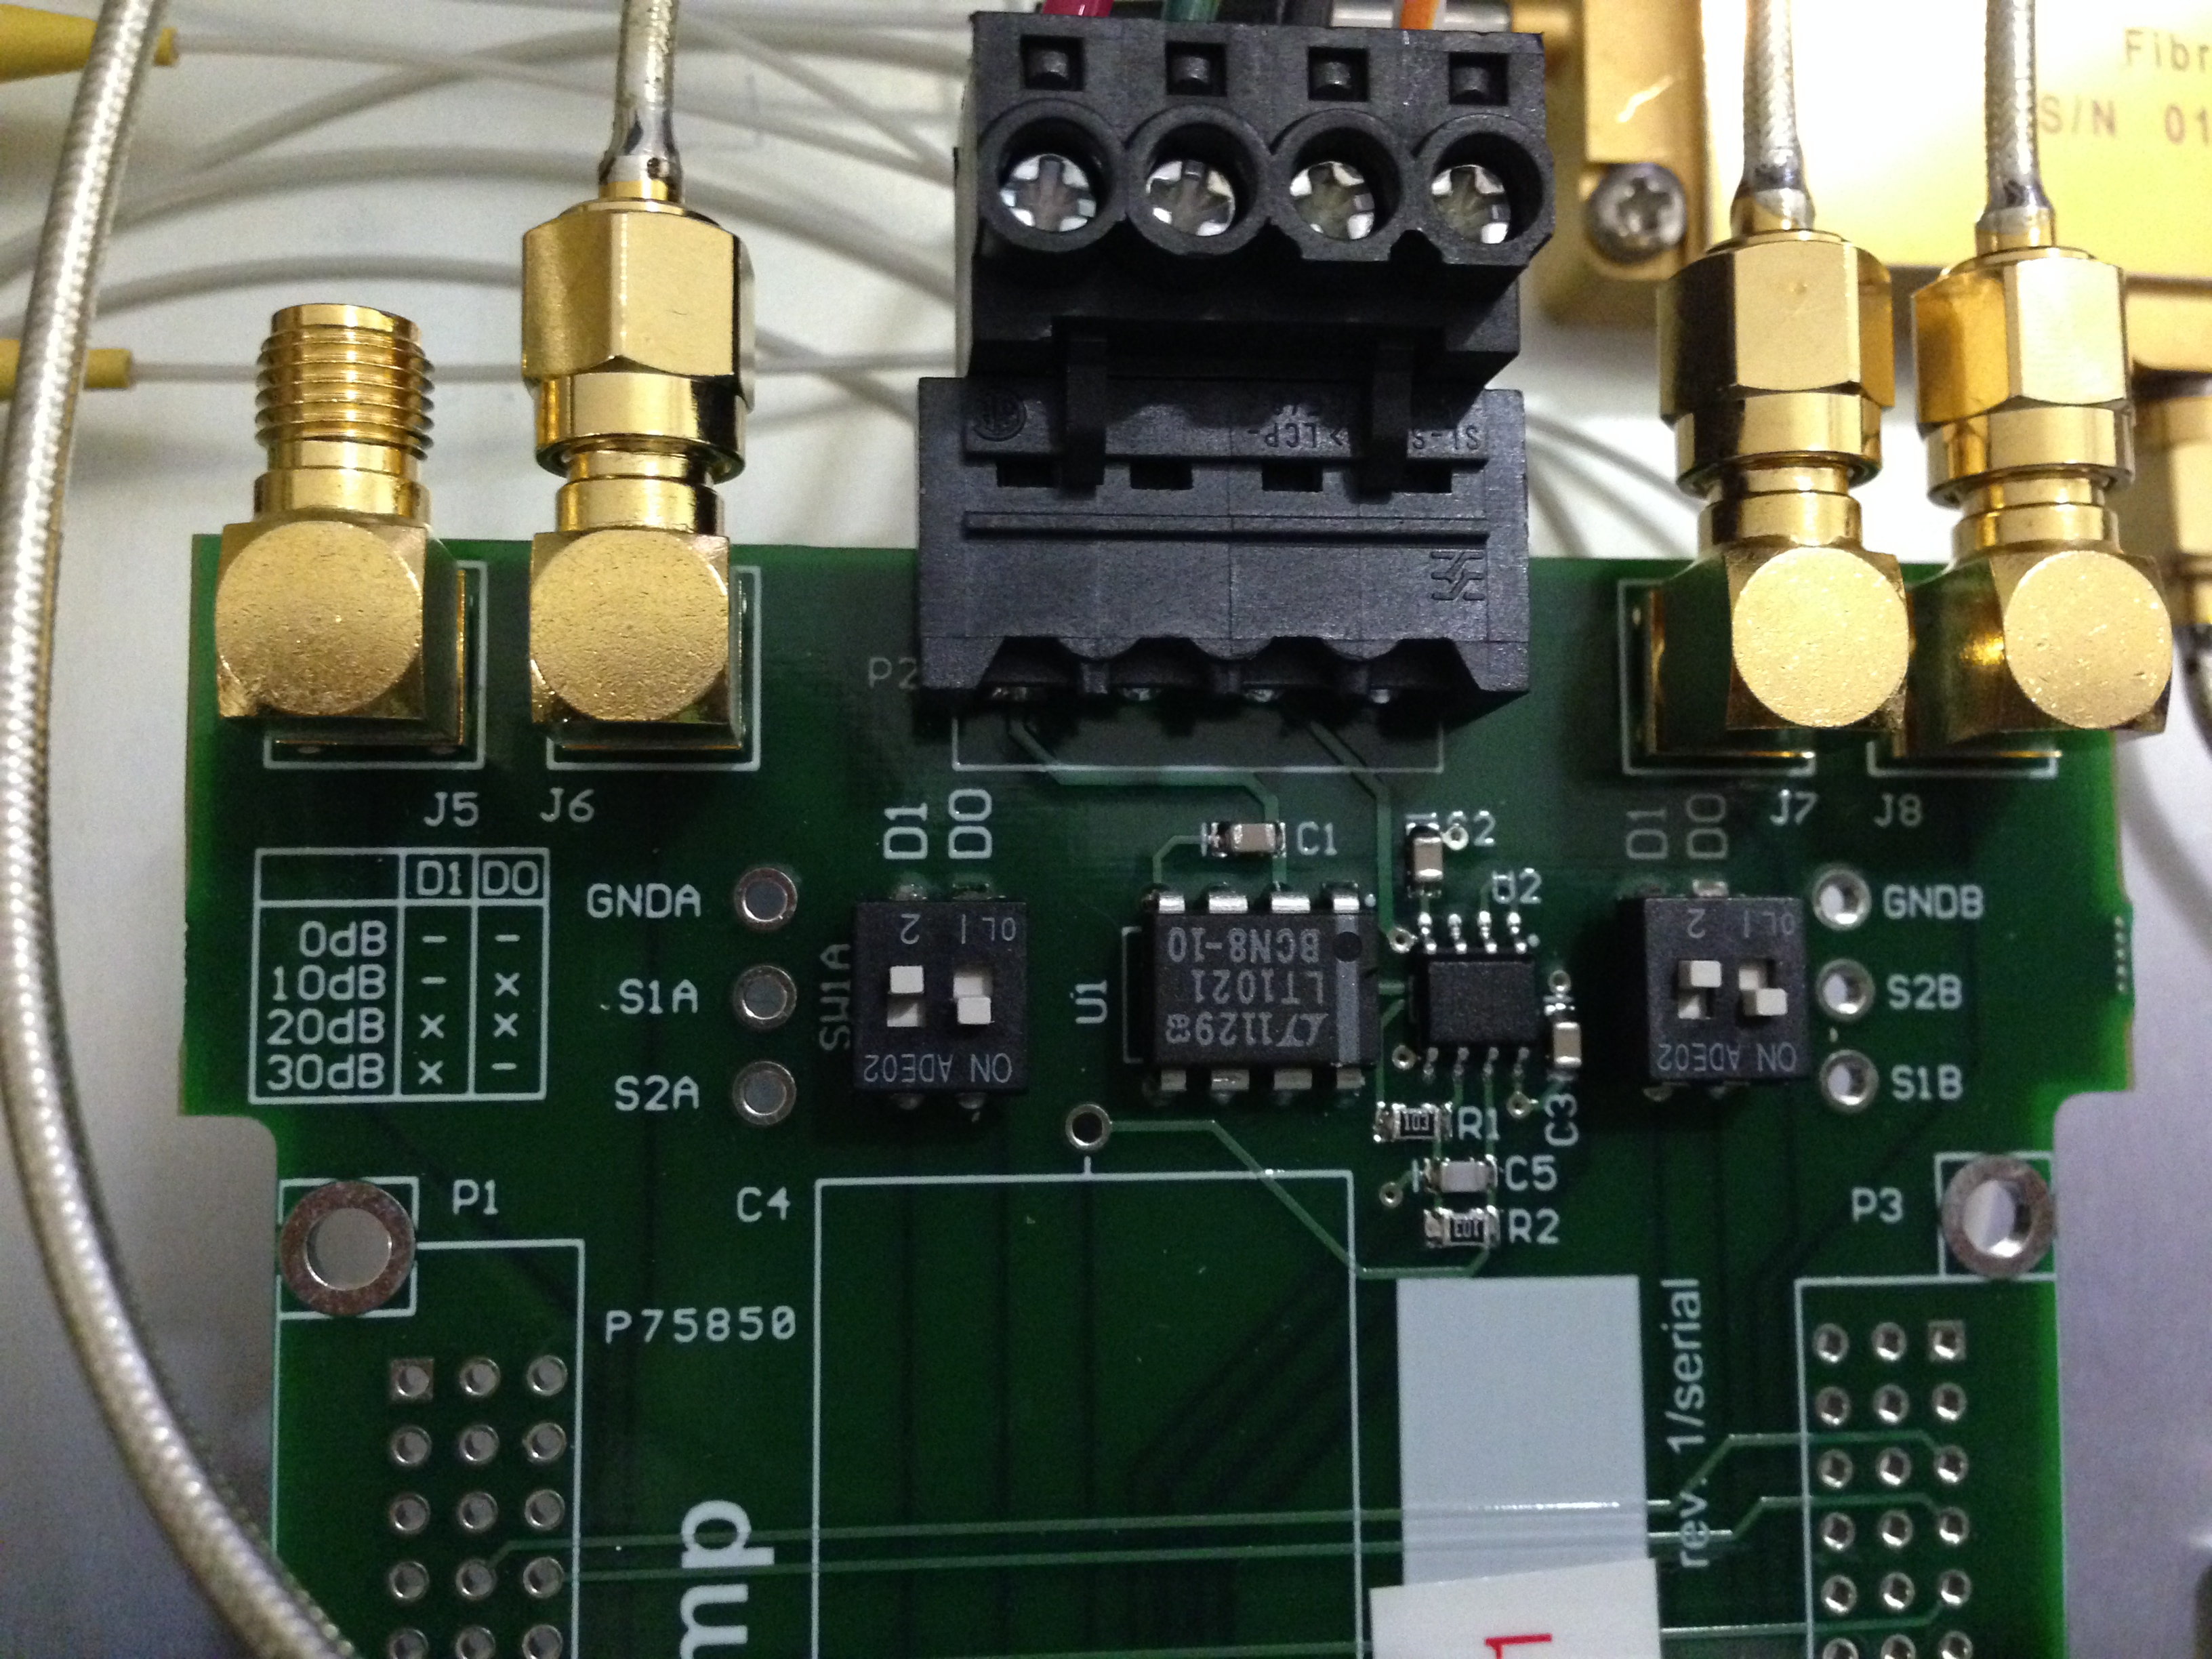
As noted in alog6341, the gain on the Dual PD Amp board was set to 30dB (photo 1). I have reduced the gain to 10dB (photo 2). However, I still see saturation at 10V in the external PD monitor. Tomorrow I will try reducing the gain to 0dB.
I have reset the internal PD gain to 30dB (since we were never saturating there), and set the external PD gain to 0dB.
For the external PD:
Transimpedance = 20kOhm
Responsivity = .268A/W
Power @ ext PD = 0.93mW (w/ a drift of 7% of the ref cav alignment)
Gain = 0dB
Volts = (resp) x (power) x (trans) x (gain) = 5V
...Ignore above calculation for external PD...
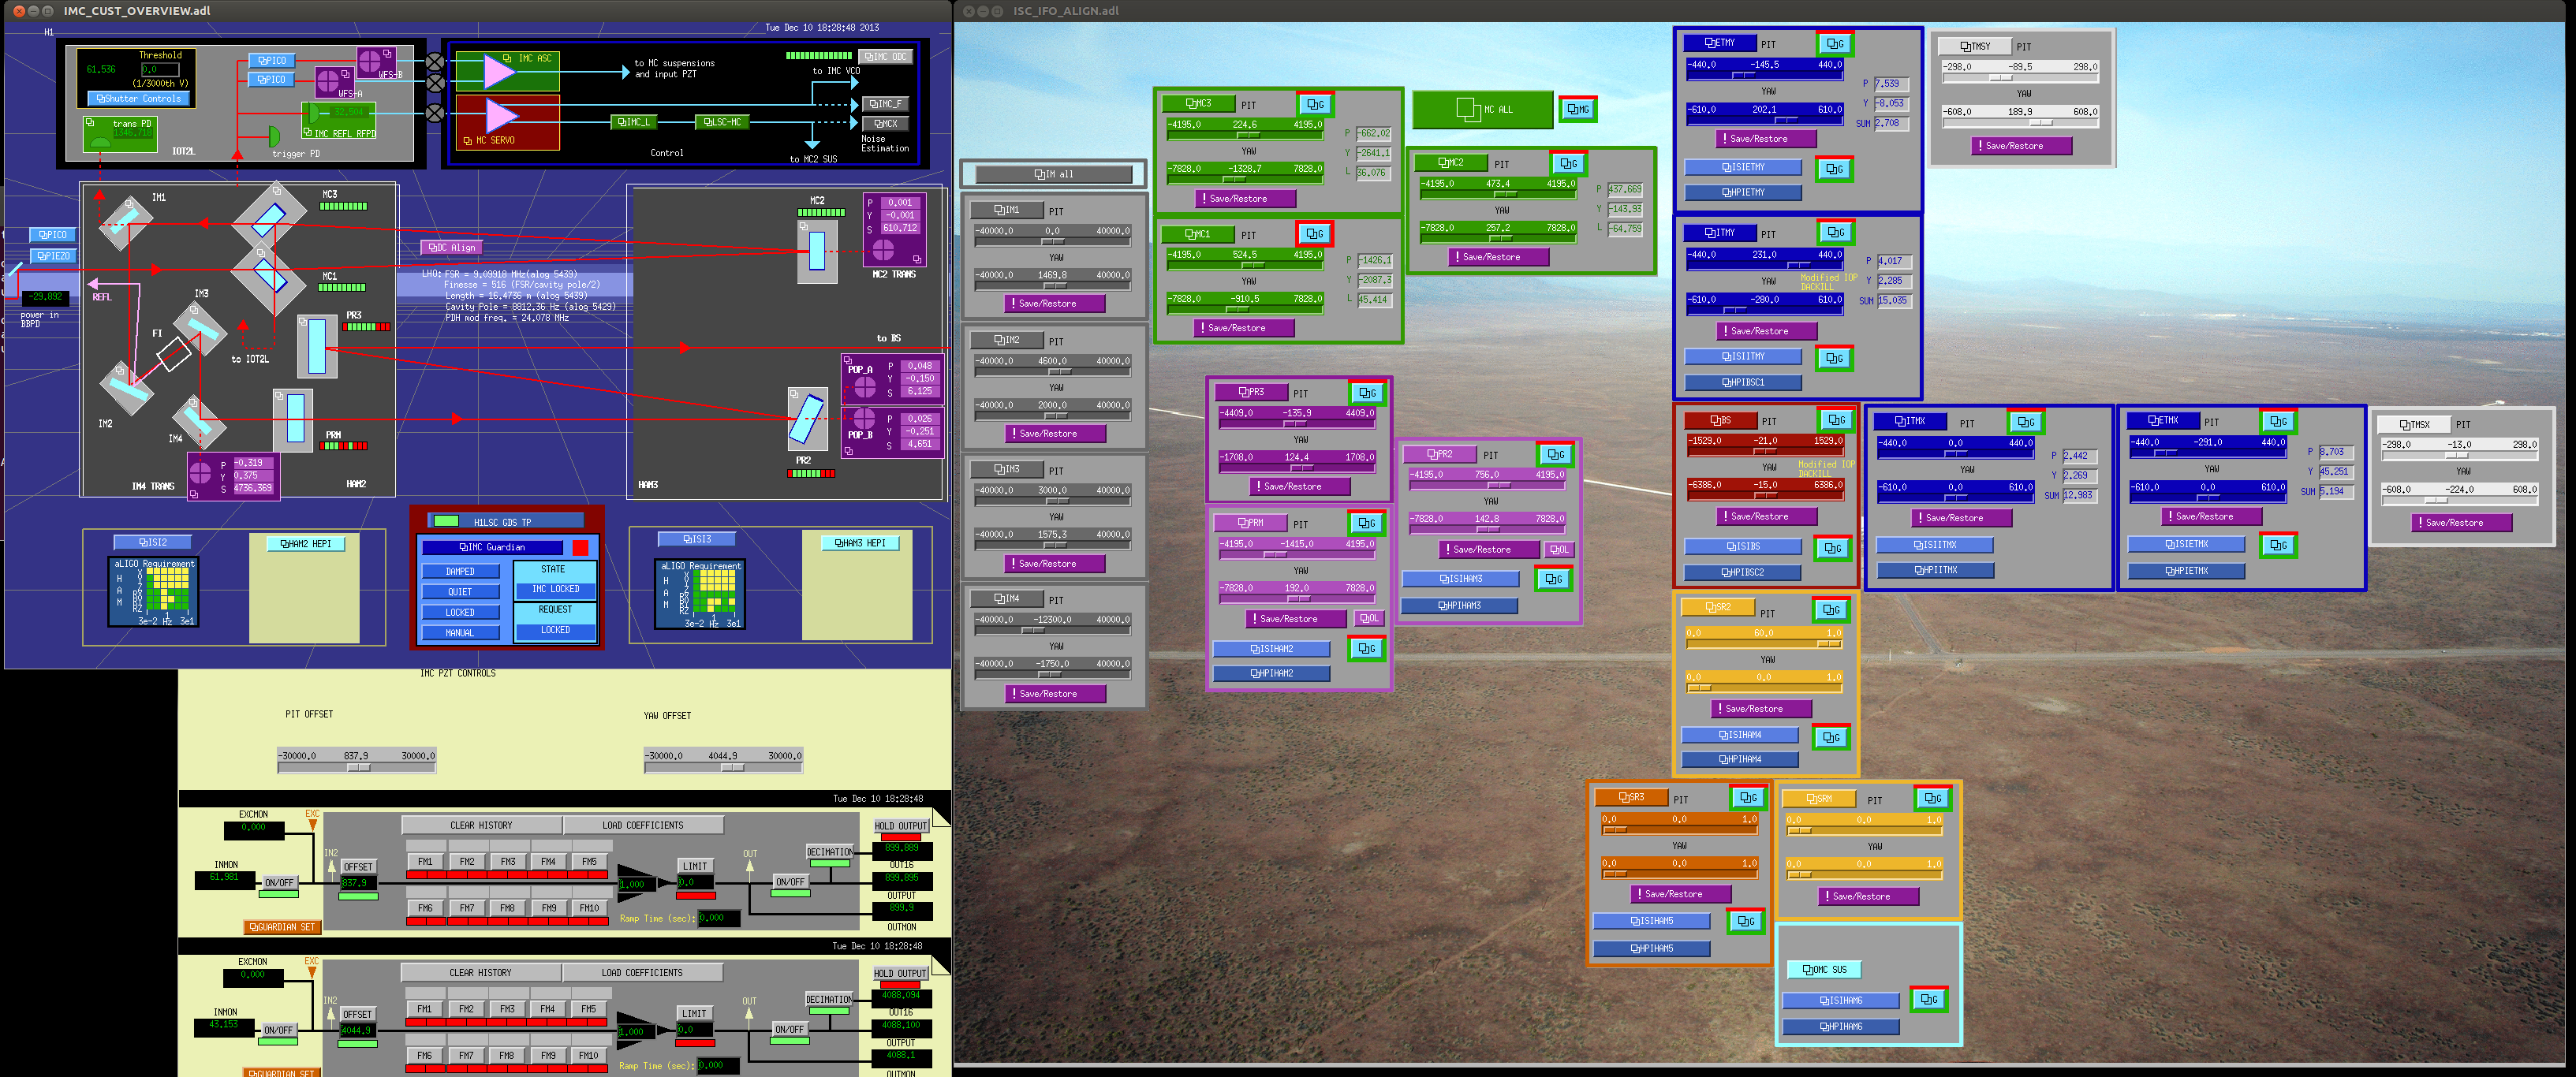
Since we postponed the HAM1 in-vac mission today, we moved on to the interferometer alignment for now.
Here are what I did:
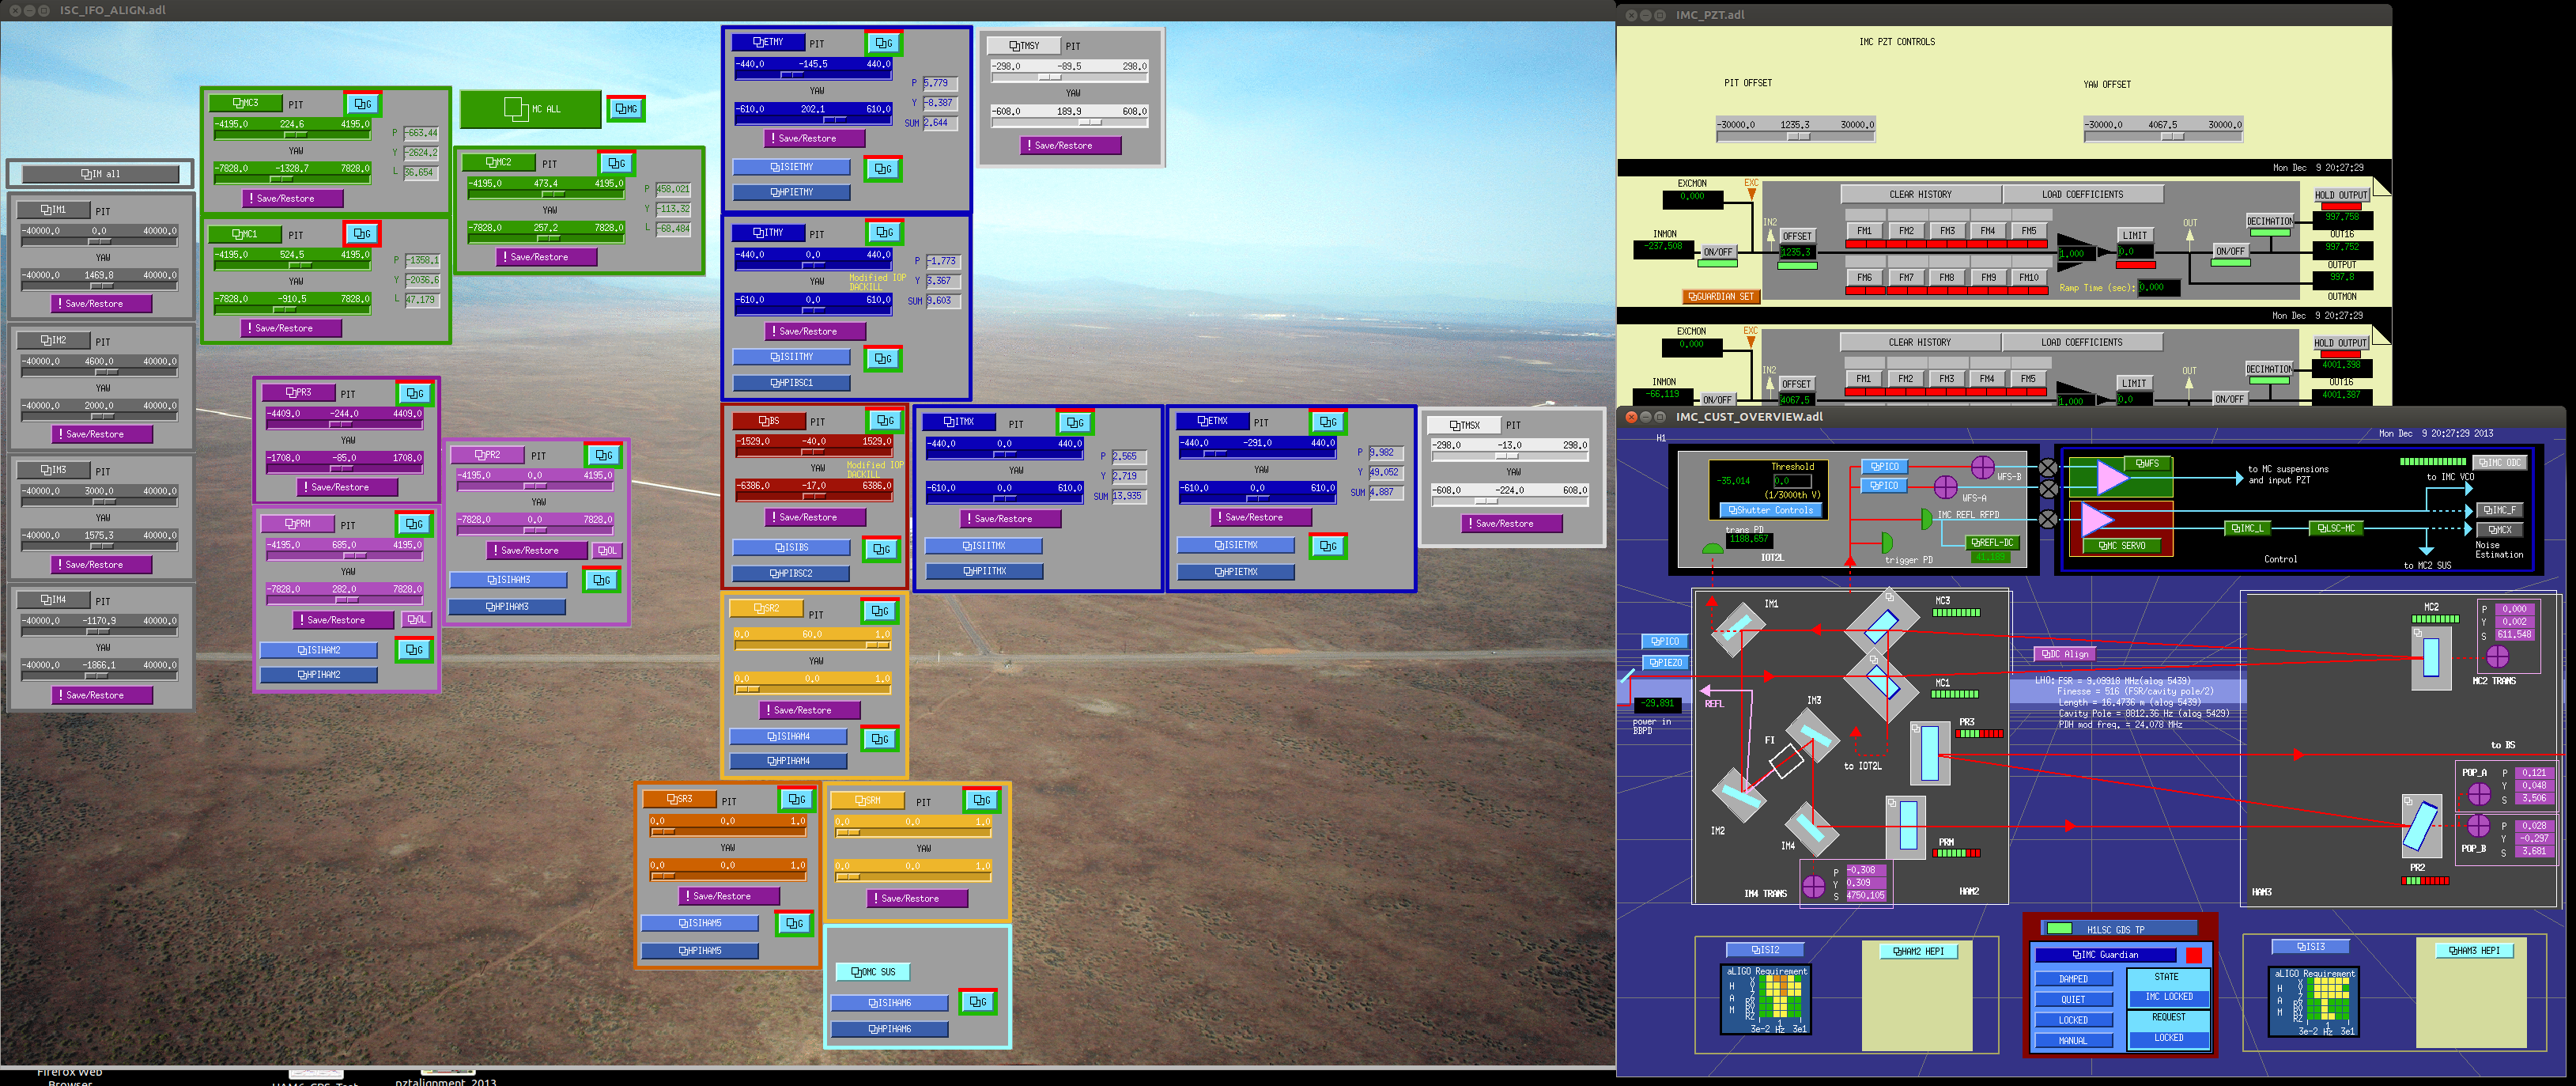
The attached is a screenshot of the resultant vertex alignment.
Travis, Angus and Alastair contued with the weld practice at end Y. Travis welded in all 4 practice fibres on the test set up and hung the dummy mass. We re-arranged the weld trolley and fibre preparation table positions to allow line of sight for Doug's alignment tooling during the welding. All tooling is functioning as expected. Tomorrow first thing we will remove the "old" ETM from the structure to allow TCS to work on the ring heater and then pop in the "new" ETM in the afternoon and do full alignment of the masses in preparation for welding again on Thursday
Days Activities
[Jeff Dave Arnaud]
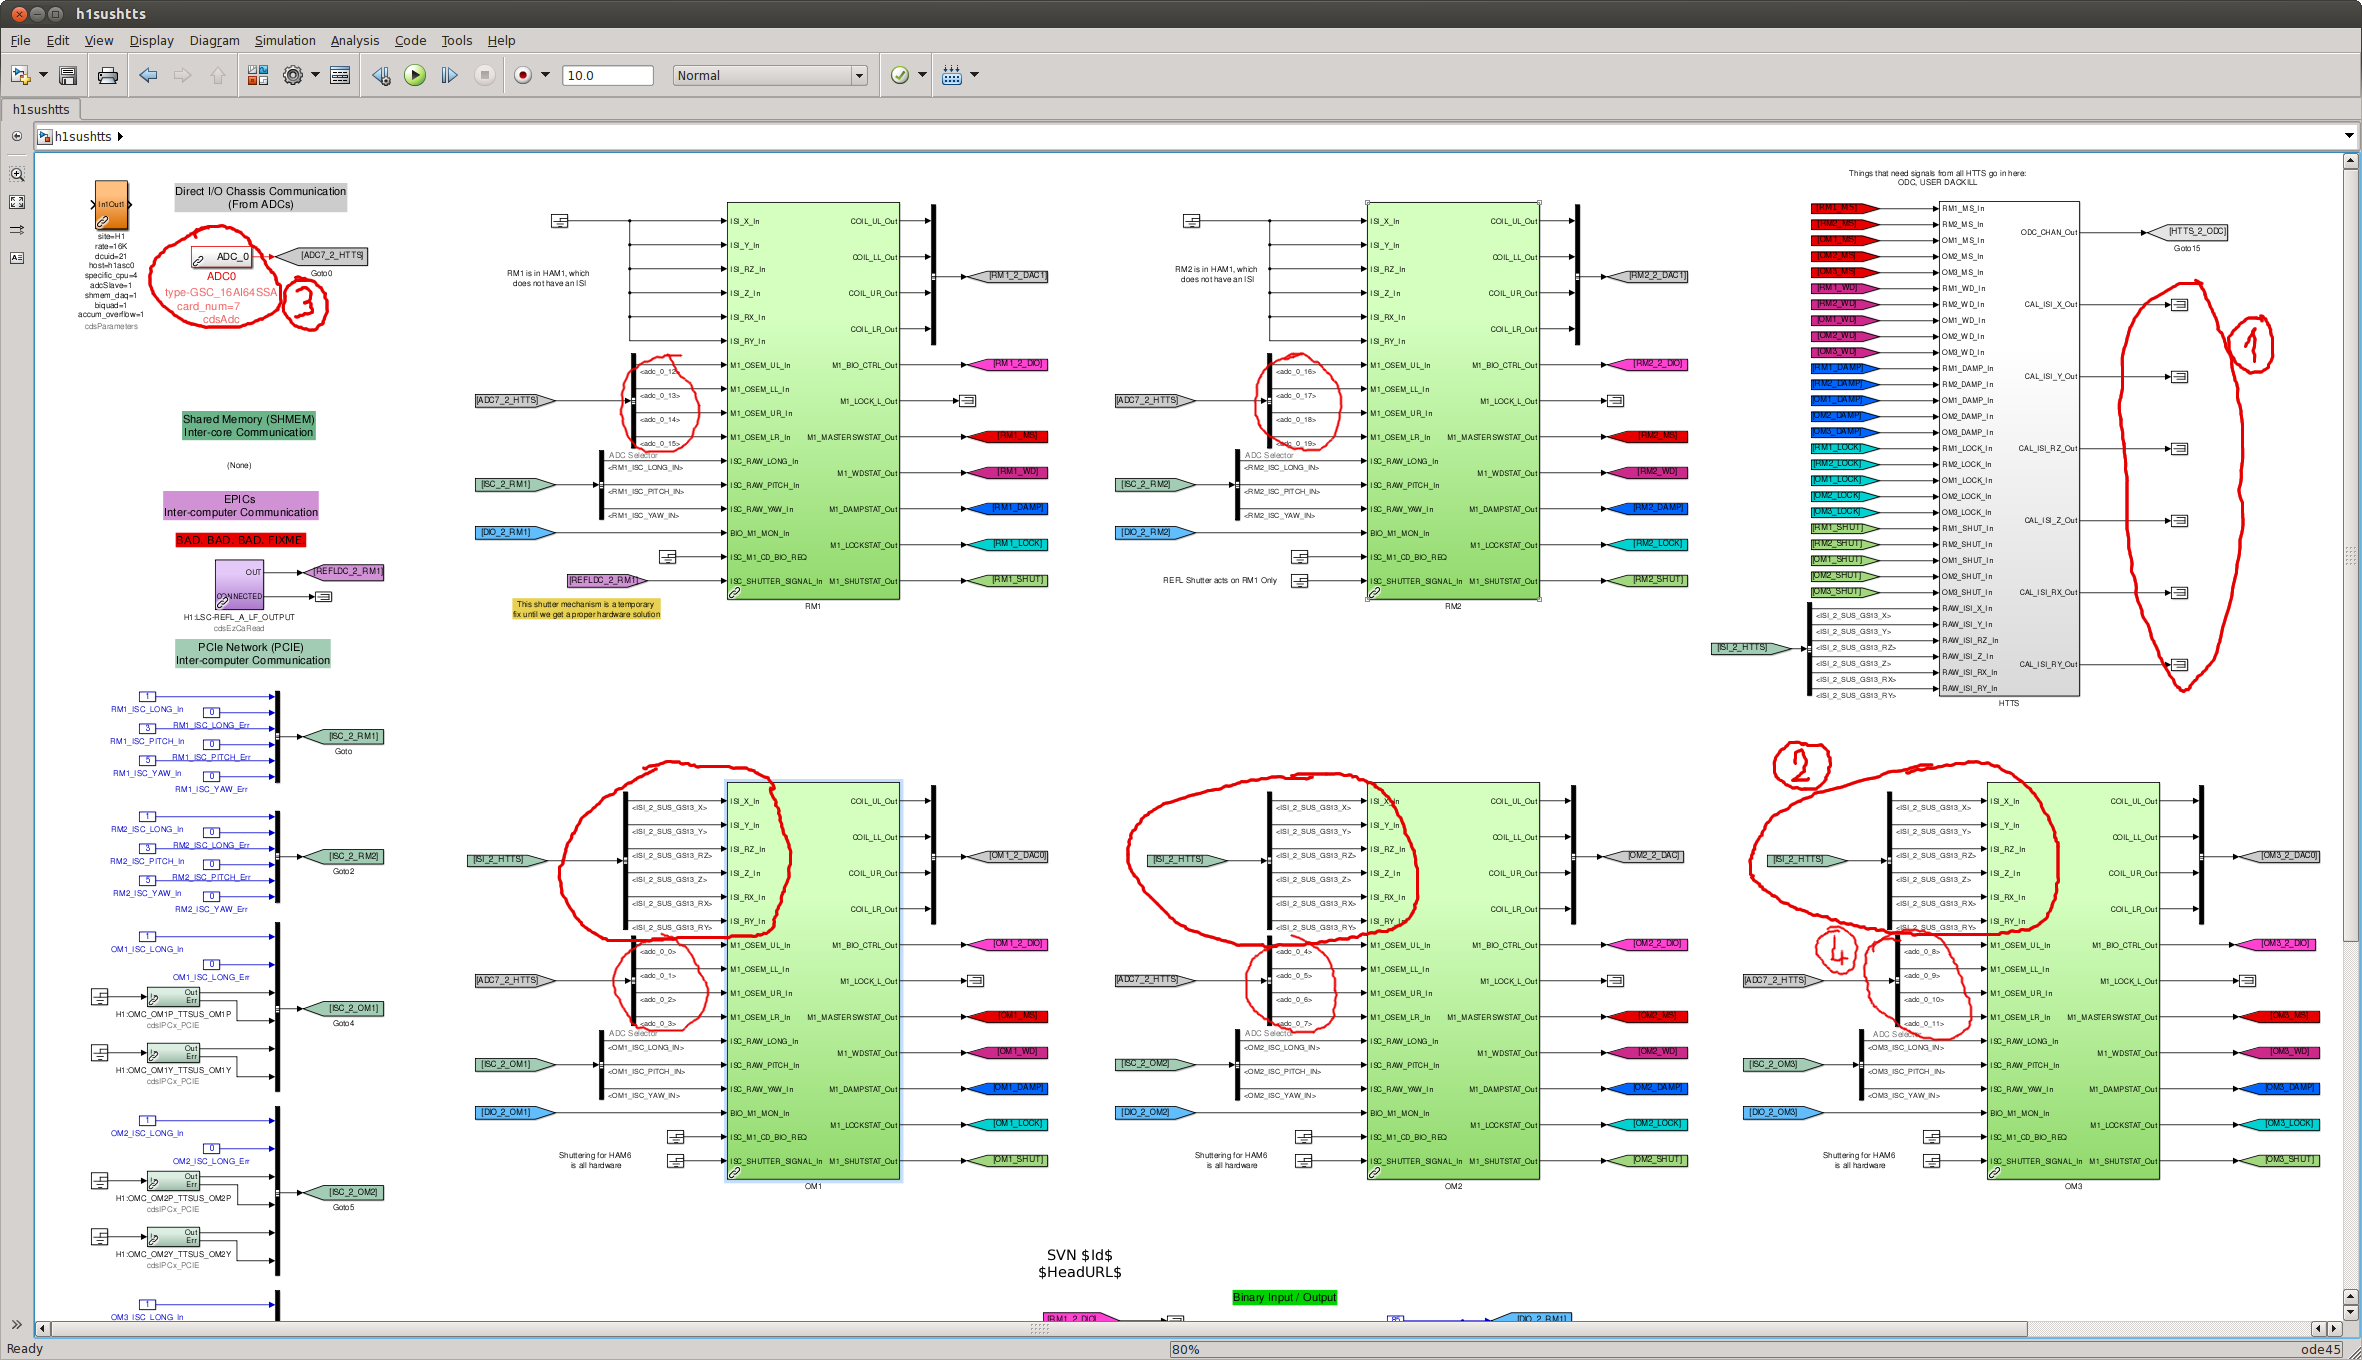
After Keita reported he couldn't access to tip tilts medm screen to damp the suspension (which hasn't been updated yet), I looked at RM1_M1_OSEMINF signals to see if I could damp it from the command line. Although, the readback was zero even though we were seeing numbers out of the ADC, which directed us to a model issue. Some modifications from last week would prevent the model to compile properly so we undid some of the changes and fixed some other issues. After restarting the models after the changes, the channels were back alive. Last thing to do is to resurrect the medm.
Modifications made on
**h1sushtts.mdl** (1st screenshot)
1) Grounded the calibrated ISI signals outputs from HTTS
2) Linked the ISI signals directly from the IPC to OM1/2/3, instead of the ones going out of HTTS
3) Changed ADC7 to ADC0
4) Modified the channels to match with 3)
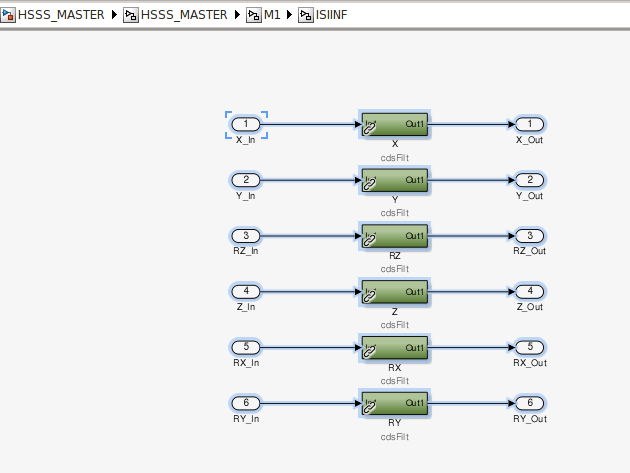
**HSSS_MASTER.mdl** (2nd screenshot)
1) M1/ISIINF CdsEpicsOuput banks changed to CdsFilt banks
As soon as we flipped the beam diverter open we got the REFL beam on ISCT1.
Then we went into HAM1 and noticed that the beam was moving by a huge amount in PIT. TTs were not damping at all. Turns out that that was a TT model problem. SUS people and Dave Barker are working on it.
We will resume our work when TTs are fixed, and in the mean time we'll look at the IFO alignment.
We made one measurement using NanoScan by misaligning the 50% BS after the HWP to direct the beam to the head. The BS and Nanoscan were approximately 8"x44" apart (give or take an inch).
| 1/e^2 (13.5%) diameter mean | stddev | Goodness of Gaussian fit mean | stddev | Profile Averages | |
| X (axis 1) | 3851.01 um | 1.982 um | 0.01 | 0.000 | 10 |
| Y (axis 2) | 3959.23 um | 1.232 um | 0.01 | 0.000 | 10 |
| 45 deg (axis 1) | 4117.74 | 1.475 | 0.02 | 0.000 | 10 |
| 45 deg (axis 2) | 3845.62 | 0.763 | 0.00 | 0.000 | 10 |
These are just the numbers NanoScan software dumped. As was partially captured by https://alog.ligo-wa.caltech.edu/aLOG/index.php?callRep=8437, our experience is that Nanoscan, ModeMaster (takeing the beam size at the head) and hand-driven knife edge agree with each other within 10%.
power before AOM :31.1mW
after single pass: 24.1mW 77% single pass effiicency
after double pass: 20.45mW 66% double pass efficiency
The beam position on the iris after the retro reflecting mirror has not changed.
I tuned the upper periscope mirror pitch, this brought the transmitted PD voltage back to 1 V.
We have 5.8 mW in the ALS path before the Faraday, 5.33 mW after the Faraday, 4.3mW going towards the fiber, and 1.04 mW going towards the fiber launch PD (external on the fiber dist box).
In this configuration, I measured ~3.1mW at the input of the ALS fiber distribution and 100uW at the MSR.
and the end station we see 40 uW coming out of the fiber, not really enough.
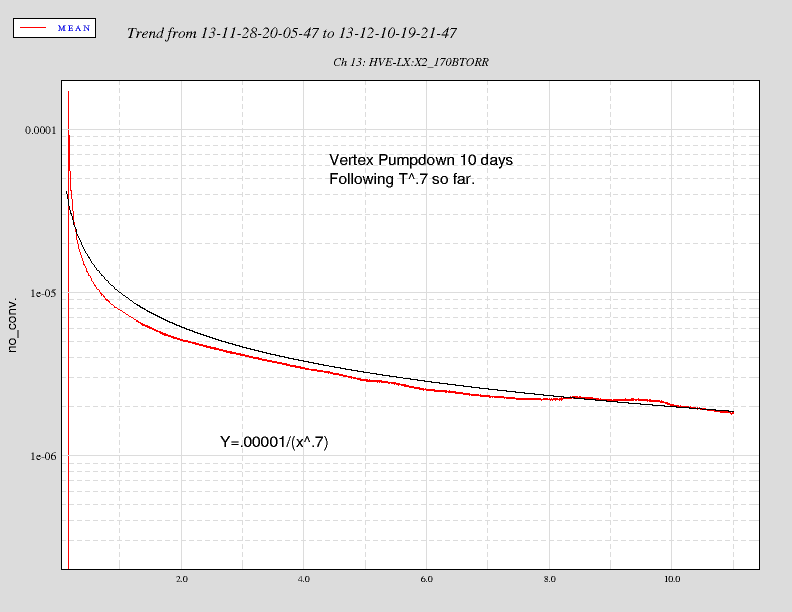
After 11 days of pumping the vertex volume - HAM2,3, BSC1,2,3, and the X manifold.
Alexa, Sheila, Kiwamu
The goal of the day was to get the retro-reflection from PRM all the way back to PSL. And this was achieved. We are ready for the HAM1 incursion.
This work involved:
In the process of aligning PRM, we looked at the in-vac WFS in HAM1 with a viewer and saw the reflection light hitting the WFSs. We didn't check the beam on the WFSs after obtaining the retro-reflection, but they should be pretty close to the good alignment. Then after obtaining the retroreflectin, we went to ISCT1 to see if we get some light on the table, but we didn't find it. Maybe it is blocked by an optic for some reason as we can see scattered light. So the first thing we should do before the incursion is to check the beam alignment in HAM1 and see if makes sense. It might be possible that the alignment in HAM1 is bad even though we have a retro-reflection back to PSL. In this case, we should steer IM1 and IM2 to change the rejection angle of the REFL beam while keeping the retro-reflection.
P.S. We left PSL in the commissioning mode. The IMC autolocker is running on opsws3. The attached is the alignment that we established. I tried steering the IM4 trans picomotor, but it seemed not moving at all.
Today, Jeff, Andres and I finished disassembling the lower structure and 4 lowest masses from the ETMy QUAD upper structure. This involved pulling all of the reaction lacing cables up the chain. As well, we had to cut the fibers off of the previously monolithic HIFOy masses in the suspension. When Travis went to cut the first fiber out, the lower mass was apparently under some small load and the fiber broke it and it's adjascent fiber off. We think there was still some load on the fibers even though all of the masses had been locked in place. We raised the test mass before proceeding to cut the next 2 fibers out. Jeff, Andres and I then split the chains and left the main chain resting on the Genie arms and the reaction chain on the 5-axis/scissor lift equipment.
After lunch, Angus and I pulled the PUM out of the suspension and canned it (Gerardo - we're missing a top o-ring plate in the empty can - so the canned pUM is missing it. We need to steal one from the next can out there). I then cleaned the lower sus via vacuum while Angus continued preps with Travis in the weld area. We then stuffed the new PUM and got practice fibers loaded into the practice suspension for welding tomorrow.
I'm now out the rest of the week, but here is the sequence of tasks that need to happen next:
TUE AM - Gerardo / Travis pull the Test Mass, park the Main in the weld room, park the Genie under the reaction chain for added safety
TUE mid-AM - Travis / Angus / Alastair start practice welding (make sure to get panels in place)
TUE mid-AM - TCS peeps swap the ring heater (yes, likely in laser hazard, sorry)
TUE aft - finish practice weld
TUE aft - Gerardo / one of the weld crew stuff the new test mass
WED - set LS main mass DOFs and start real welds
Y'all already have mad skills, so smooth running and good luck to you!
Sensor's rotatable 2.75" CFF had a significant "ding" on knife edge -> don't have spare -> messaged with stone -> likely to be a leaker -> marked for leak check