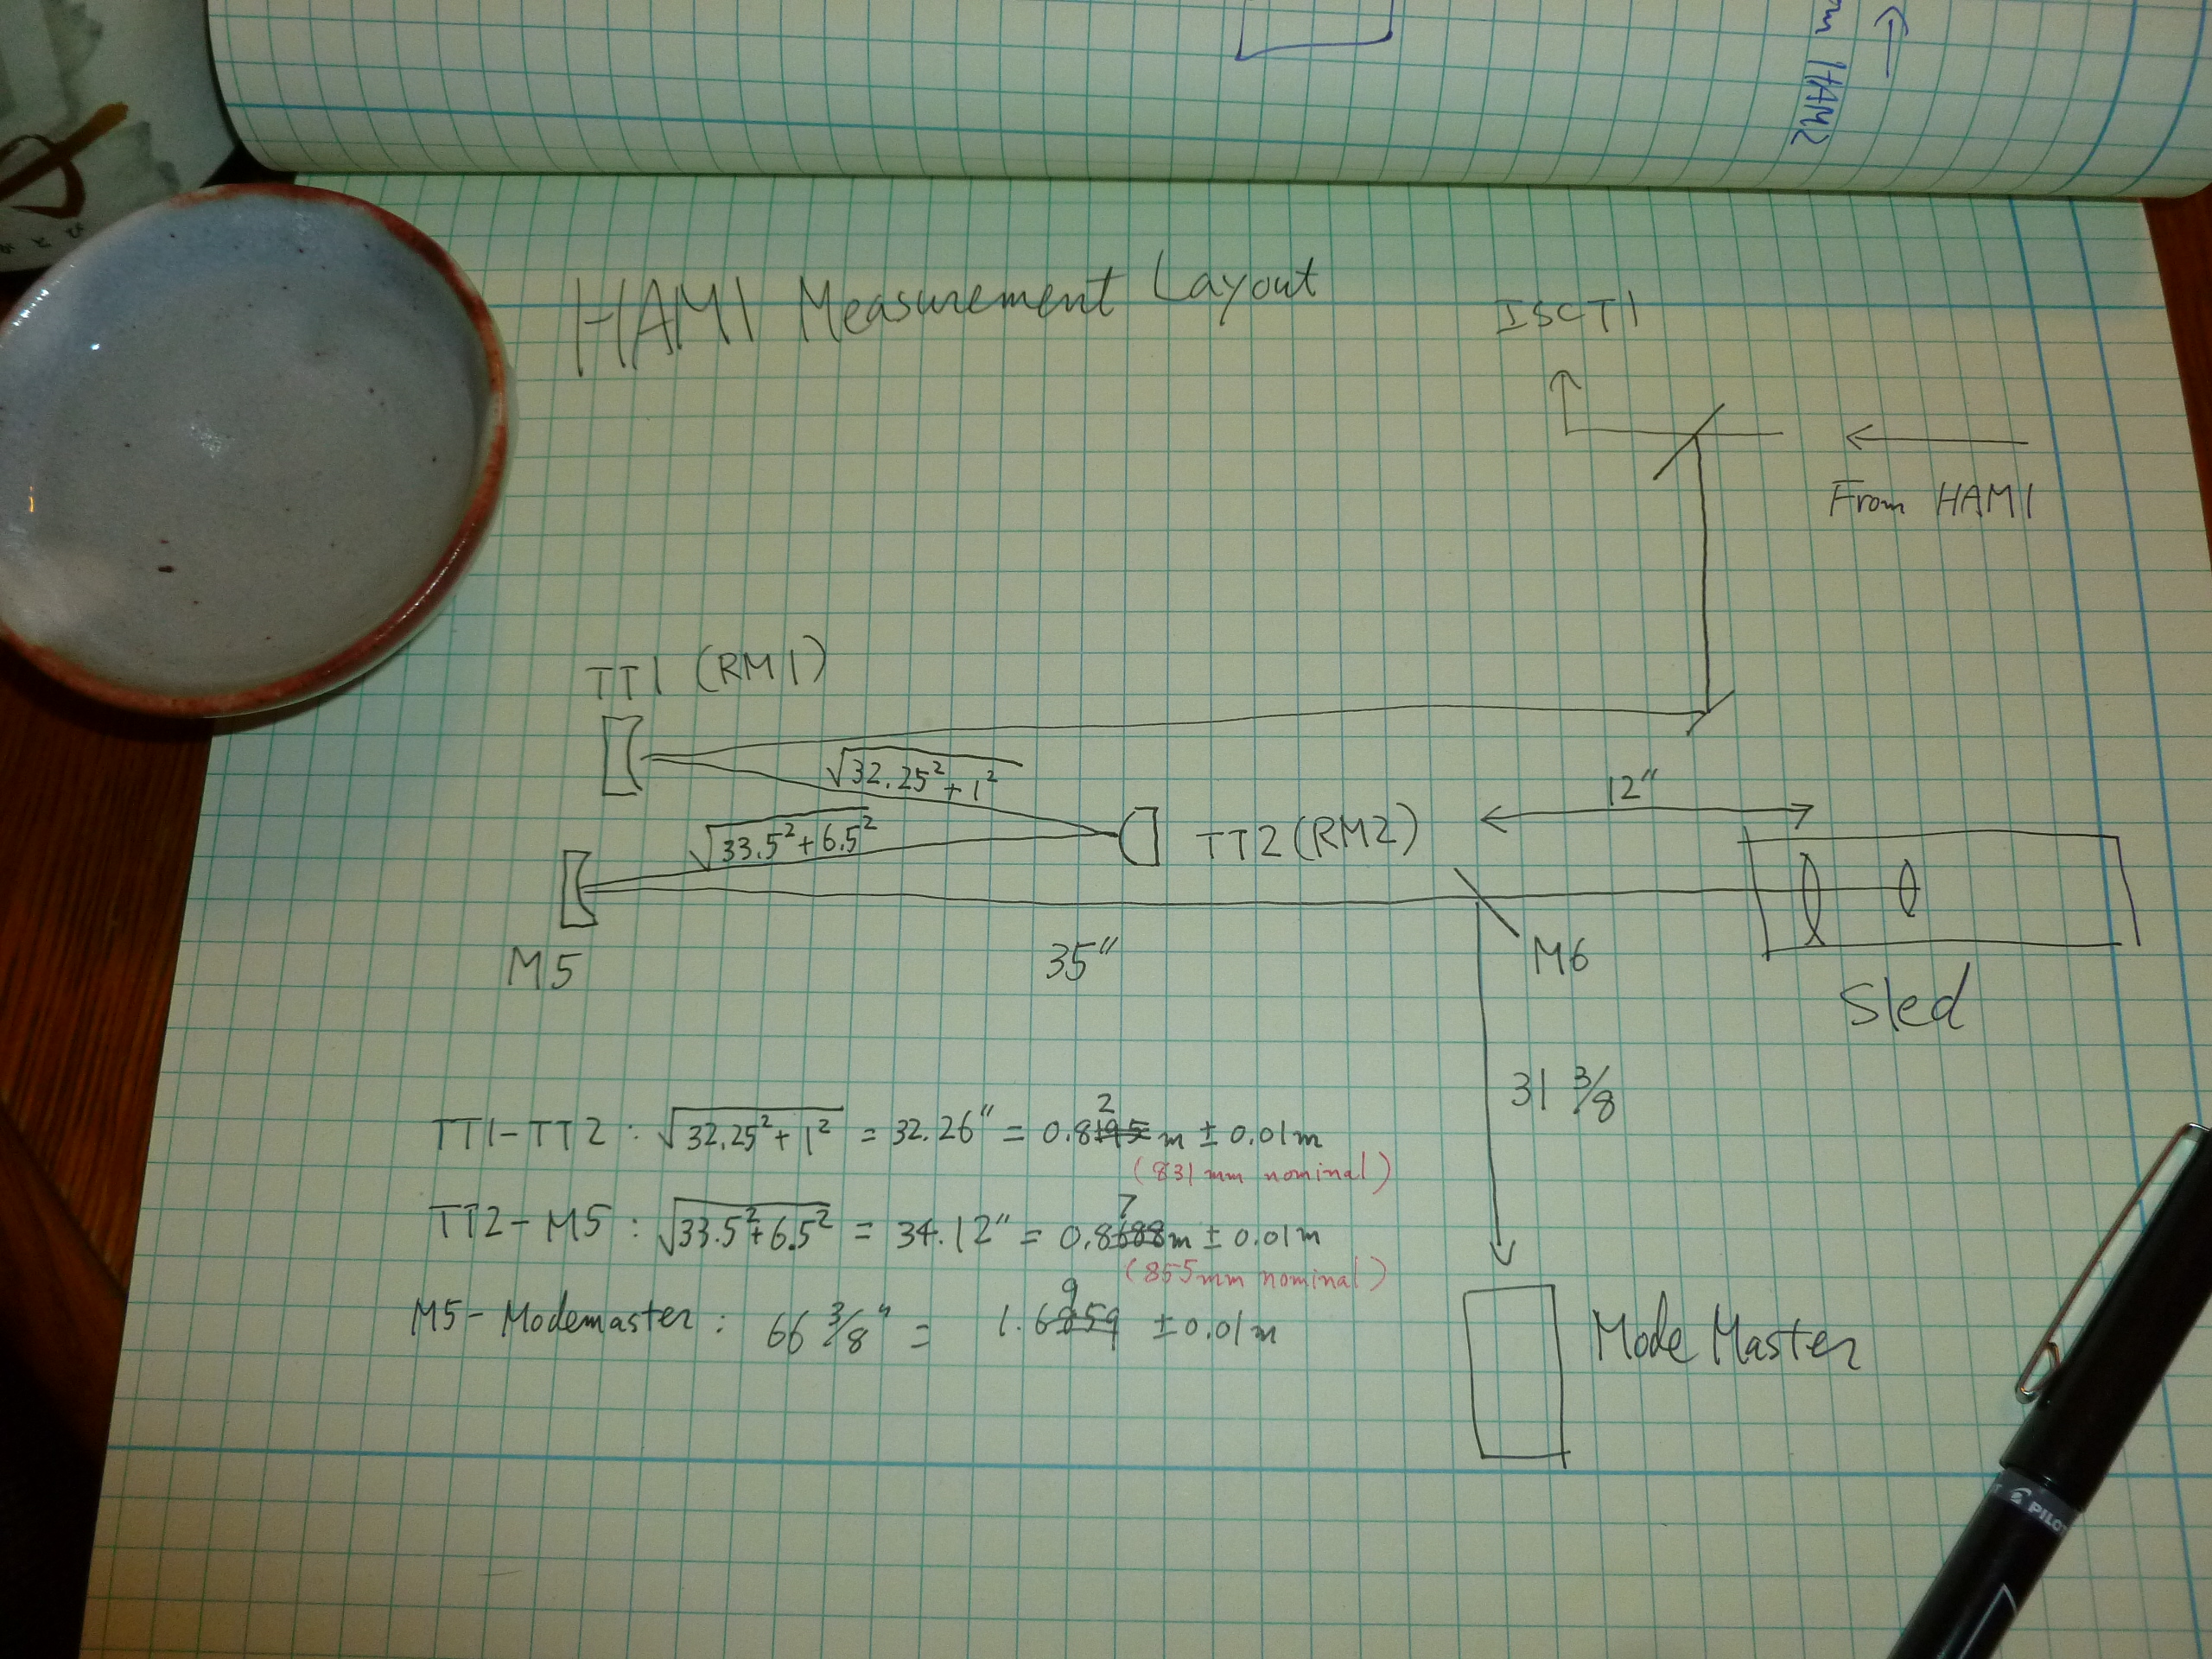
J. Kissel, S. Ballmer, D. Macleod, R. Fisher
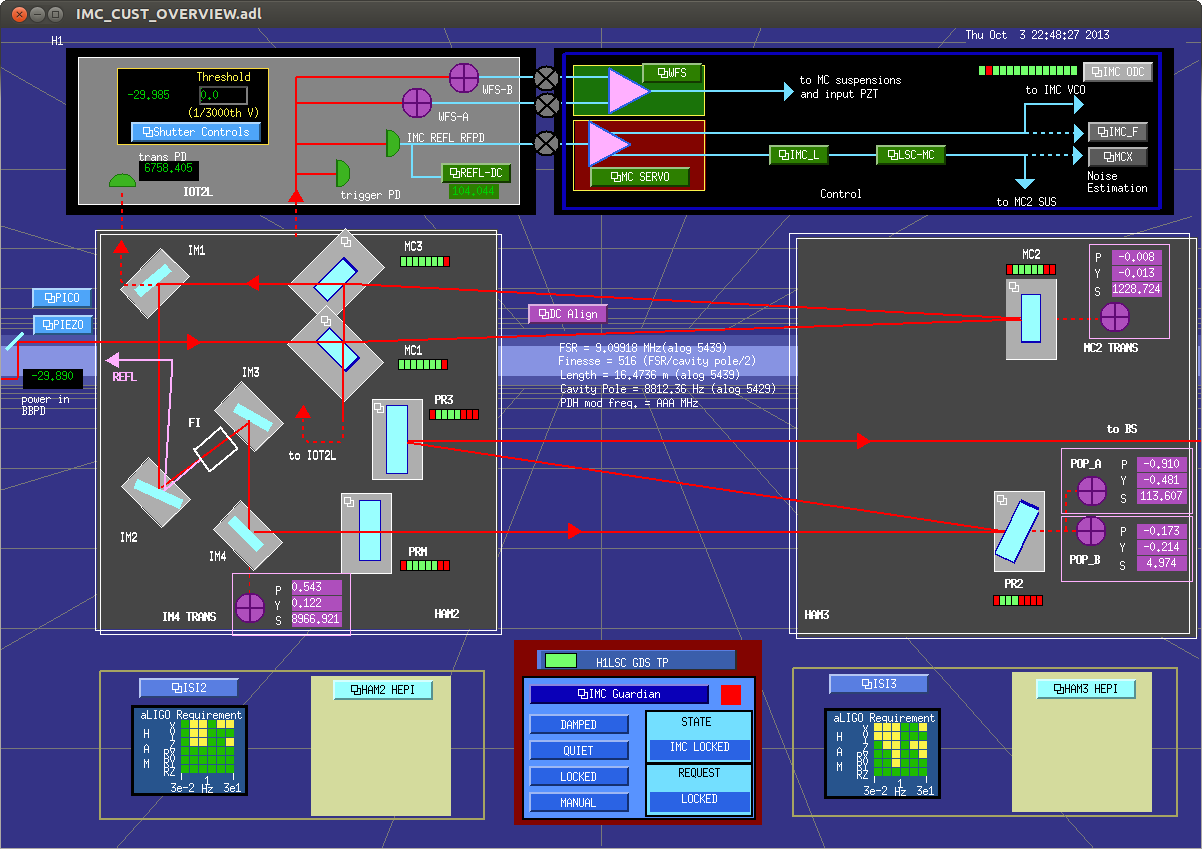
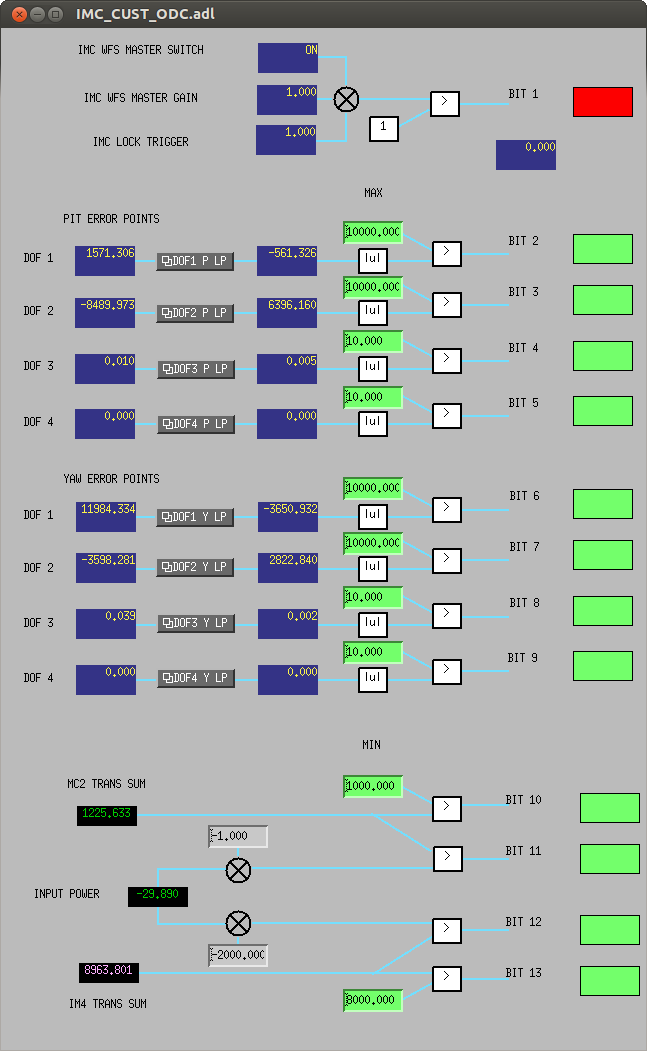
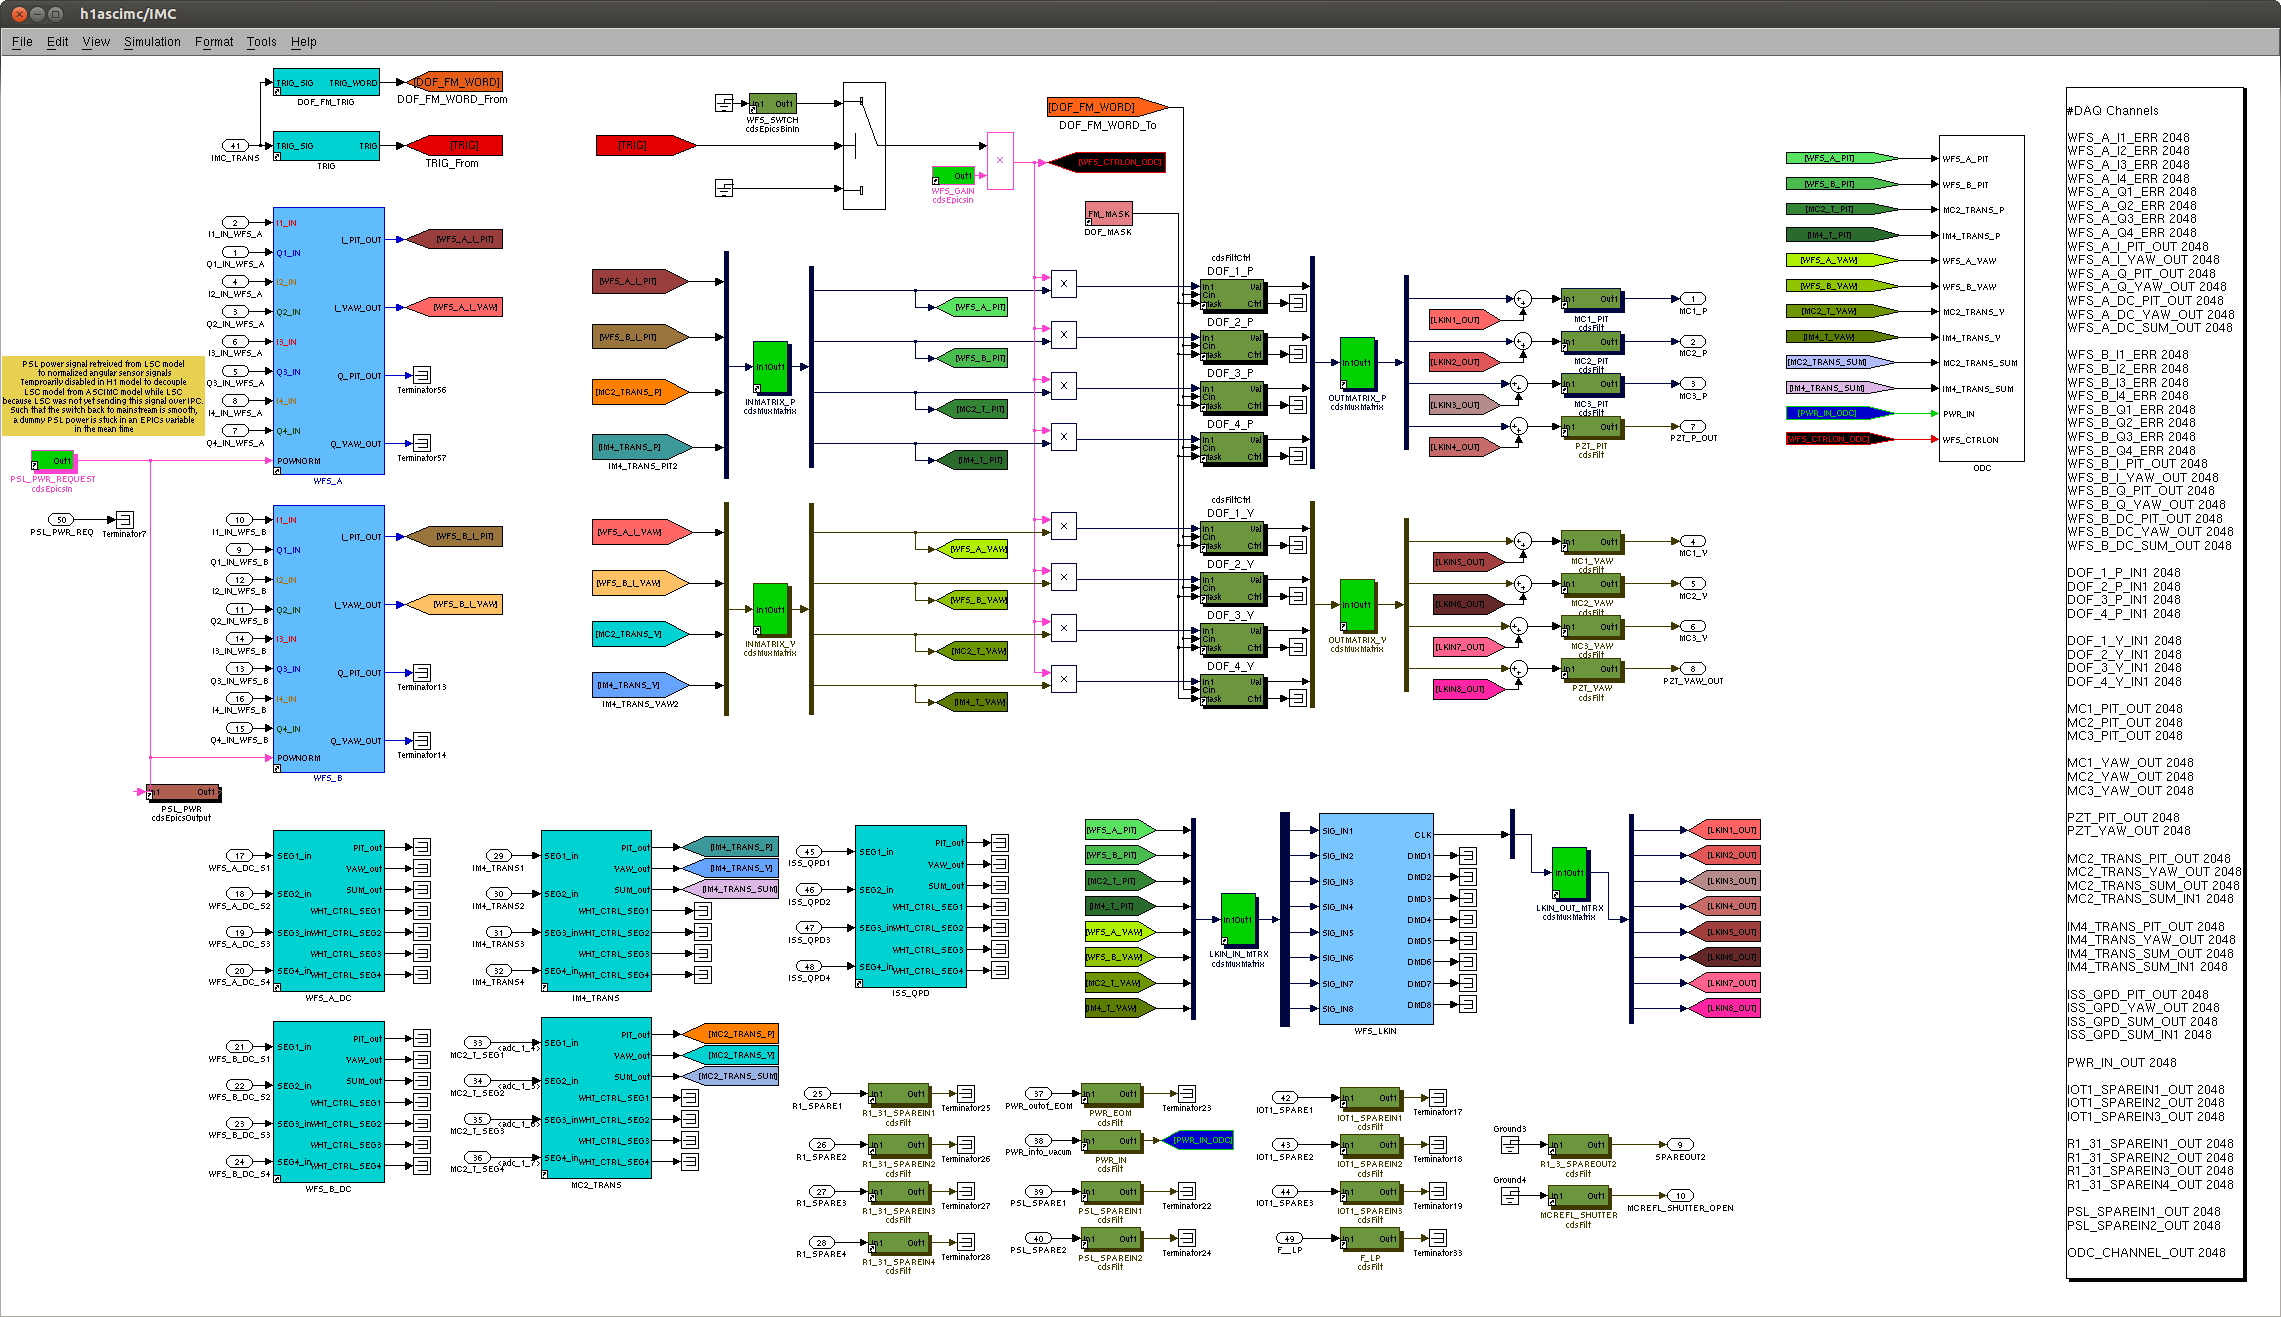
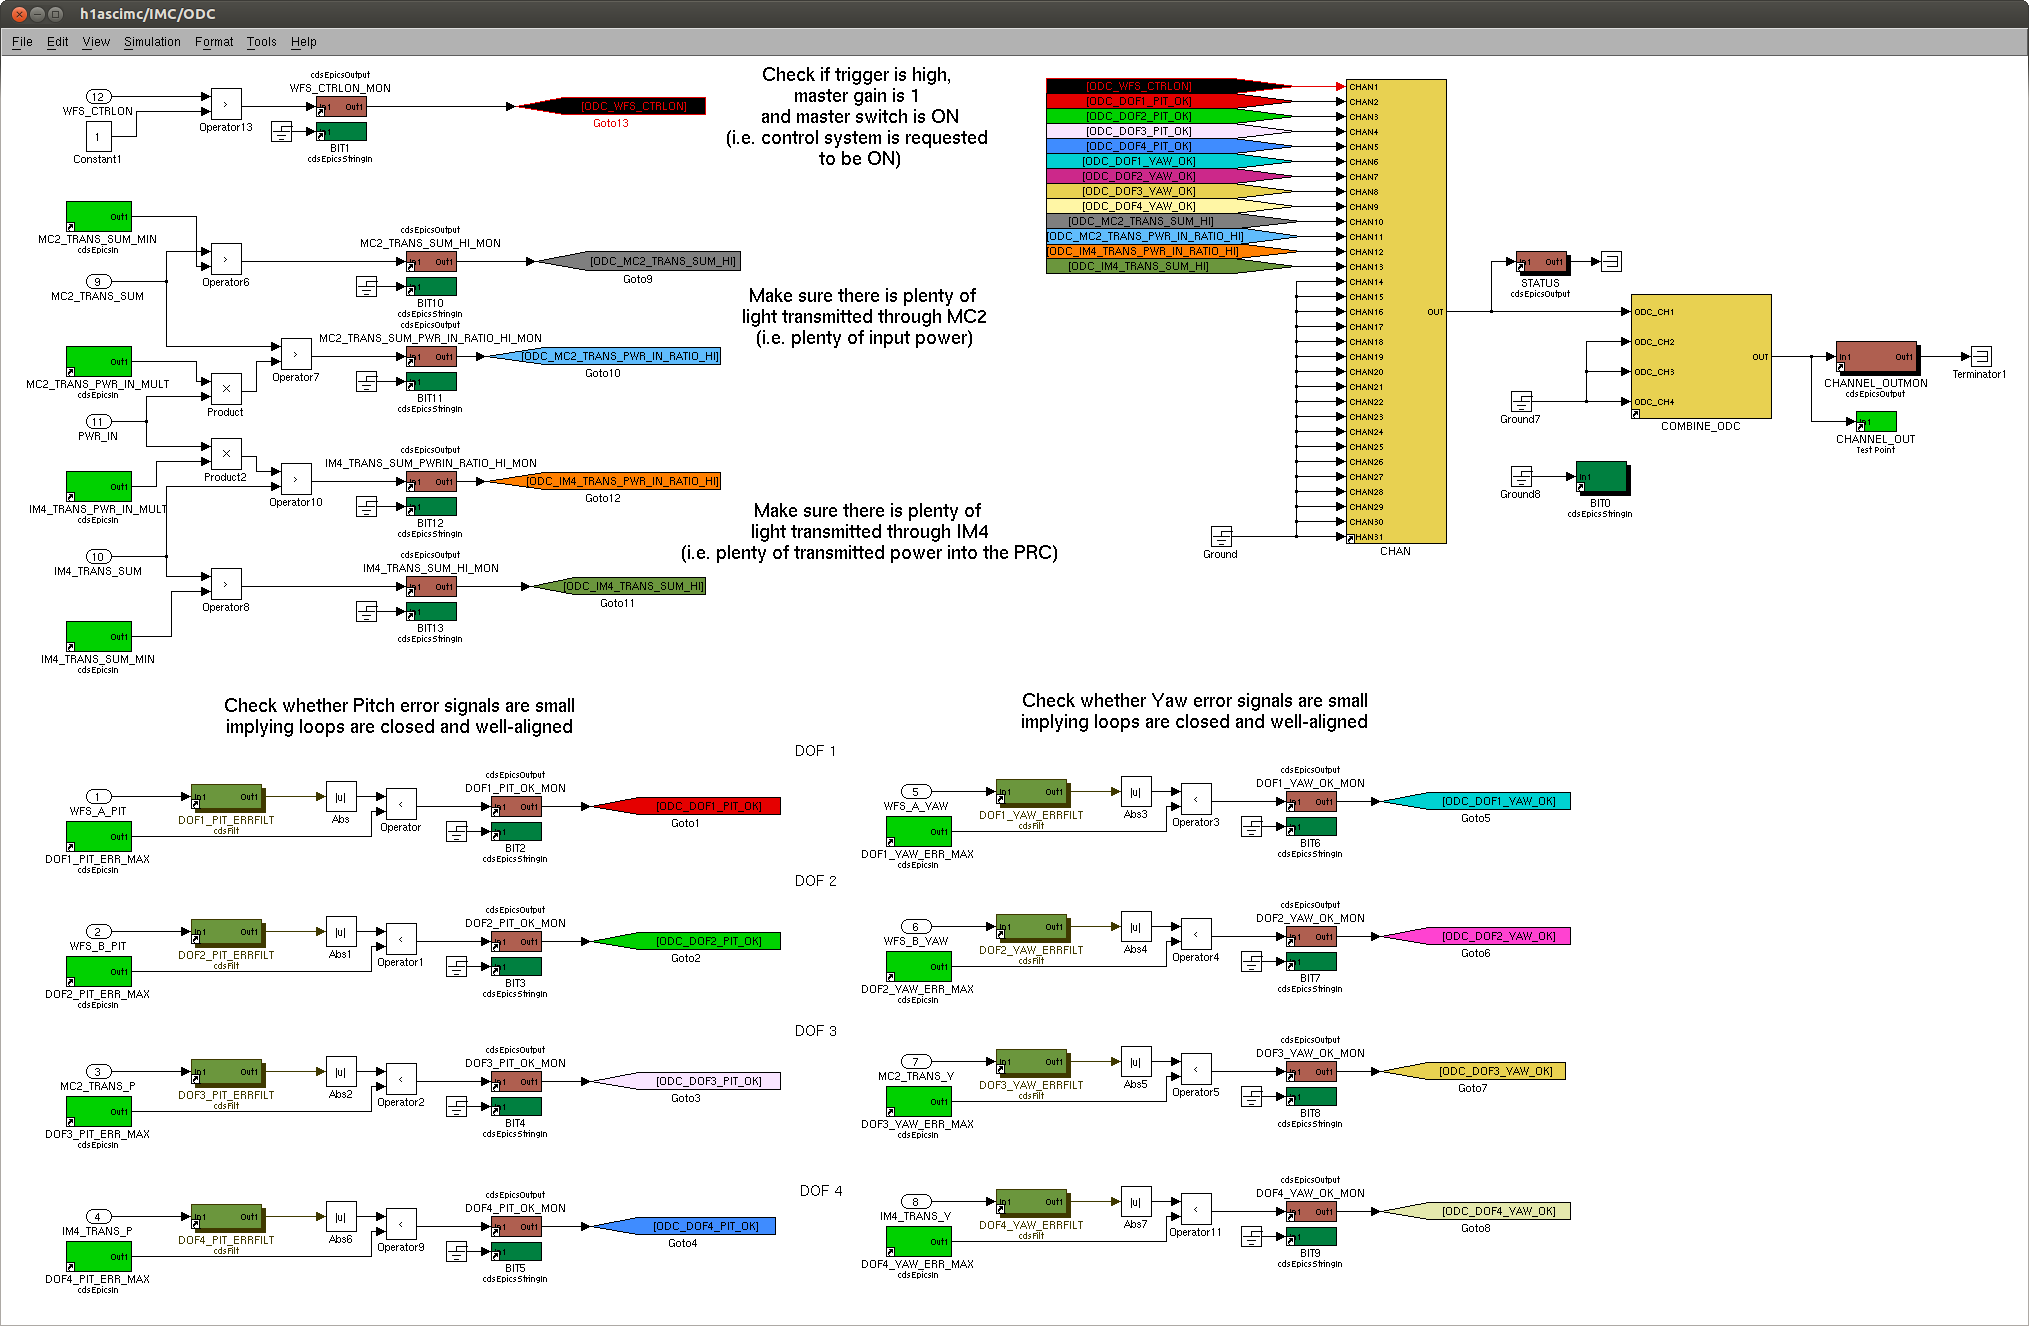
In order to further my quest to have data analysts use the IMC as their new fake gravitational wave channel, such that the *real* DetChar can begin, (and OK, because the ODC is now a blessed and essential portion of the aLIGO scope) I've installed the an Online Detector Characterization channel into the H1 ASC IMC model. This new channel is H1:IMC-ODC_CHANNEL_OUT_DQ, sampled at 2048 [Hz]. Details of the bit descriptions are outlined below. I have tested its functionality by creating a disgustingly basic MEDM screen linked off the top left corner of the IMC Overview screen (see attached) and testing that the bits all have the expected behavior -- all but one behave as expected*. The IMC runs as smoothly as it did before I got started.
Since there are a few new filter banks, a whole bunch of new epics records, some screen changes, and a front end model change, I've made sure to re-capture a new safe.snap, and have committed all of the following to the repo:
/opt/rtcds/userapps/release/asc/h1burtfiles/h1ascimc_safe.snap
/opt/rtcds/userapps/release/asc/h1models/h1ascimc.mdl
/opt/rtcds/userapps/release/asc/h1filterfiles/H1ASCIMC.txt
/opt/rtcds/userapps/release/ioo/h1/medm/IMC_CUST_OVERVIEW.adl
/opt/rtcds/userapps/release/ioo/common/medm/IMC_CUST_ODC.adl
where "safe" is a fully operational system, just with the WFS master switch off. Note that I've made several modifications to the prototype version provided to me by Ryan and Duncan, but the modifications were based on conversations with Stefan, and to otherwise increase clarity of the system.
Note that the addition of new filter banks meant I had to restart the DAQ / Data concentrator (twice, because I'd misspelled one of the new filter banks).
Also, it really seems like these WFS loops are oscillating way too much. We should look into why, or Paul's going to be very sad tomorrow when he measures the beam jitter of the IMC.
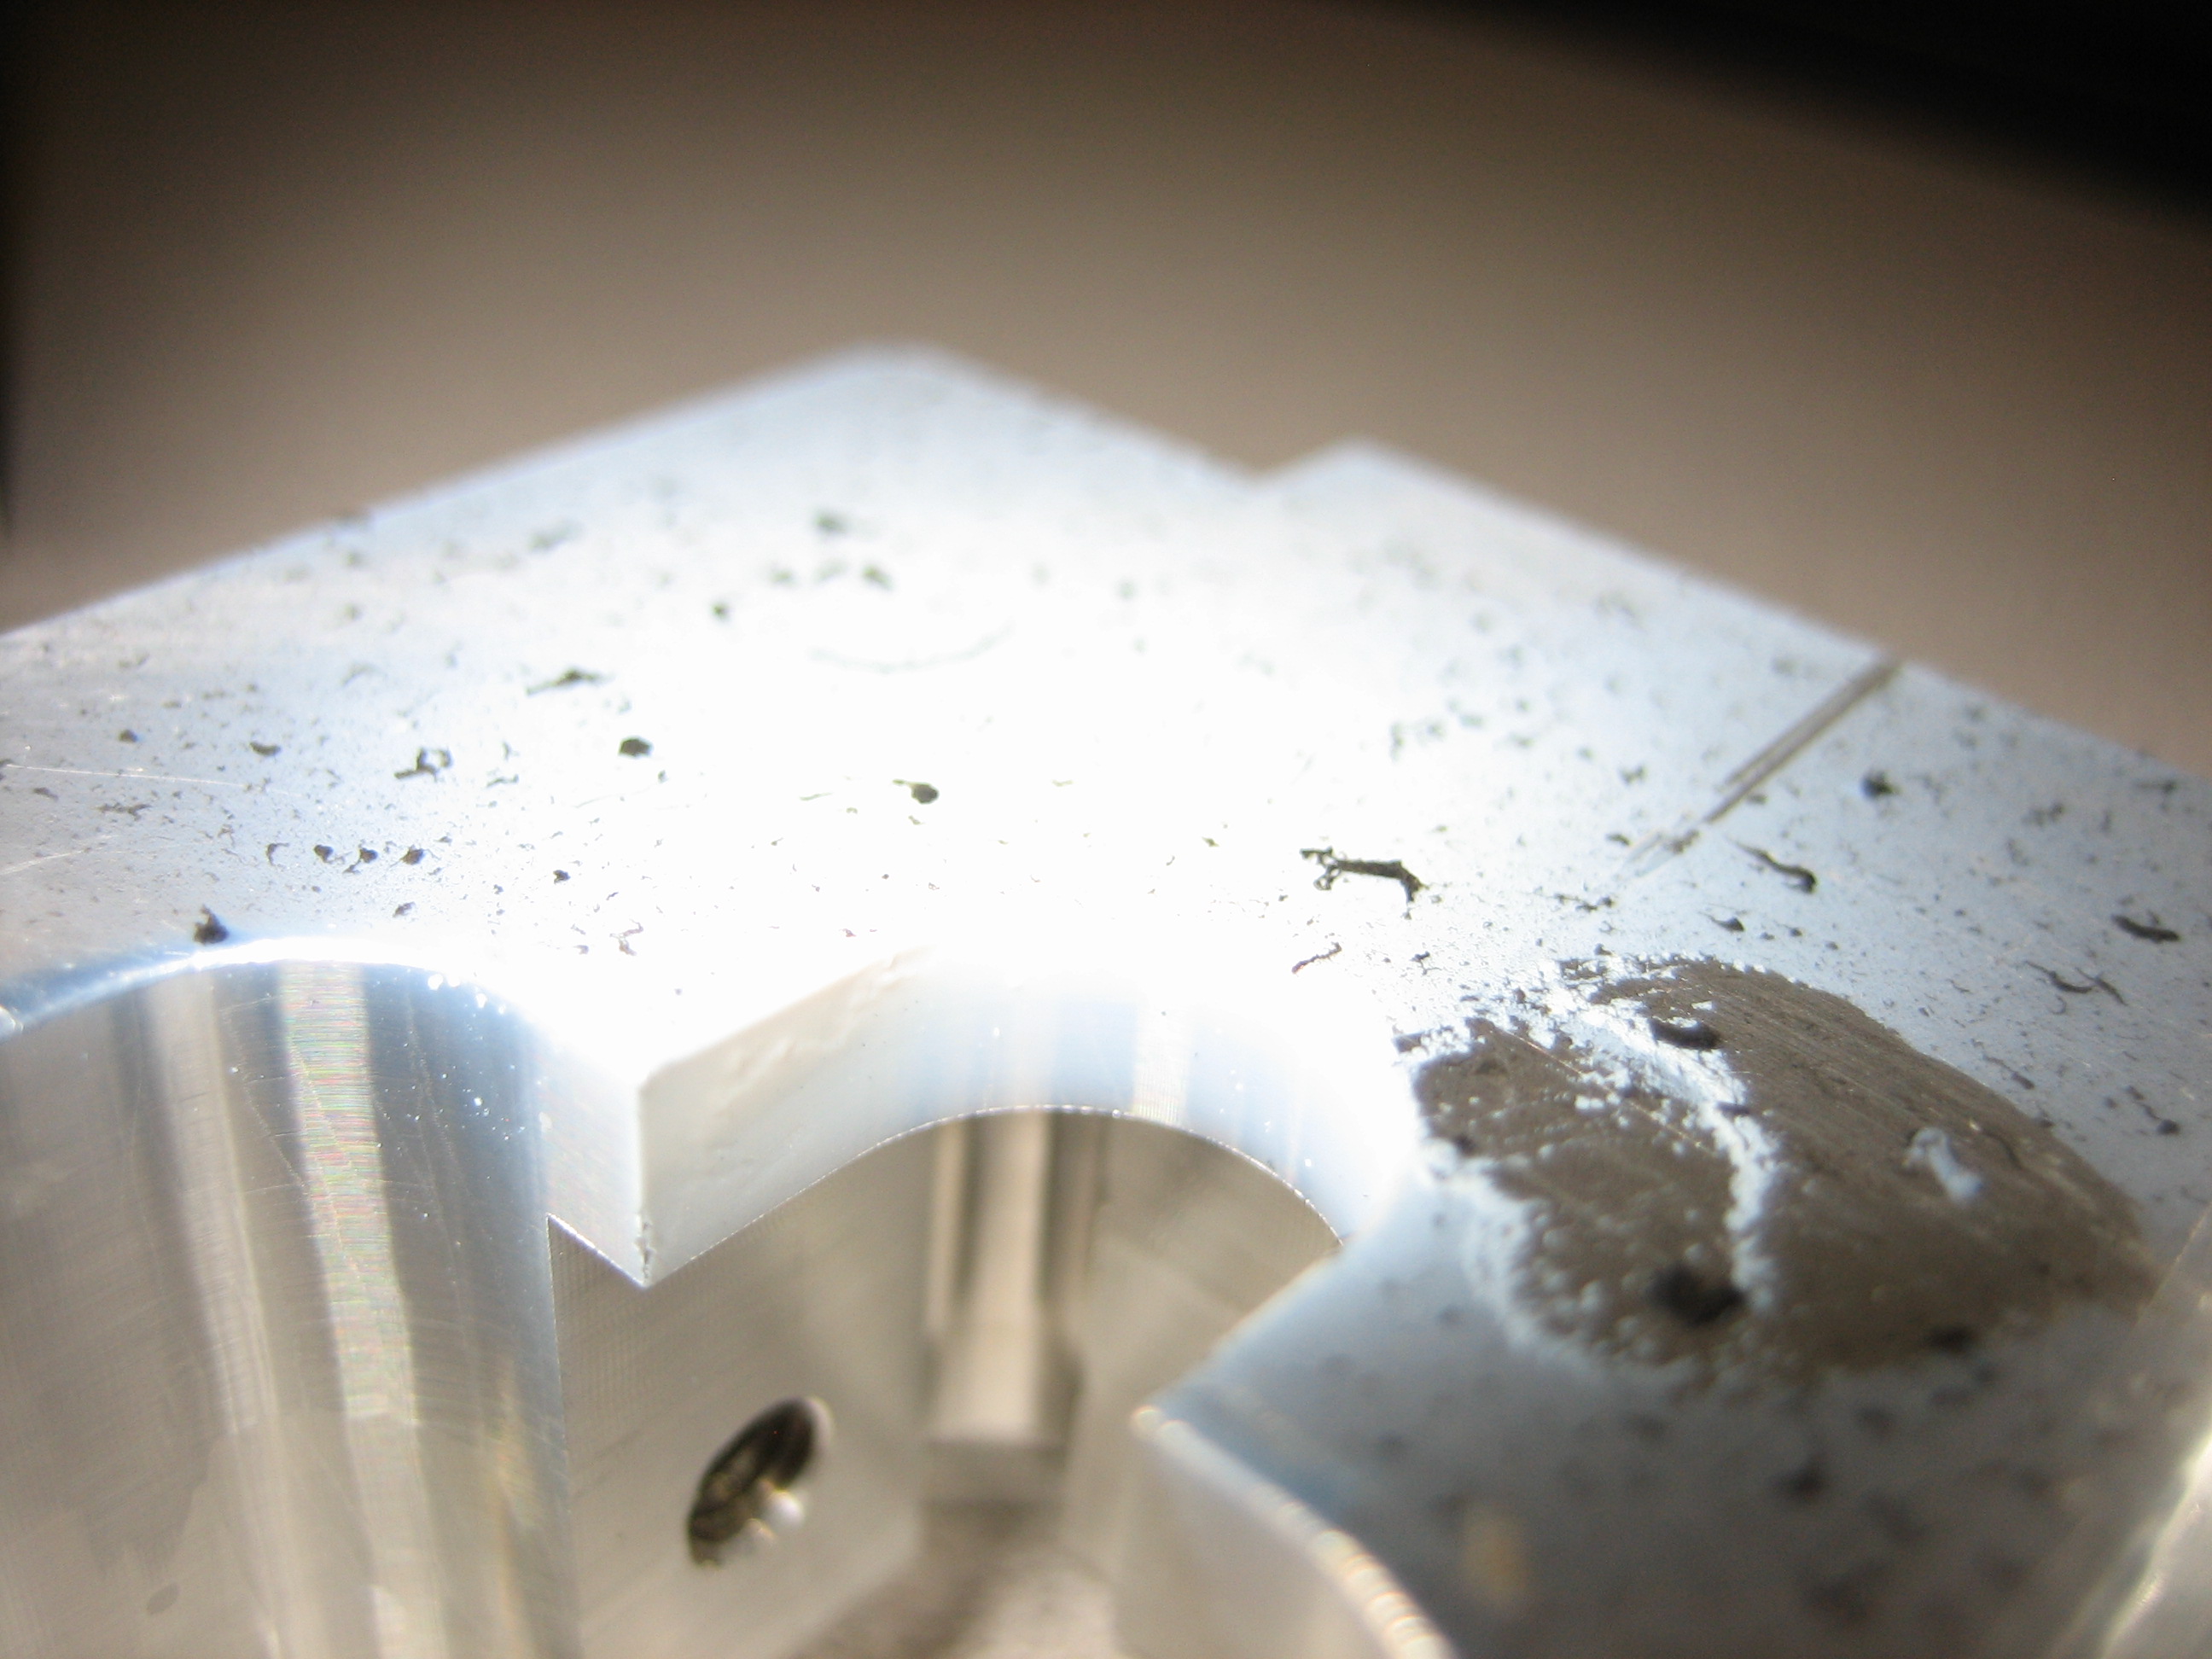
Finally, though Cheryl said she'd just aligned the Broad Band PD gathering the leakage beam at the bottom of the PSL periscope to determine the power going into vacuum, its channel (H1:IMC-PWR_IN_OUTPUT) is showing a dead -29.89 [ct].
----------------
Bit description:
----------------
There are 13 bits associated with this channel:
BIT1 : Indicator of whether the IMC ASC control system is requested to be on. This compares
- the final product of the trigger from IMC transmission PD (just after IM1, indicating the length control is on and the cavity is locked [H1:IMC-TRIG_MON]),
- the WFS masterswitch (H1:IMC-WFS_SWTCH), and
- the WFS master gain (H1:IMC-WFS_GAIN)
against unity. If all are three components are one, then their product will be one, the WFS are requested to be turned on, and the bit goes high.
* I can't get this bit to turn green. I think it's because the master switch is and EPICs Binary as opposed to a standard EPICs Input. The product of these three things seems to be zero, yet the WFS are on and servo-ing just fine. We'll have to debug this tomorrow.
BIT2, BIT3, BIT4, BIT5 : Indicative of the control pitch system operating as expected, with small error signals, and therefore the IMC is well-aligned. (The equivalent of) H1:IMC-DOF_[1,2,3,4]_P_IN1 -- the error points of the WFS loops -- are low-passed in the banks H1:IMC-ODC_DOF[1,2,3,4]_PIT_ERRFILT. If the absolute value of those low-passed error points are less than a pre-defined threshold (H1:IMC-ODC_DOF[1,2,3,4]_PIT_MAX), then BITS 2, 3, 4, and 5 go high.
As the IMC ran while commissioning the ODC channel, I found that threshold values of 10000, 10000, 10, and 10 [ct] for DOFs 1, 2, 3, and 4 PIT make these bits go green most of the time. However, we should use the H1:IMC-ODC_DOF[1,2,3,4]_PIT_ERRFILT banks to calibrate the WFS Error points into physical units, and use thresholds that make sense.
Just for testing purposes, I've tossed in a 0.3 [Hz], 4th order Butterworth as the low pass. I'm sure more thought could be put into this. These filters are in FM1 of the ERRFILT banks, and called "0.3HzLP."
BIT6, BIT7, BIT8, BIT9 : Indicative of the control yaw system operating as expected, with small error signals, and therefore the IMC is well-aligned. (The equivalent of) H1:IMC-DOF_[1,2,3,4]_Y_IN1 -- the error points of the WFS loops -- are low-passed in the banks H1:IMC-ODC_DOF[1,2,3,4]_YAW_ERRFILT. If the absolute value of those low-passed error points are less than a pre-defined threshold (H1:IMC-ODC_DOF[1,2,3,4]_YAW_MAX), then BITS 2, 3, 4, and 5 go high.
As the IMC ran while commissioning the ODC channel, I found that threshold values of 10000, 10000, 10, and 10 [ct] for DOFs 1, 2, 3, and 4 YAW make these bits go green most of the time. However, we should use the H1:IMC-ODC_DOF[1,2,3,4]_YAW_ERRFILT banks to calibrate the WFS Error points into physical units, and use thresholds that make sense.
Just for testing purposes, I've tossed in a 0.3 [Hz], 4th order Butterworth as the low pass. I'm sure more thought could be put into this. These filters are in FM1 of the ERRFILT banks, and called "0.3HzLP."
BIT10 & BIT11 : Indicative of whether there is the expected amount of power input into the IMC, as measured by the MC2 TRANS QPD behind MC2 on HAM3 . The QPD's SUM (H1:IMC-MC2_TRANS_SUM_OUT_DQ) is compared against a threshold (H1:IMC-ODC_MC2_TRANS_SUM_MIN). If higher than the threshold, BIT 2 goes high. If the the SUM is greater than the input power (as measured by a Broadband PD measuring the leakage beam just behind the PSL's Periscope, H1:IMC-PWR_IN_OUT) times some multiplier (H1:IMC-ODC_MC2_TRANS_PWR_IN_MULT, the expected loss between the output of the PSL and the MC2 TRANS QPD) then BIT3 goes high.
BIT12 & BIT13 : Indicative of whether there is the expected amount of power coming out of the IMC, as measured by the IM4 TRANS QPD behind IM4 on HAM2. The QPD's SUM (H1:IMC-IM4_TRANS_SUM_OUT_DQ) is compared against a threshold (H1:IMC-ODC_IM4_TRANS_SUM_MIN). If higher than the threshold, BIT 4 goes high. If the the SUM is greater than the input power (as measured by a Broadband PD measuring the leakage beam just behind the PSL's Periscope, H1:IMC-PWR_IN_OUT) times some multiplier (H1:IMC-ODC_IM4_TRANS_PWR_IN_MLT, the expected loss between the output of the PSL and the IM4 TRANS QPD) then BIT5 goes high.


Temperatures remain the same at 12:00