Sheila Ryan and I phased LSC-REFL_B while we were sitting at 25W after move spots. We used the template in /opt/rtcds/userapps/release/lsc/h1/templates/CARM/check_refl_a_9_phase.xml and adjusted the phase which you can find in the LSC electronics overview. Screenshots of the 200Hz excitation after phasing and the sdf screenshot attached.
Daniel, Kevin, (Erik, Dave), Vicky
Kevin is interested in taking ADF sweeps around the second higher order mode arm resonance near 10.4 kHz.
We (Daniel) made model changes in h1ioplsc0 and h1omcpi that should enable higher freq ADF demods. Daniel built the models successfully. Then Dave also built these models successfully for the custom RCG running on h1omcpi for the variable duotone. We put in a WP to boot in these changes to h1ioplsc0 and h1omcpi next Tuesday 6/10.
From h1ioplsc0, we added 2 new PCIe channels to write the digital ADF LO oscillator out to PCIe. These are H1:IOP-PCI_ADF_VCXO_{COS,SIN} in screenshot 1. We also changed a rogue limiter such that the ADF should be able to scan +/-1 MHz according to the PLL.
In h1omcpi, we use the fast 64 kHz OMC PI user model to do a fast digital demodulation of the OMC_DCPD_SUM signal using the above ADF-LO PCIe channels. This is beating the fast dcpd output signal (H1:OMC-PI_DCPD_64KHZ_AHF), against the ADF LO's cosine and sine components from PCIe (H1:IOP-PCI_ADF_VCXO_{COS,SIN}), to get the demodulated ADF I/Q signals. The demod signals will have names like H1:OMC-PI_ADF_DEMOD_{I,Q}. Screenshots 2-4.
Operationally nothing should change for the ADF or for OMC-based fast PI damping. We are just using PCI to send 2 IPC channels from an IOP model to a user model on a different computer at ~65kHz, and doing the demod in a 64kHz user model (but the demod does not go anywhere, it is just used for squeezer diagnostics).
Model change summary:
h1ioplsc0
+2 IPC senders to H1.ipc
+2 slow channels to DAQ
h1omcpi
(+2 IPC receivers)
+33 slow channels to DAQ
Model changes today seem relatively successful. No way to verify in hardware (yet), but the ADF PLL claims it successfully locks at -11kHz from carrier, so at least the limiter fix in h1ioplsc0 seems to work; in principle the ADF sweep limiter is now set at +/- 1 MHz.
I added a quick ADF demod of the 64kHz OMC DCPD SUM channel into the normal ADF screen, screenshot attached, see the very bottom. New filter banks initialized with values and filters as in the other adf demod chains. Also tried to clean it up in SDF: channels are initialized, gains and phase are monitored, and saved into sdf (h1omcpi model).
Sheila, Elenna, Caroline, Julia
We tested and reconfigured the DRMI ASC, and now we can run all of the DRMI ASC!
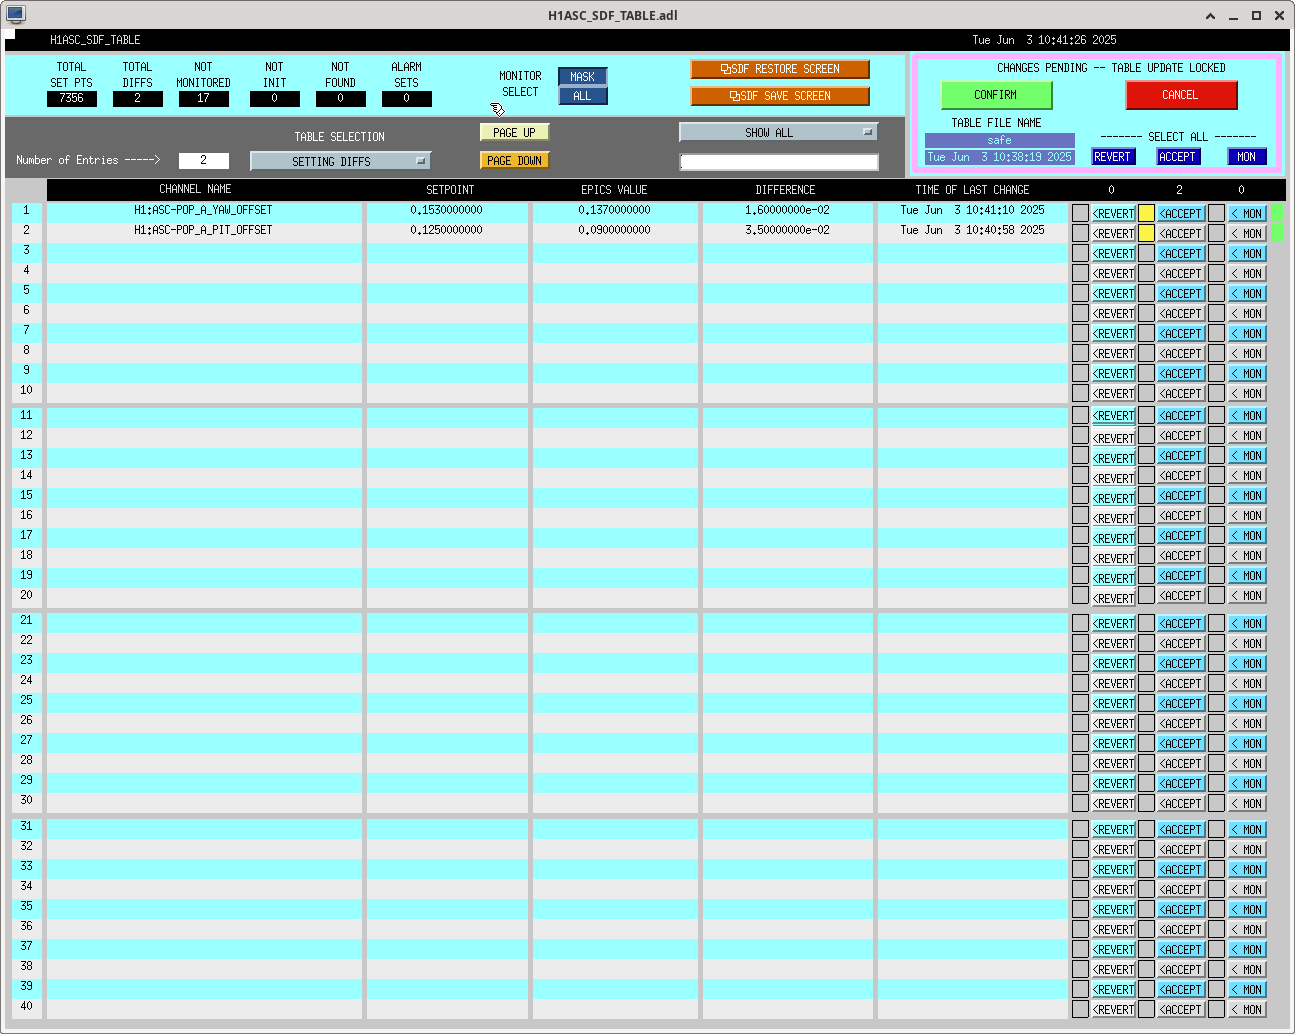
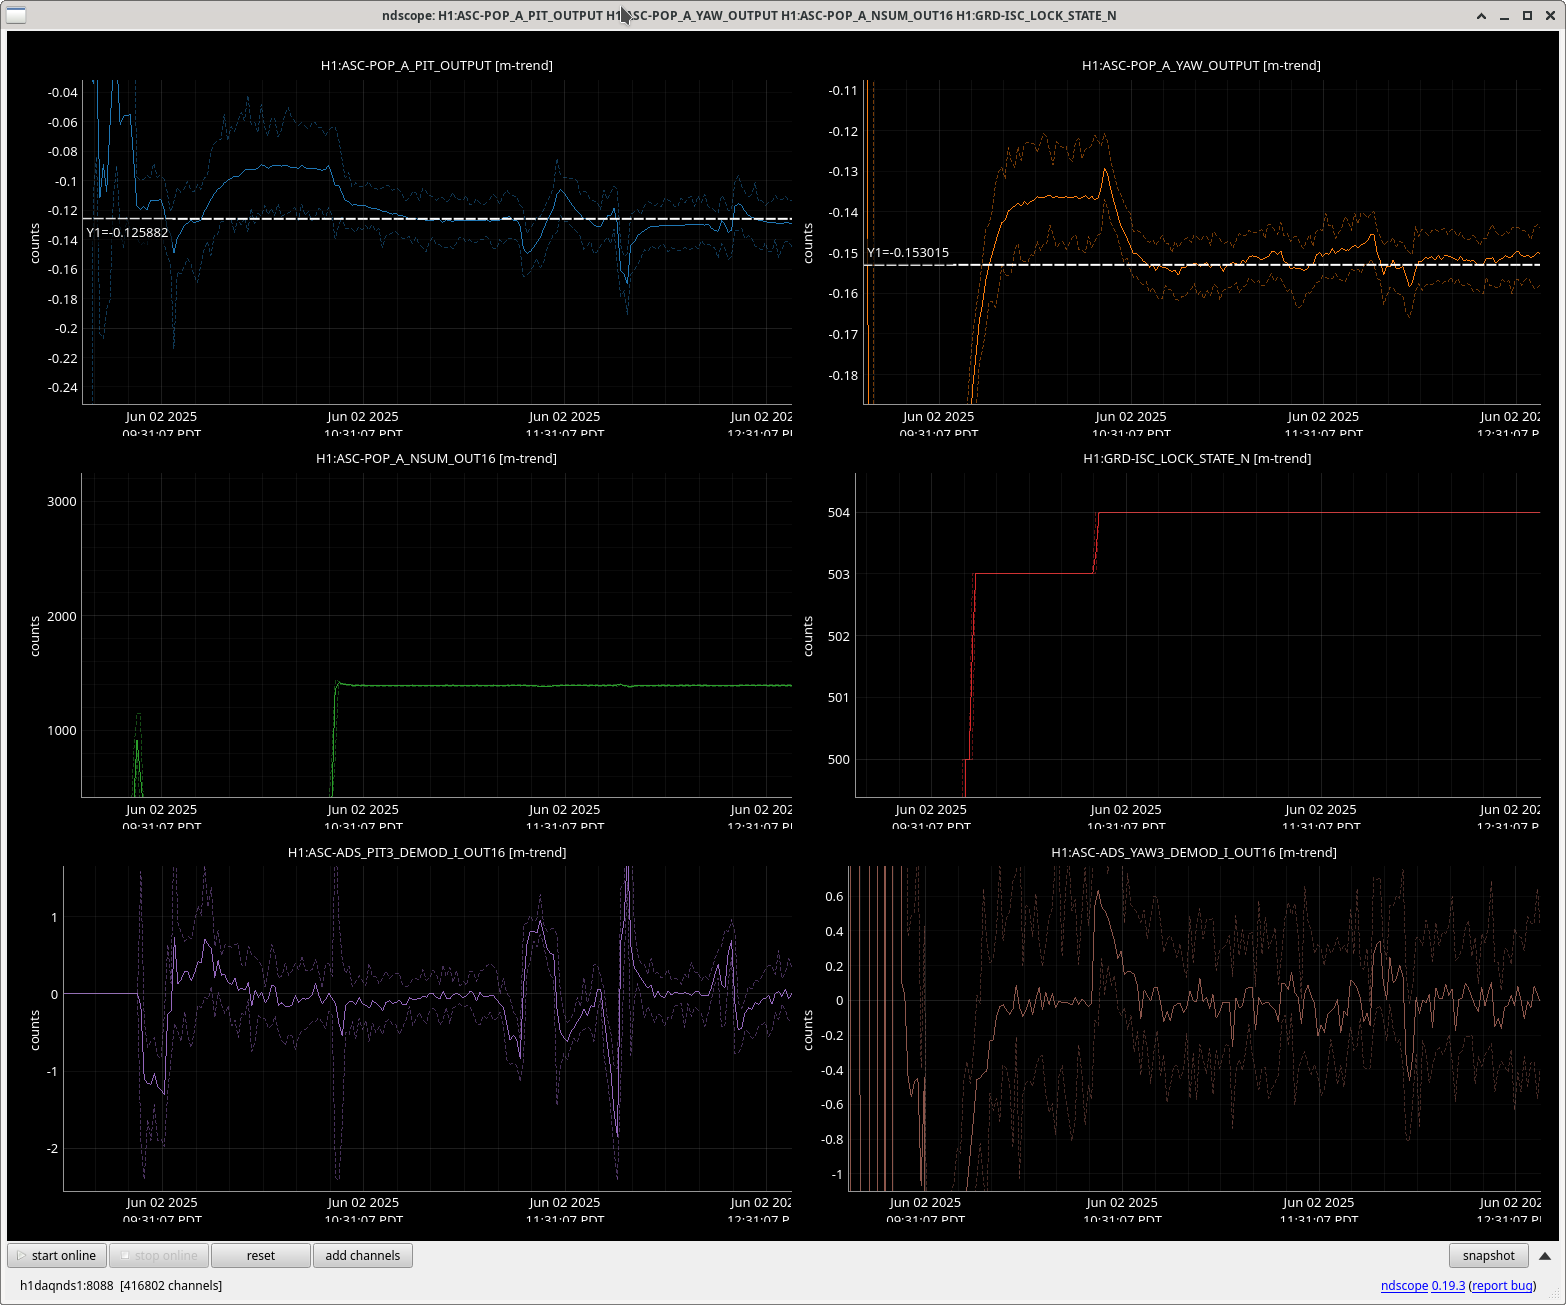
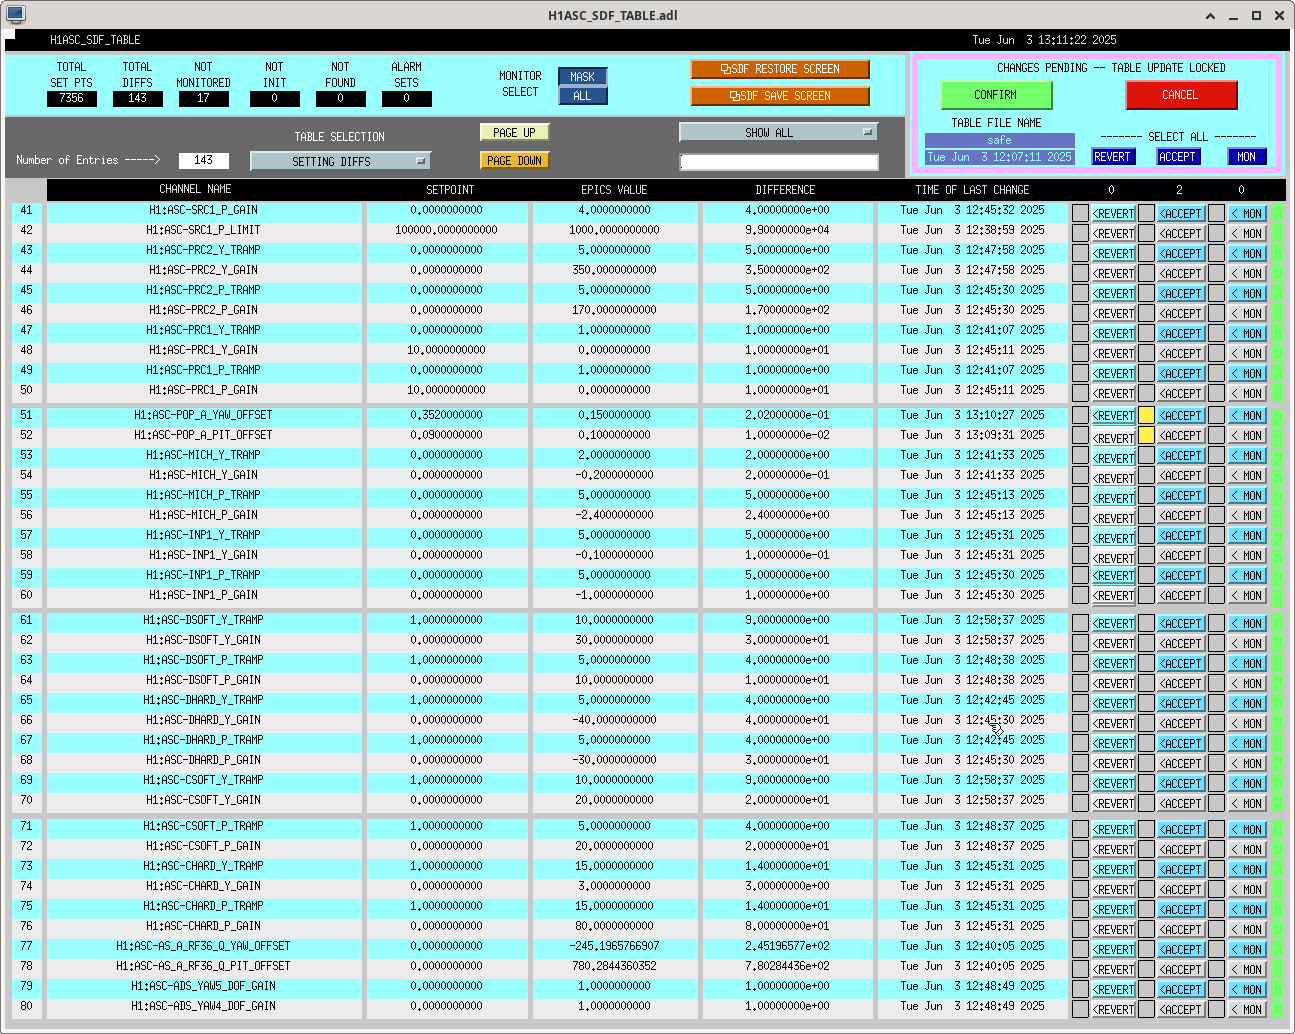
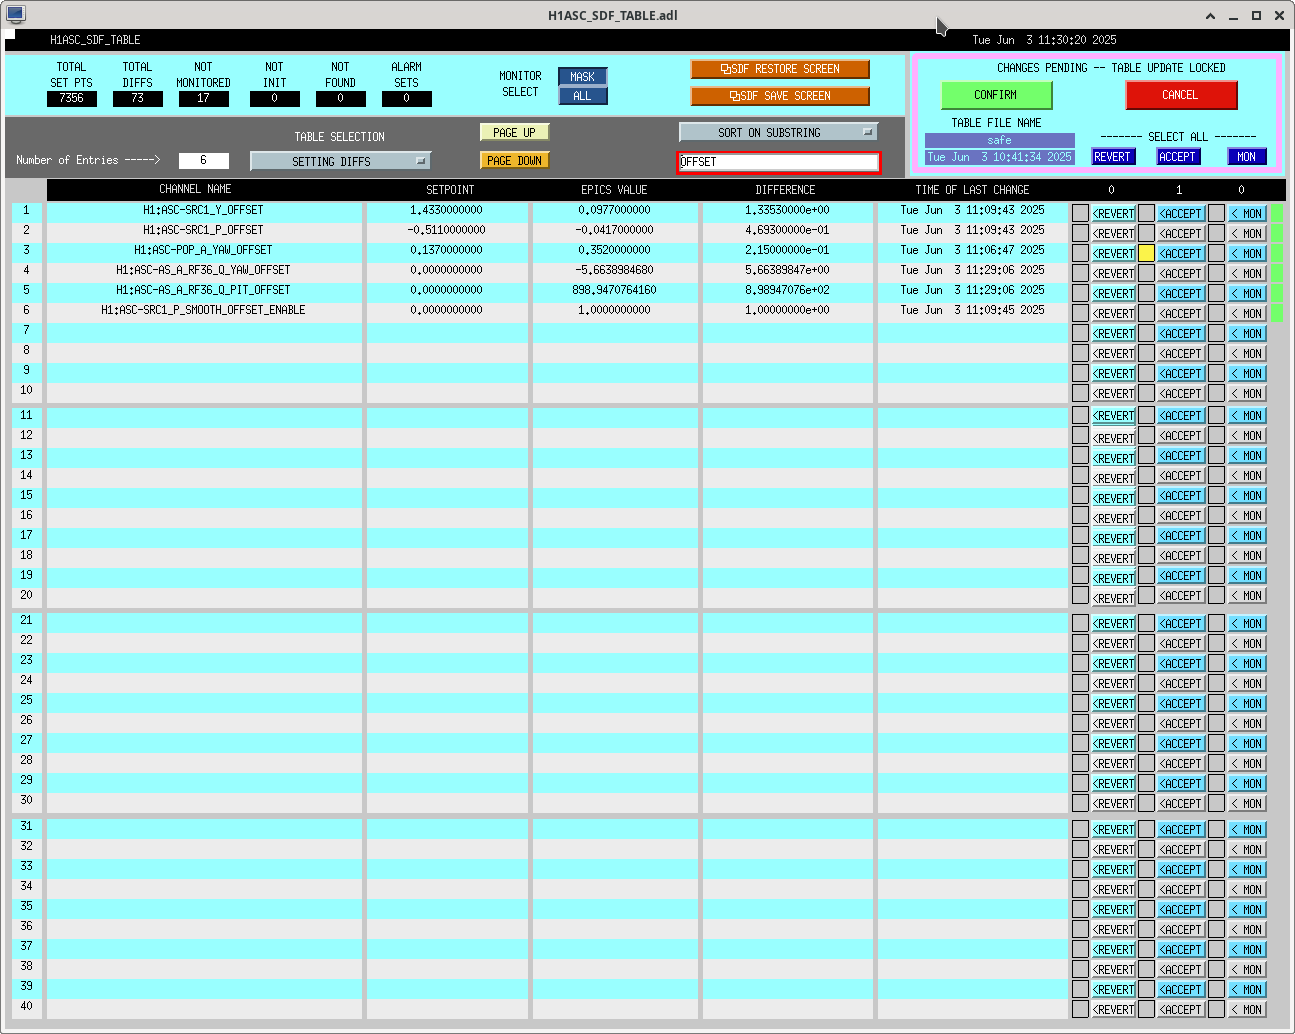
I trended the POP A offset yesterday to determine what the new values should be based on the alignment of the PRM once we are in full lock. I set those so we can use the PRC1 ASC loop (attachment 1 and attachment 2).
Then, we sat with DRMI locked and Sheila and I tried moving around PR2, IM4 and PRM to check if the error signals made sense. PRM uses POP A QPD, IM4 and PR2 use REFL A and B 9 MHz signals. We found that the PR2 and IM4 error signals seemed flipped, so we checked all of the REFL WFS signals and even thge POPX signals to see what might be the best new sensing matrix. Eventually, we chose to remain on REFL 9 I, but we flipped the sensing.
We were able to engage all the SRC ASC, except that after a minute or two og engagement, we saw an oscillation in the SRC signals. We eventually turned down the SRC1 P and Y gains, and the SRC2 P gain.
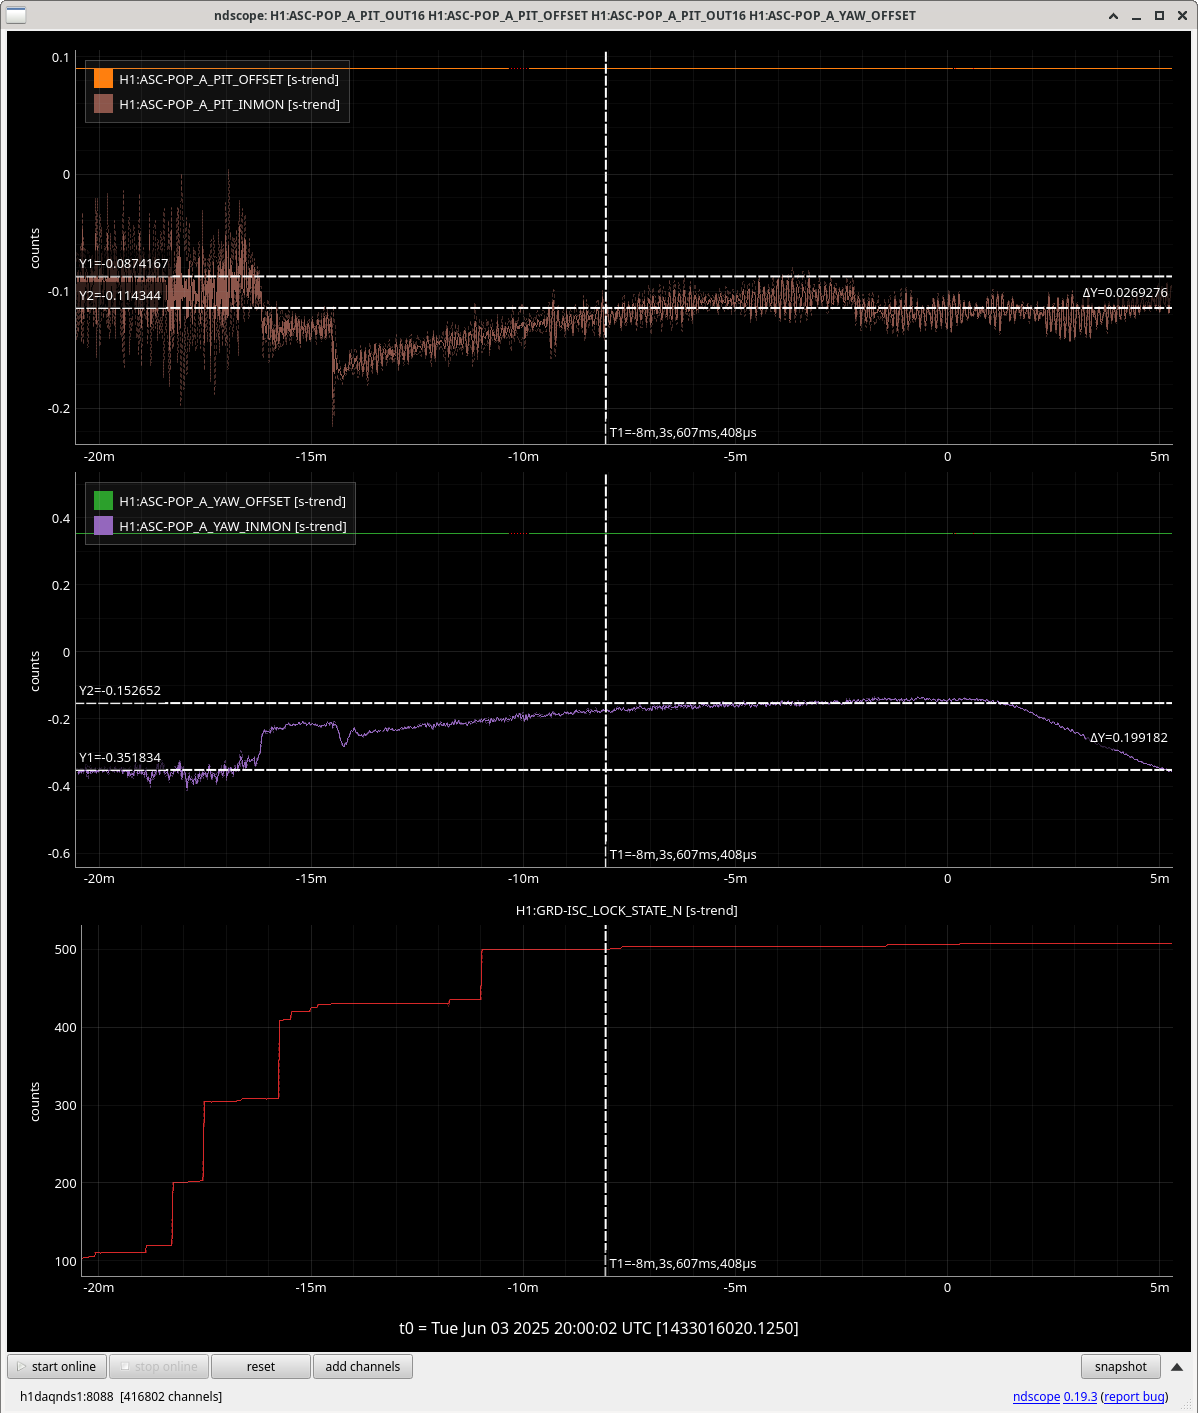
I tried moving the PRM to confirm the PRC1 error signal was ok, and I found that the pitch offset I chose was good, but the yaw offset was not good. So instead I moved the PRM yaw to maximize the buildups, and then reset the the POP A yaw offset (attachment 3).
Then, Sheila and I tried engaging the PRC2 and INP1 yaw ASC, but used the wrong sign for PRC2 Y and caused the DRMI lockloss. Luckily, we quickly recovered, and changed the sign and reengaged. We followed a similar procedure for the pitch ASC, but I stepped PR2 a few times to ensure the sign of the input matrix was correct.
We were then able to engage all the DRMI ASC, using lower SRC1 and SRC2 gains to prevent ringing. Sheila updated the ISC DRMI guardian to use these new input matrix values.
Except for some overall magnitude, the DRMI INP1 and PRC2 sensing has had this change in both pitch and yaw:
old sensing: INP1 = + REFL 9I A - REFL 9I B and PRC2 = +REFL 9I A + REFL 9I B
new sensing: INP1 = +REFL 9I A + REFL 9I B and PRC2 = -REFL 9I A + REFL 9I B
With the ASC engaged, we were able to raise the SRC1 pitch and yaw gains back to their nominal values (updated again in guardian). The SRC2 P loop still has a lower gain.
We've gone back and forth on the correct POP A yaw offset today, and Georgia had changed it again in this alog. However, we just tried to run the DRMI ASC and had a lockloss, so we think my offset was better, so I have again set the POP A yaw offset to be 0.352 and SDFed.
DRMI ASC engaged much better with my offset. I don't know why the full IFO alignment offset is bad for DRMI.
After attention was called to the uneven trending in the temperature of Zone 2A, I checked the heating coil and found that while the automation system was calling for 100% heating, the unit was not heating at all. I found that one of the 40 amp line voltage fuses had blown. This fuse also supplies line voltage to the control transformer which powers the control board, meaning the entire duct heater was down. Further troubleshooting is needed to find the cause of the blown 40 amp fuse, which will likely involve replacing heating elements.
I updated the POP_A P and Y offsets so the DRMI ASC will take us closer to where the full IFO ASC will take us
DOF | Old | New |
P | 0.09 | 0.1 |
Y | 0.35 | 0.15 |
This was reverted - the DRMI alignment and full IFO alignment are not the same. Maybe related to the ITMX P2L gain change we put in which adjusts the pitch of the PRM in 2W full lock?
FAMIS 25805
pH of PSL chiller water was measured to be between 10.0 and 10.5 according to the color of the test strip.
Betsy, Ryan S, TJ
We did our first walk through after the vent, but next week there will definitely be more to sweep that we either missed or that we said we will hold off a week on. We focused on the most egregious items.
Jonathan, Nyath
As per WP 12580 we have replaced the GC switch which interfaces with CDS. This is in response to the need to cycle the switch twice on Friday.
Unfortunately this took more work than expected. The first switch we tried was not passing data between the CDS router and the GC core. So we are running a smaller spare CDS switch with POE + 10Gb capability to service the control room phones, the control room computers, and the DMT interface.
We have two fiber pairs going to the GC core switch. We typically run them as an aggrigated link. However for testing we have split that up and are running one pair to the active switch and have the other fiber pair to test another switch.
This work resulted in minor outages to the DMT and control room. The largest outages being to the non-operator phones.
We will keep the work permit open for a bit.
Attatched to this alog are omicron glitch rate comparions, as a function of frequency and SNR, between O4a and O4b. Here, I used roughly ~ 3425 hours of observing time for O4a and O4b (H1:DMT-ANALYSIS_READY:1 flag). The specific observing times used were:
O4a: 2023-06-24 20:00:00 - 2024-01-17 00:00:00 (~3422 hours observing)
O4b: 2024-04-10 00:00:00 - 2025-01-28 17:00:00 (~3428 hours observing)
The SNR and frequency of the omicron triggers gathered were 7.5 < SNR < 500, and 10 Hz < frequency < 1024 Hz. I find that the glitch rate in O4b is significatly less than O4a. In O4a, there was a lot of non-stationary noise from ~10-50 Hz (see alogs 71005 & 71092), which is why the rate was so high. For frequencies below 50 Hz, the glitch rate per hour went from roughly ~16.7 in O4a to ~2.5 in O4b. For SNR below 50, the glitch rate per hour went from ~36 per hour in O4a to ~9 per hour in O4b.
Tue Jun 03 10:11:02 2025 INFO: Fill completed in 10min 59secs
Hello! I have been working on eventually calculating how much force is being applied to three stages of the quadruple pendulum. The channels I am currently plotting in the figures attached are the DARM control signal (H1:CAL-CFTD_DELTAL_CTRL_DBL_DQ), the penultimate mass control signal (H1:CAL-CFTD_DELTAL_CTRL_PUM_DBL_DQ), the upper intermediate mass control signal (H1:CAL-CFTD_DELTAL_CTRL_UIM_DBL_DQ), the top test mass control signal (H1:CAL-CFTD_DELTAL_CTRL_TST_DBL_DQ), the external excitation signal (H1:CAL-CFTD_DELTAL_EXTERNAL_DQ) and Pcal y (H1:CAL-PCALY_RX_PD_OUT_DQ) - I should include Pcal X next time. By plotting these channels I can map out how much each stage of the quadruple pendulum is moving (or being actuated upon), the Pcal injections, and eventually compare the force needed to control each stage to keep our interferometer locked. Right now I am plotting the meters per root Hz for each channel. I am also applying an anti-whitening filter so that I can convert the signals from counts back into the physical displacements. The path to the file to plot these figures is: /ligo/home/caroline.capuano/Force_on_ETMX_for_each_stage/phase_and_mag_of_h.py All you need to do is run "python phase_and_mag_of_h.py" and it should produce both plots. Currently I am taking data from LIGO Hanford at the GPS start time of 1425831025 for a duration of 1000 seconds. There is a weird bump around 100 Hz for the external excitation signal, so Craig suggested I find another time of when we were locked and compare to see if the hump is still present. To do next: - figure out what filters to divide by so that I can calculate the force being applied to the three stages aka N/rtHz. - maybe try quick_psd instead of welch's method and see if that makes a significant difference
Two index number changes this morning:
TITLE: 06/03 Day Shift: 1430-2330 UTC (0730-1630 PST), all times posted in UTC
STATE of H1: Planned Engineering
OUTGOING OPERATOR: TJ
CURRENT ENVIRONMENT:
SEI_ENV state: CALM
Wind: 5mph Gusts, 2mph 3min avg
Primary useism: 0.02 μm/s
Secondary useism: 0.27 μm/s
QUICK SUMMARY:
IFO is in DOWN for PLANNED ENGINEERING
Today is a light maintenance day in with the plan being to continue locking H1 to NLN.
The highest state we are able to get to is: LOWNOISE_LENGTH_CONTROL.
Workstations were updated and rebooted. This was an os packages update. Conda packages were not updated.
After opslogin0 was rebooted I started the two temporary EPICS IOCs to green up the EDC and restore the HAM1 gauge signal
digivideo_dummy_ioc: 1 windows (created Tue Jun 3 06:53:08 2025)
vac_ham1_pressure_converter_ioc: 1 windows (created Tue Jun 3 06:54:12 2025)
Changed the DARM_OFFSET ISC_LOCK state number to be in order, after ENGAGE_ASC_FOR_FULL_IFO
This change was reverted - alog84741
Jennie W, Sheila, Elenna
In order to get data for mode-matching and for Elenna to get data to calibrate sideband heights we ran some mode scans after the SR3 heater was turned on last night.
16:55:24 UTC Carried out single bounce OMC scan at 10W PSL input with sensor correction on HAM6 on, high voltage on for PZT driver in HAM6, sidebands off , SRM mis-aligned, ITMY mis-aligned, DC 3 and 4 on, OMC ASC on.
Excitation freq changed to 0.005 Hz as the top peak of the TM00 mode looked squint so could have been saturating. Lowering this frequency prevented this.
Ref 15-17 corresponds to dcpd data, pzt exc signal, pzt2 dc monitor.
Then mis-aligned ITMX and aligned ITMY (Sheila had to re-align SR2 to centre on ASC-AS_C).
Measurement starts at 17:08:18 UTC.
Ref 18-20 corresponds to dcpd data, pzt exc signal, pzt2 dc monitor.
Traces saved in 20250516_OMC_scan.xml. The top left plot is the first scan bouncing beam off ITMX, the second scan is the bottom right bouncing off ITMY.
The top right is the two plots of the PZT2 DC voltage monitor. That is, the current voltage applied to the PZT. The bottom left is the plot of the voltage ramp applied to the PZT2 on the OMC for this measurement.
The ndscope attached shows the power in mA transmitted through the OMC on the top, then the PZT used for the scan DC voltage underneath, then the input PZT voltage underneath that, then the reflected power from the OMC in mW, then at the bottom the SR3 heater element temperature in degrees.
Elenna did two more scans in single bounce with sidebands back on and different modulations depths in each.
See Elenna's comment on her previous measurement where this saturation happened.
Turn off the sidebands - instructions in this alog.
Sheila and I ran one more OMC scan with sidebands off after OM2 heated up. Attached is the screenshot with scans off both ITMX and ITMY, data is saved in [userapp]/omc/h1/templates/OMC_scan_single_bounce_sidebands_off.xml
I also ran two OMC scans, single bounce off ITMY, 10 W input, with the sidebands ON. One measurement I ran with the sidebands set to 23 dBm and 27 dBm (9 and 45 MHz) and another set to 20 dBm and 21 dBm (9 and 45 MHz). I will use these measurements to calibrate the modulation depth. Data saved in /opt/rtcds/userapps/release/omc/h1/templates/OMC_scan_single_bounce_RF_cal.xml
SR3 heater was on for this measurement but it should have little effect on my results.
Looked closer at these HWS signals during SR3 heater heat up and cool down. In all these plots, the two t-cursors are used as the reference and shown HWS live image.
Some strange things:
TJ, Camilla, Sheila
TJ and Camilla got the HWSs working, and now we turned on the SR3 heater at 15:54 UTC, 2W requested power. This is to do a check of the SR3 heater calibration and range similar to 27262
SR3 heating up can be seen on the HWS signals but is not particulatly clear, see attached.
Looking at when this test was done at LLO, the lens changing happened over a period of three hours and the lens power increased in the same direction on both HWS, so its possible our HWS are not a good witness for the SR3 curvature change.
Aidan calculated 2.45 uD/W at LLO, and we get 9.44 uD/W (from the H1:TCS-ITM{Y,X}_HWS_PROBE_SPHERICAL_POWER trends with an estimated noise of 4.48e-12uD/W.
Looked closer at these HWS signals during SR3 heater heat up and cool down. In all these plots, the two t-cursors are used as the reference and shown HWS live image.
Some strange things:
With the numbers from ITMY HWS only, and looking at the 3hr 11 m cooldown in Camilla's photo, the lens change is 6.68e-6 Dioptres/W taking into account that the HWS beam passes twice through SR3.
After talking with Camilla, she reminded me the change in RoC (delta R) =/= 2/(delta D),
where D is defocus (1/focal length).
but instead delta R = 2/(2/R + delta D) - R
Where R=36.013m is given in https://git.ligo.org/IFOsim/ligo-commissioning-modeling/-/blob/main/LHO/yaml/lho_O4.yaml?ref_type=heads
delta R comes out as 4.3mm +/- 0.18 mm (which is the same order of magnitude as the change Aidan measured in alog #27262 at LLO).
The error was estimated from looking at the noise on the spherical power and propagating through the calculation of delta R.