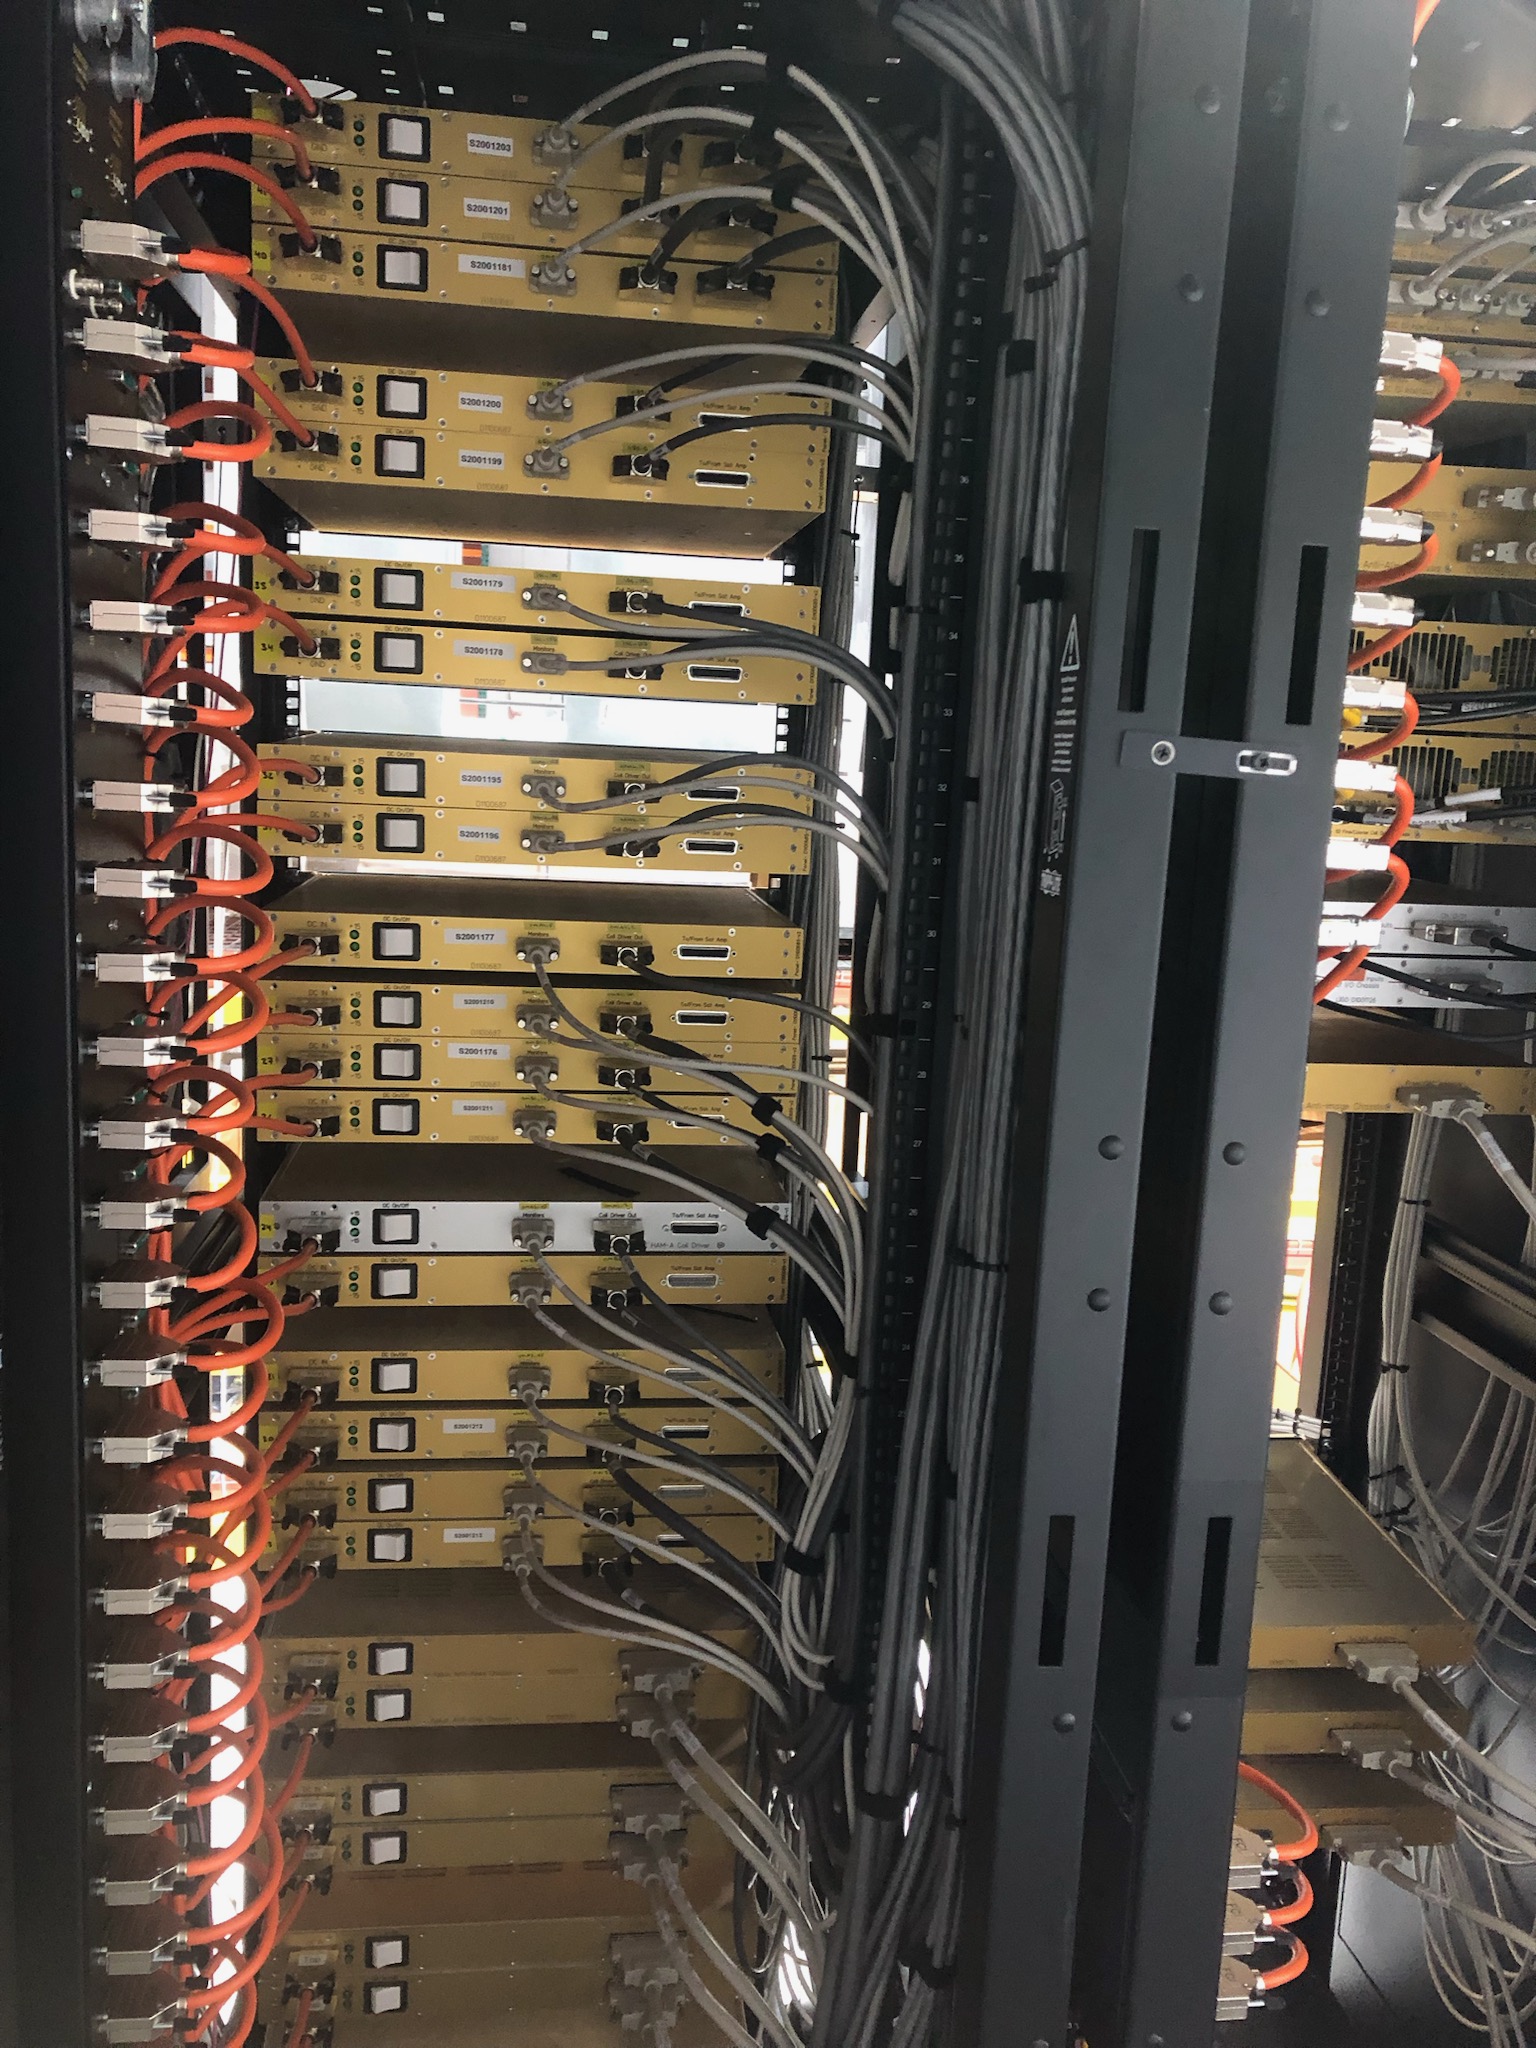
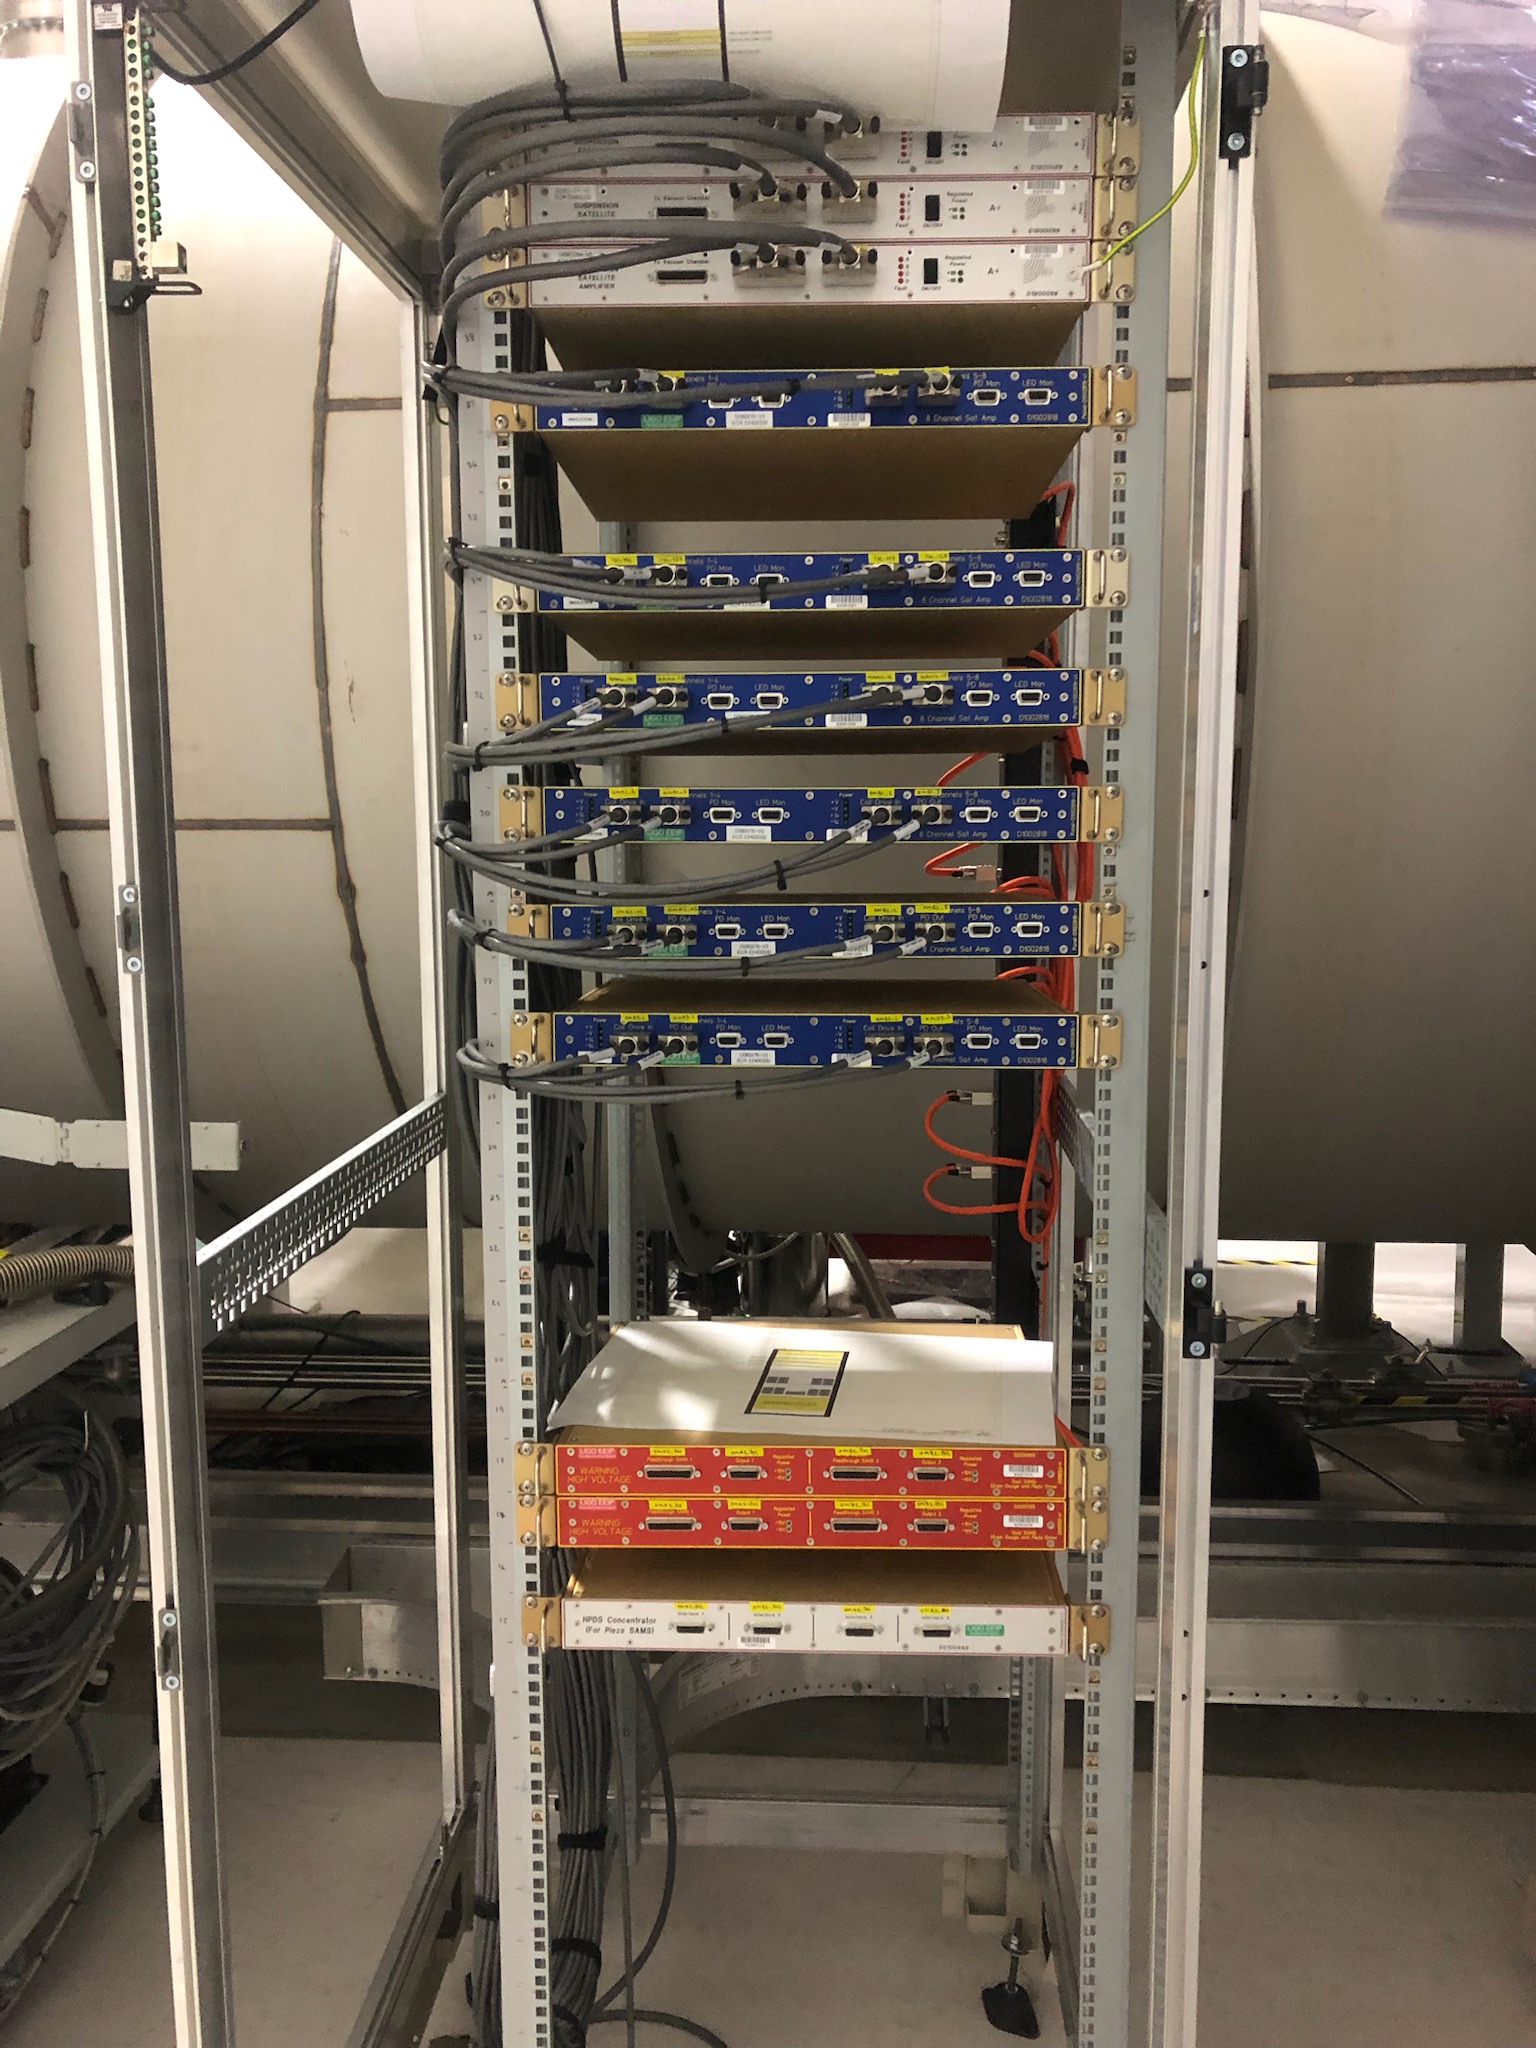
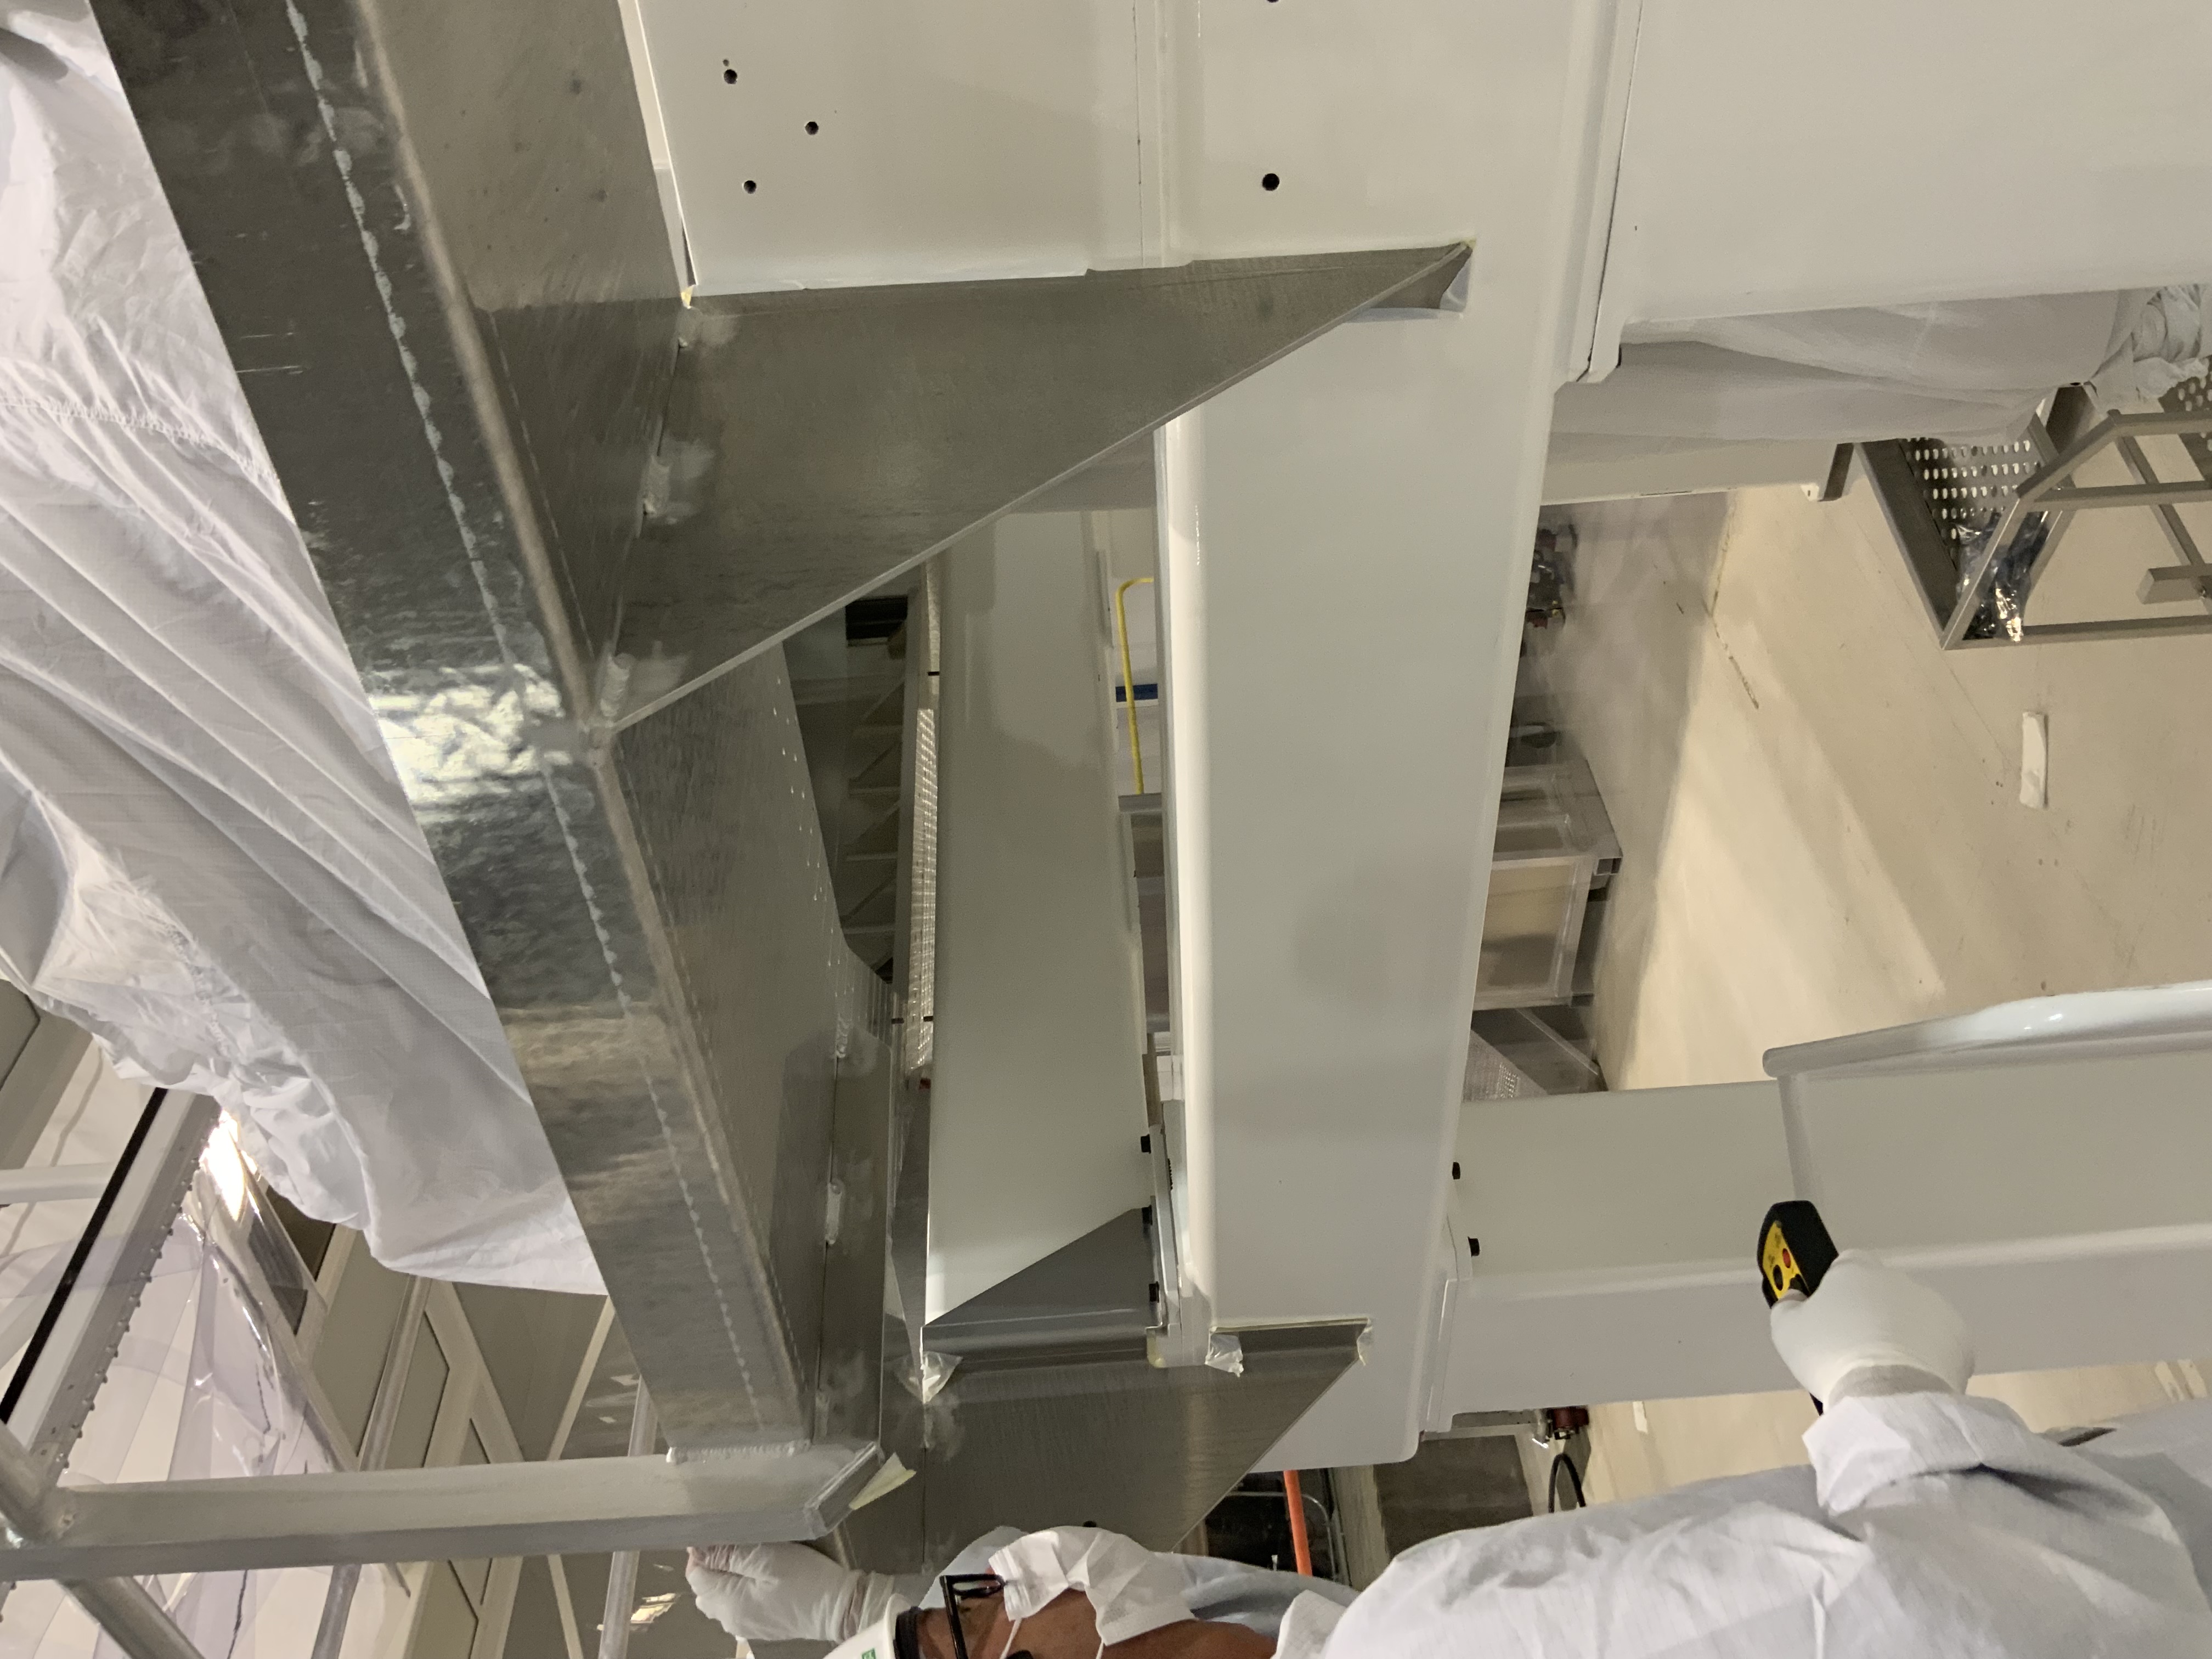
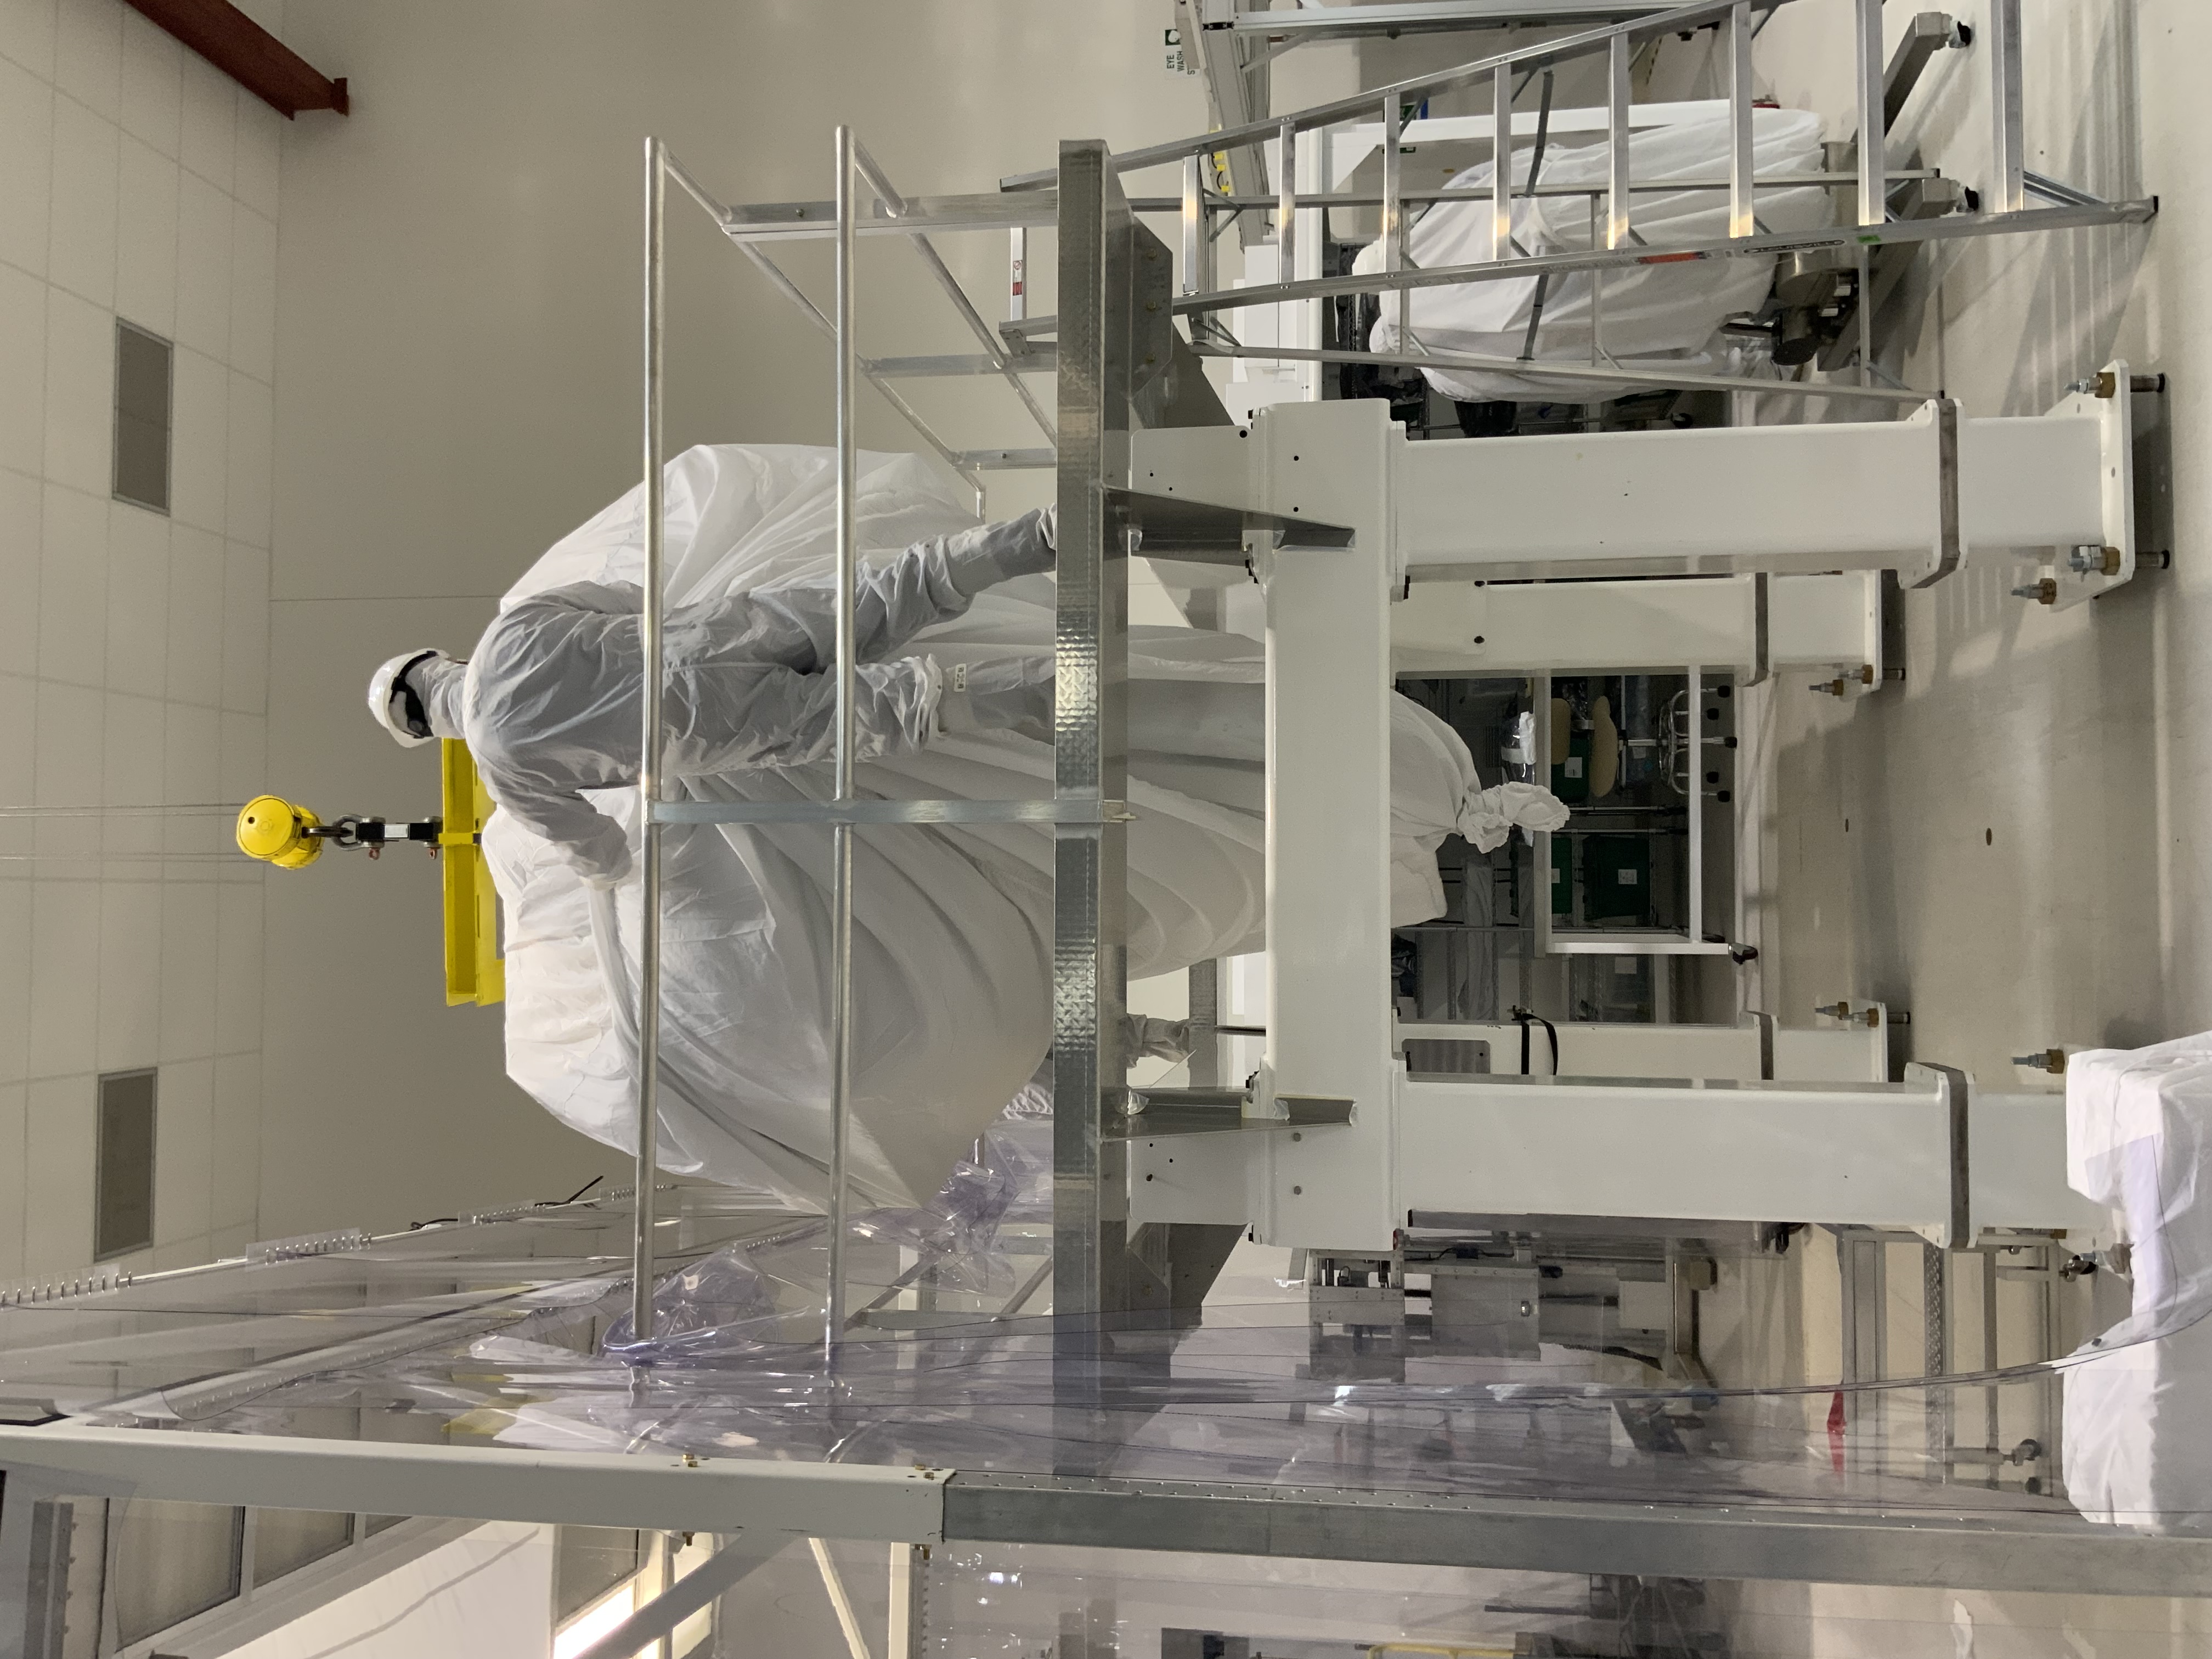
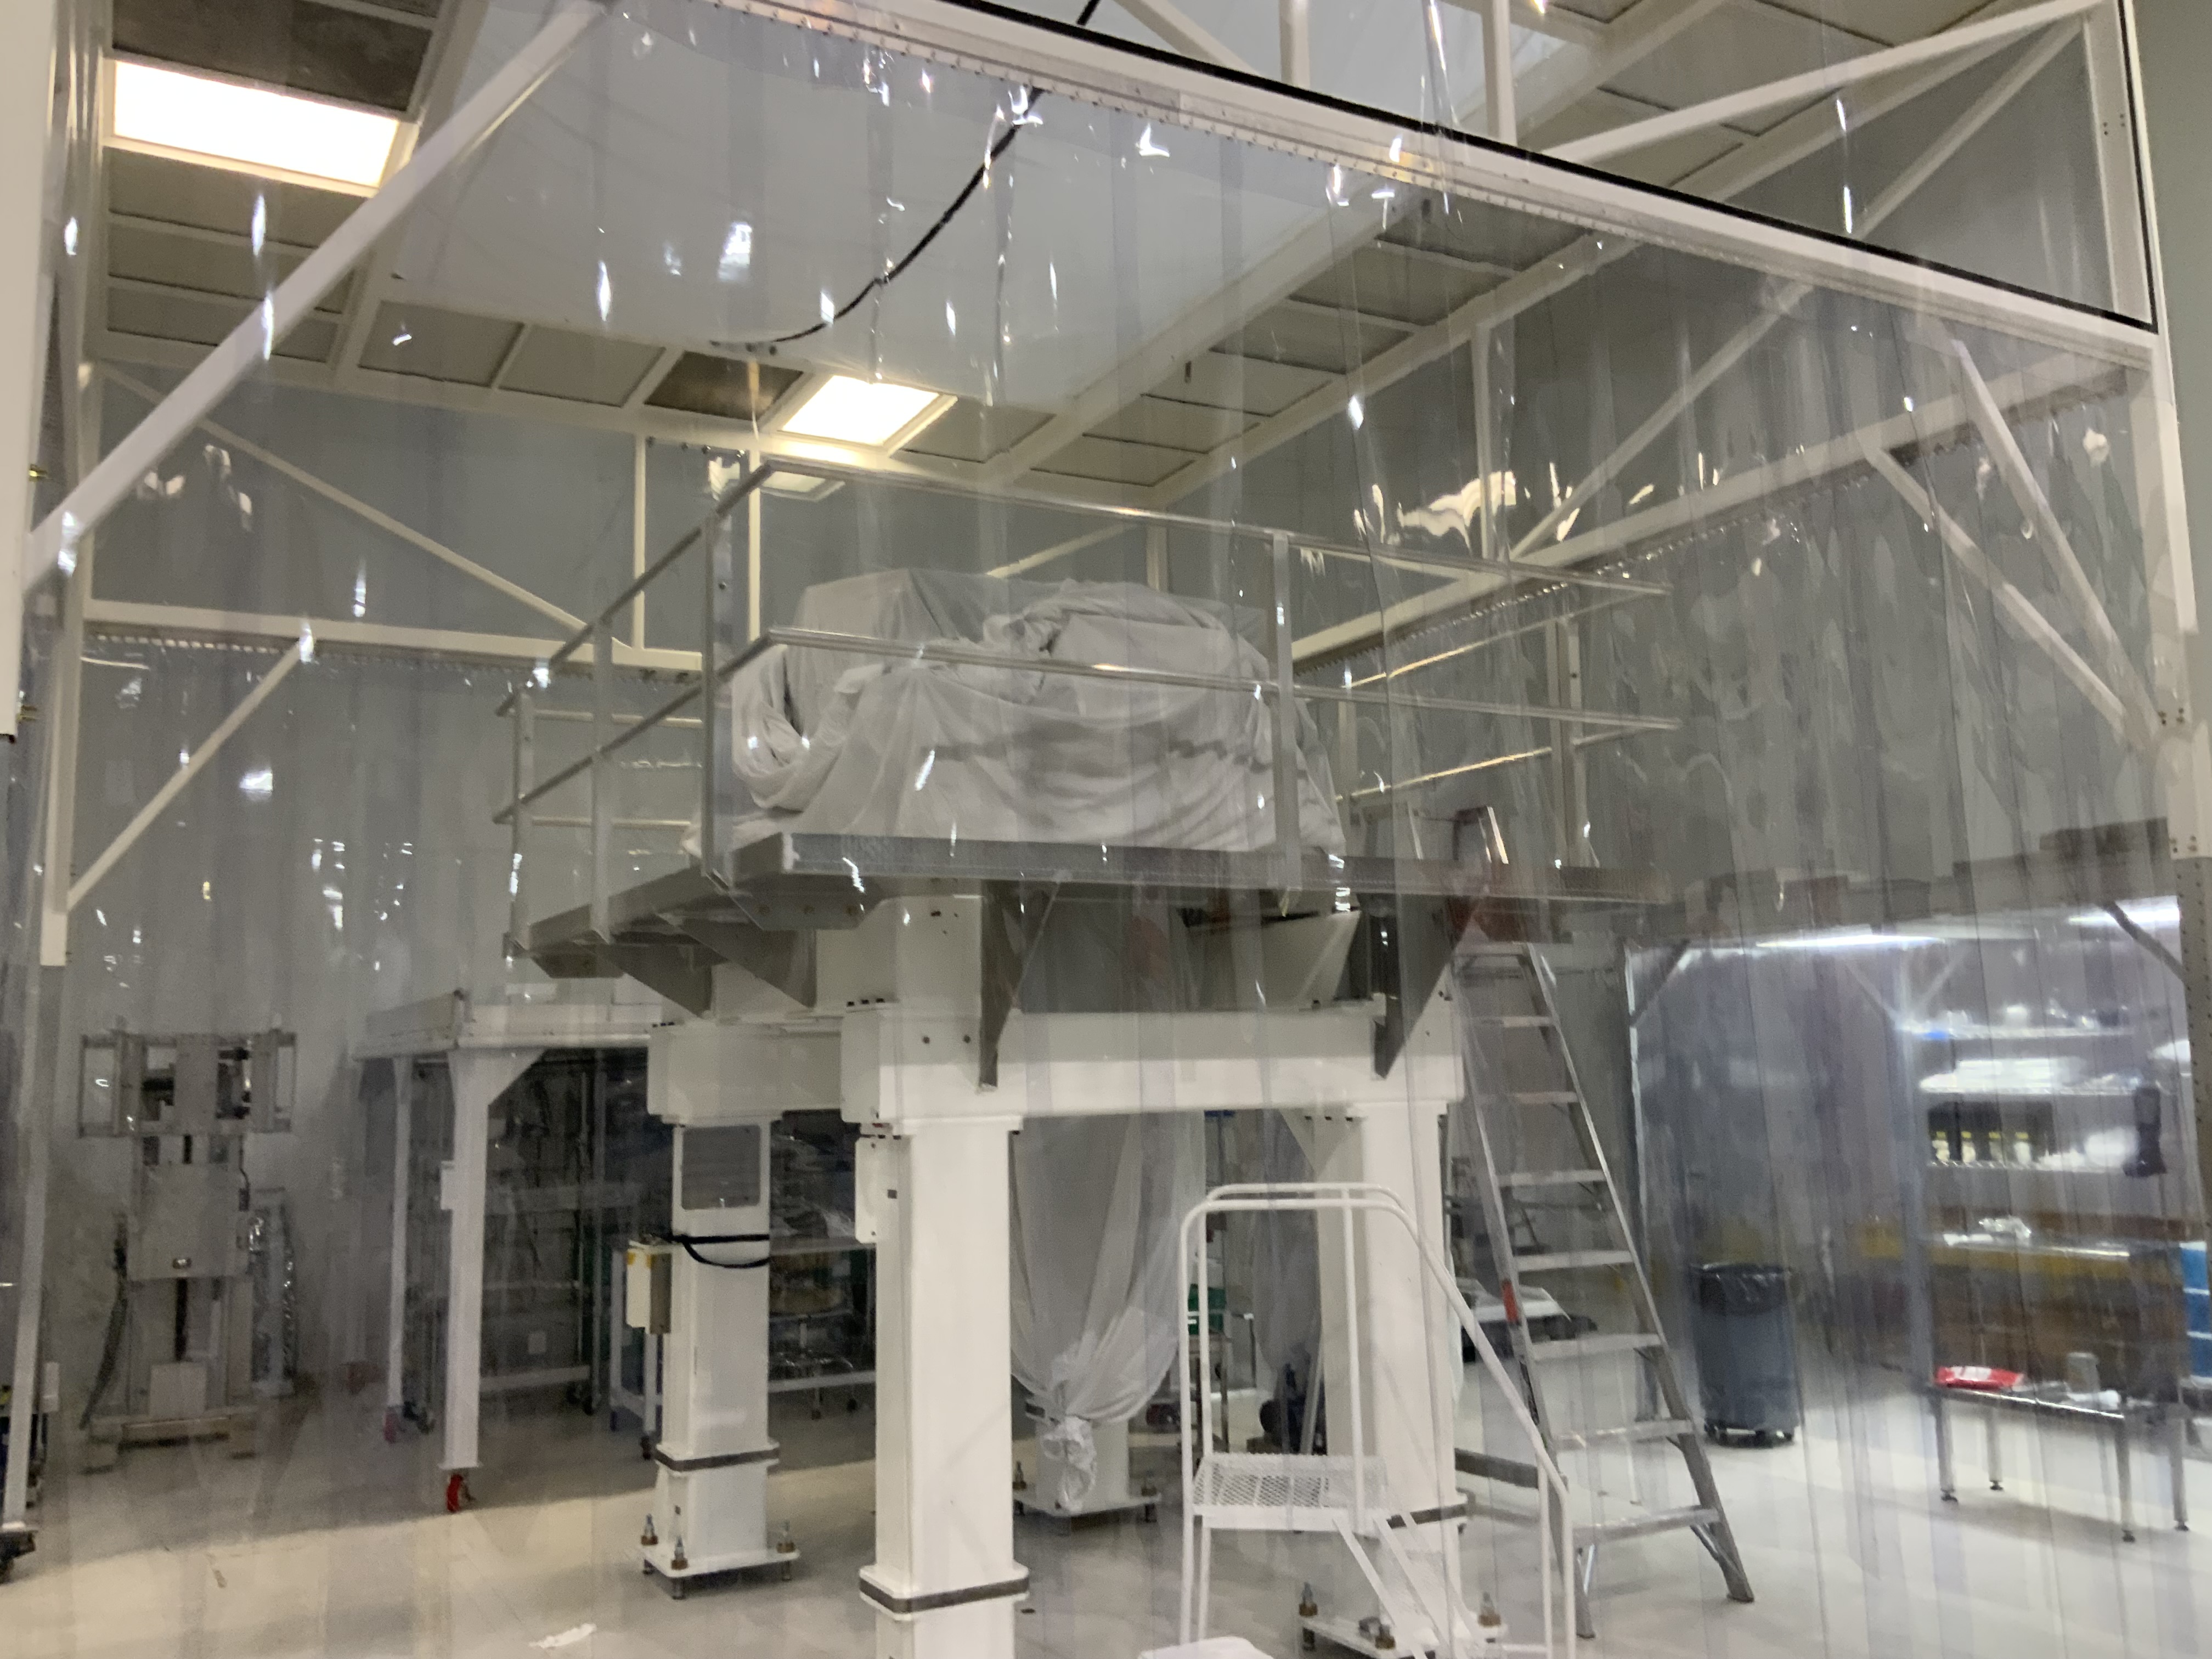
The HAM6 RGA tree had a known leak coming from the needle valve on the calibrated leak, so the calibrated leaks were removed from the system and the tree now only consists of the RGA, 10 l/s Ion Pump and a pump out port.
The tree was re-wrapped with heat tape and is currently baking at high temp using an aux cart and 80 l/s turbopump. Caution tape has been installed around the -Y door of HAM6, please avoid the area.
WP13221 Add BBSS Fast Channels to DAQ
Tom, Oli, Erik, Dave:
18 BBSS_OSEMINF (SUM, X, Y) DQ channels were added to the DAQ, all at 256Hz. DAQ retstart was required.
WP13223 Add PT100A VACSTAT slow channels to DAQ
Dave:
A new H1EPICS_VACSTAT.ini was generated adding PT100A. An EDC+DAQ restart was required.
WP13228 Add FW2 slow channels to DAQ
Erik, Jonathan, Dave:
Puppet was changed to add three channels unique to FW2 (STATE_0, STATE_1, NUM_WRITERS). An EDC+DAQ restart was required.
WP13235 h1sush6 IO Chassis Install
Fil, Dave:
Fil moved the IO Chassis for h1sush6 from its temporary location in an adjacent rack into the SUSH6 rack on the MER. h1sush6 front end was powered down for the duration of this work.
DAQ Restart
Erik, Jonathan, Dave:
The DAQ and EDC were restarted.
FW2 stopped at the time puppet was upgraded due to a file creation race condition.
For the DAQ restart itself, the main issue was two spontaneous restarts of FW1, both after running for 10 minutes but not synced to the writing of the second trend frame files.
11:23:13 h1susb2h34 h1suslo12 <<< New model, add DQ chans to DAQ
11:26:44 h1daqgds0 [DAQ] <<< 0-leg restart, susl012, vacstat, fw2 additions
11:26:48 h1daqfw0 [DAQ]
11:26:48 h1daqtw0 [DAQ]
11:26:49 h1daqnds0 [DAQ]
11:27:39 h1susauxb13 h1edc[DAQ] <<< EDC for vacstat, fw2
11:30:49 h1daqdc1 [DAQ] <<< 1-leg restart
11:30:58 h1daqfw1 [DAQ]
11:31:00 h1daqtw1 [DAQ]
11:31:03 h1daqnds1 [DAQ]
11:31:11 h1daqgds1 [DAQ]
11:32:13 h1daqgds1 [DAQ] <<< gds1 needed a restart
11:40:28 h1sush6 ***REBOOT*** <<< Power up after IO Chassis work
11:41:23 h1daqfw1 [DAQ] <<< First FW1 spontaneous restart, suspiciously close to start of sush6
11:41:30 h1sush6 h1iopsush6
11:41:43 h1sush6 h1susom0
11:41:56 h1sush6 h1susobs
11:42:09 h1sush6 h1susam
11:42:22 h1sush6 h1susomcab
11:42:35 h1sush6 h1susom1ab
11:42:48 h1sush6 h1susom2ab
11:43:01 h1sush6 h1susom3ab
11:51:41 h1daqfw1 [DAQ] <<< Second FW1 spontaneous restart, roughly +10mins
12:02:32 h1daqfw1 [DAQ] <<< Third FW1 spontaneous restart, again roughly +10mins
WP 13235
WP 13169
Drawing O5 SUS HAM6 (sush6) System Wiring Diagrams - D2300379
The O5 SUS HAM6 electronics and in-rack cabling installation in the MER is complete. System wiring diagrams D2300379 will need to be updated to show no IO h1susauxh6 was installed. New ADC cards (SUS AUX) were installed in the h1seih7 IO chassis.
IO chassis h1sush6 and h1sush7 share a 24V power supply. A dual Kepco power supply was installed to power the ±18V for SUS-M2. New electronics except the h1sush6 IO chassis were left powered off.
Status of the SUS-R7 rack is ongoing. All electronics installed. All long cables from MER and CER pulled and dressed. Rack requires ±18V and 200V for PSAMS. Depending on loads, plan is to use the SUS-R4 power supplies for the ±18V. The HV power supply will need to be placed on the HAM6 vacuum gauge interlock.
Fil, Erik, Dave:
we have powered down h1sush6 front end in preparation for Fil's move of the IO Chassis into the SUSH6 rack on the MER. Reminder that this front end is not connected to the Dolphin switch, so there is no risk of a corner station Dolphin glitch.
Pictures and the timelapse video from the BSC2 Cartridge (alog 90021) last week are attached and/or at https://caltech.box.com/s/4ahvfvdnaev8iiz3ktgda8g00srpvv1x
tagging for photos.
TITLE: 05/05 Day Shift: 1430-2330 UTC (0730-1630 PST), all times posted in UTC
STATE of H1: Planned Engineering
OUTGOING OPERATOR: None
CURRENT ENVIRONMENT:
SEI_ENV state: MAINTENANCE
Wind: 14mph Gusts, 10mph 3min avg
Primary useism: 0.02 μm/s
Secondary useism: 0.11 μm/s
QUICK SUMMARY: Surveying on the BS at the test stand in the LVEA continues today, along with RGA work at HAM6 and CP1 regen near the Y-manifold. HAM2 doors are also likely to come off today.
TITLE: 05/05 Day Shift: 1430-2330 UTC (0730-1630 PST), all times posted in UTC
STATE of H1: Planned Engineering
INCOMING OPERATOR: None
SHIFT SUMMARY: Work continued with the BS on the test stand, preparations were made for HAM2 doors to come off later this week, and baffle installation in HAM3 all took place today.
I neglected to post this yesterday afternoon and unfortunately did not save the log.
Workstations were updated and rebooted. This was an OS packages update. Conda packages were not updated.
Gerardo, Jordan, Jonathan, Dave:
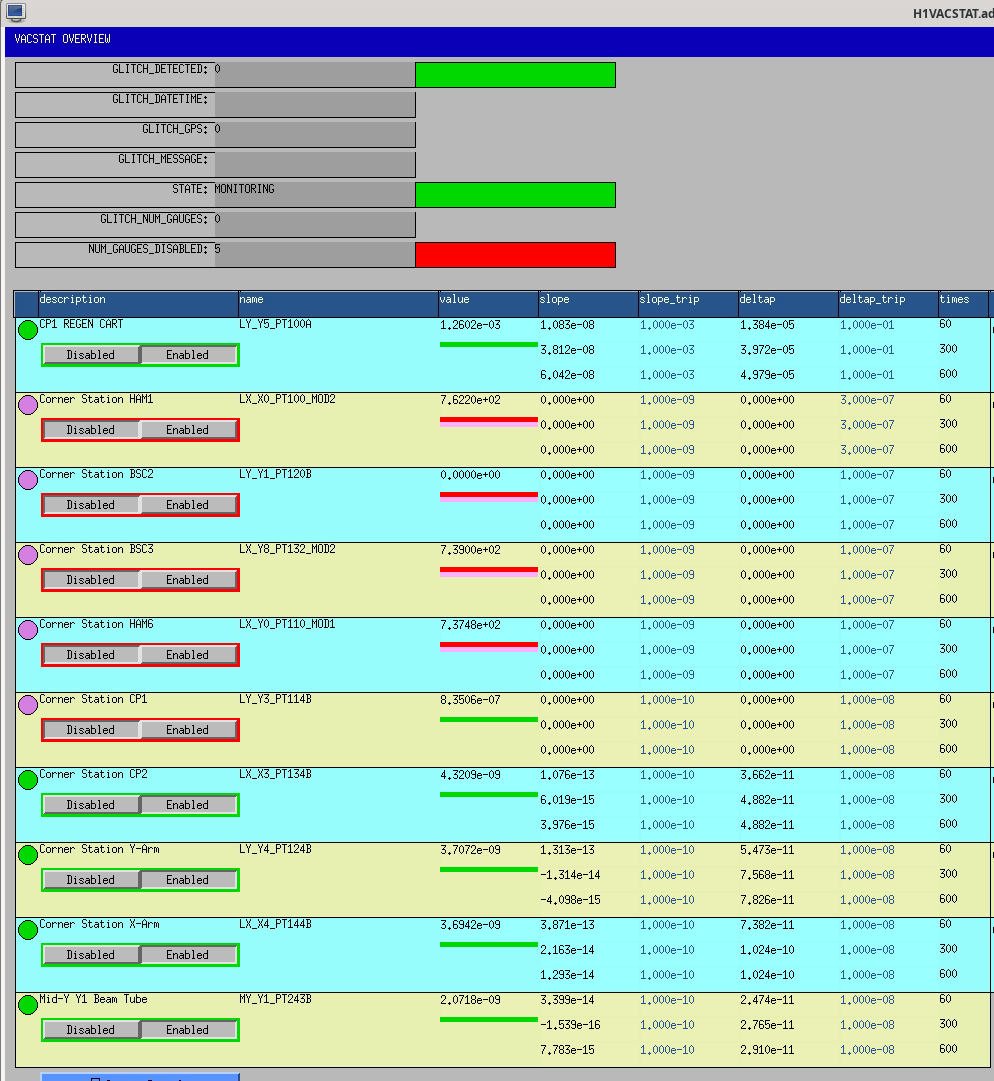
PT114 has started to rise rapidly. At 16:50 I changed its alarm high from 2.0e-08 to 5.0e-04.
Later PT114B's VACSTAT continued to trip due to the large delta-P. After clearing the alarms I have disabled PT114B in VACSTAT (but its level alarms remain active).
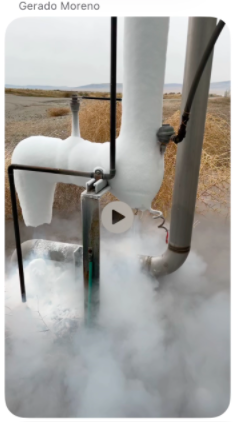
As mentioned by Gerardo CP1's outside discharge line pipe is now completely free of ice (Nov 2025 image added for comparison).
The pressure at PT114 has continued to rise this morning and mostly leveled out, but it's bouncing around the channel's low-level alarm threshold at 1e-5 Torr. This is triggering Verbal Alarms and the CR alarm handler computer every time the pressure goes above 1e-5 Torr, which is on average a few times per minute.
I've commented out PT114 from the Verbal Alarms vacuum channel list to reduce redundant alarms and will look into modifying the thresholds somehow for the alarm handler.
h1daqdc0 stopped running around the time I restarted vacstat_ioc on cdsioc0 to clear an alarm. DC0 is pingable, but we cannot ssh onto it. Jonathan is taking a look, we may have to power cycle it via IPMI.
DC0 was power cycled at 18:52 PDT. After that we did a clean 0-leg restart to resync the other nodes to the DC.
Turn ALS X laser back back on, we used it to take some ALS return beam beam profiles. It's been off since the interlock was worked on. It is now shuttered.
Ibrahim, Betsy
Today we:
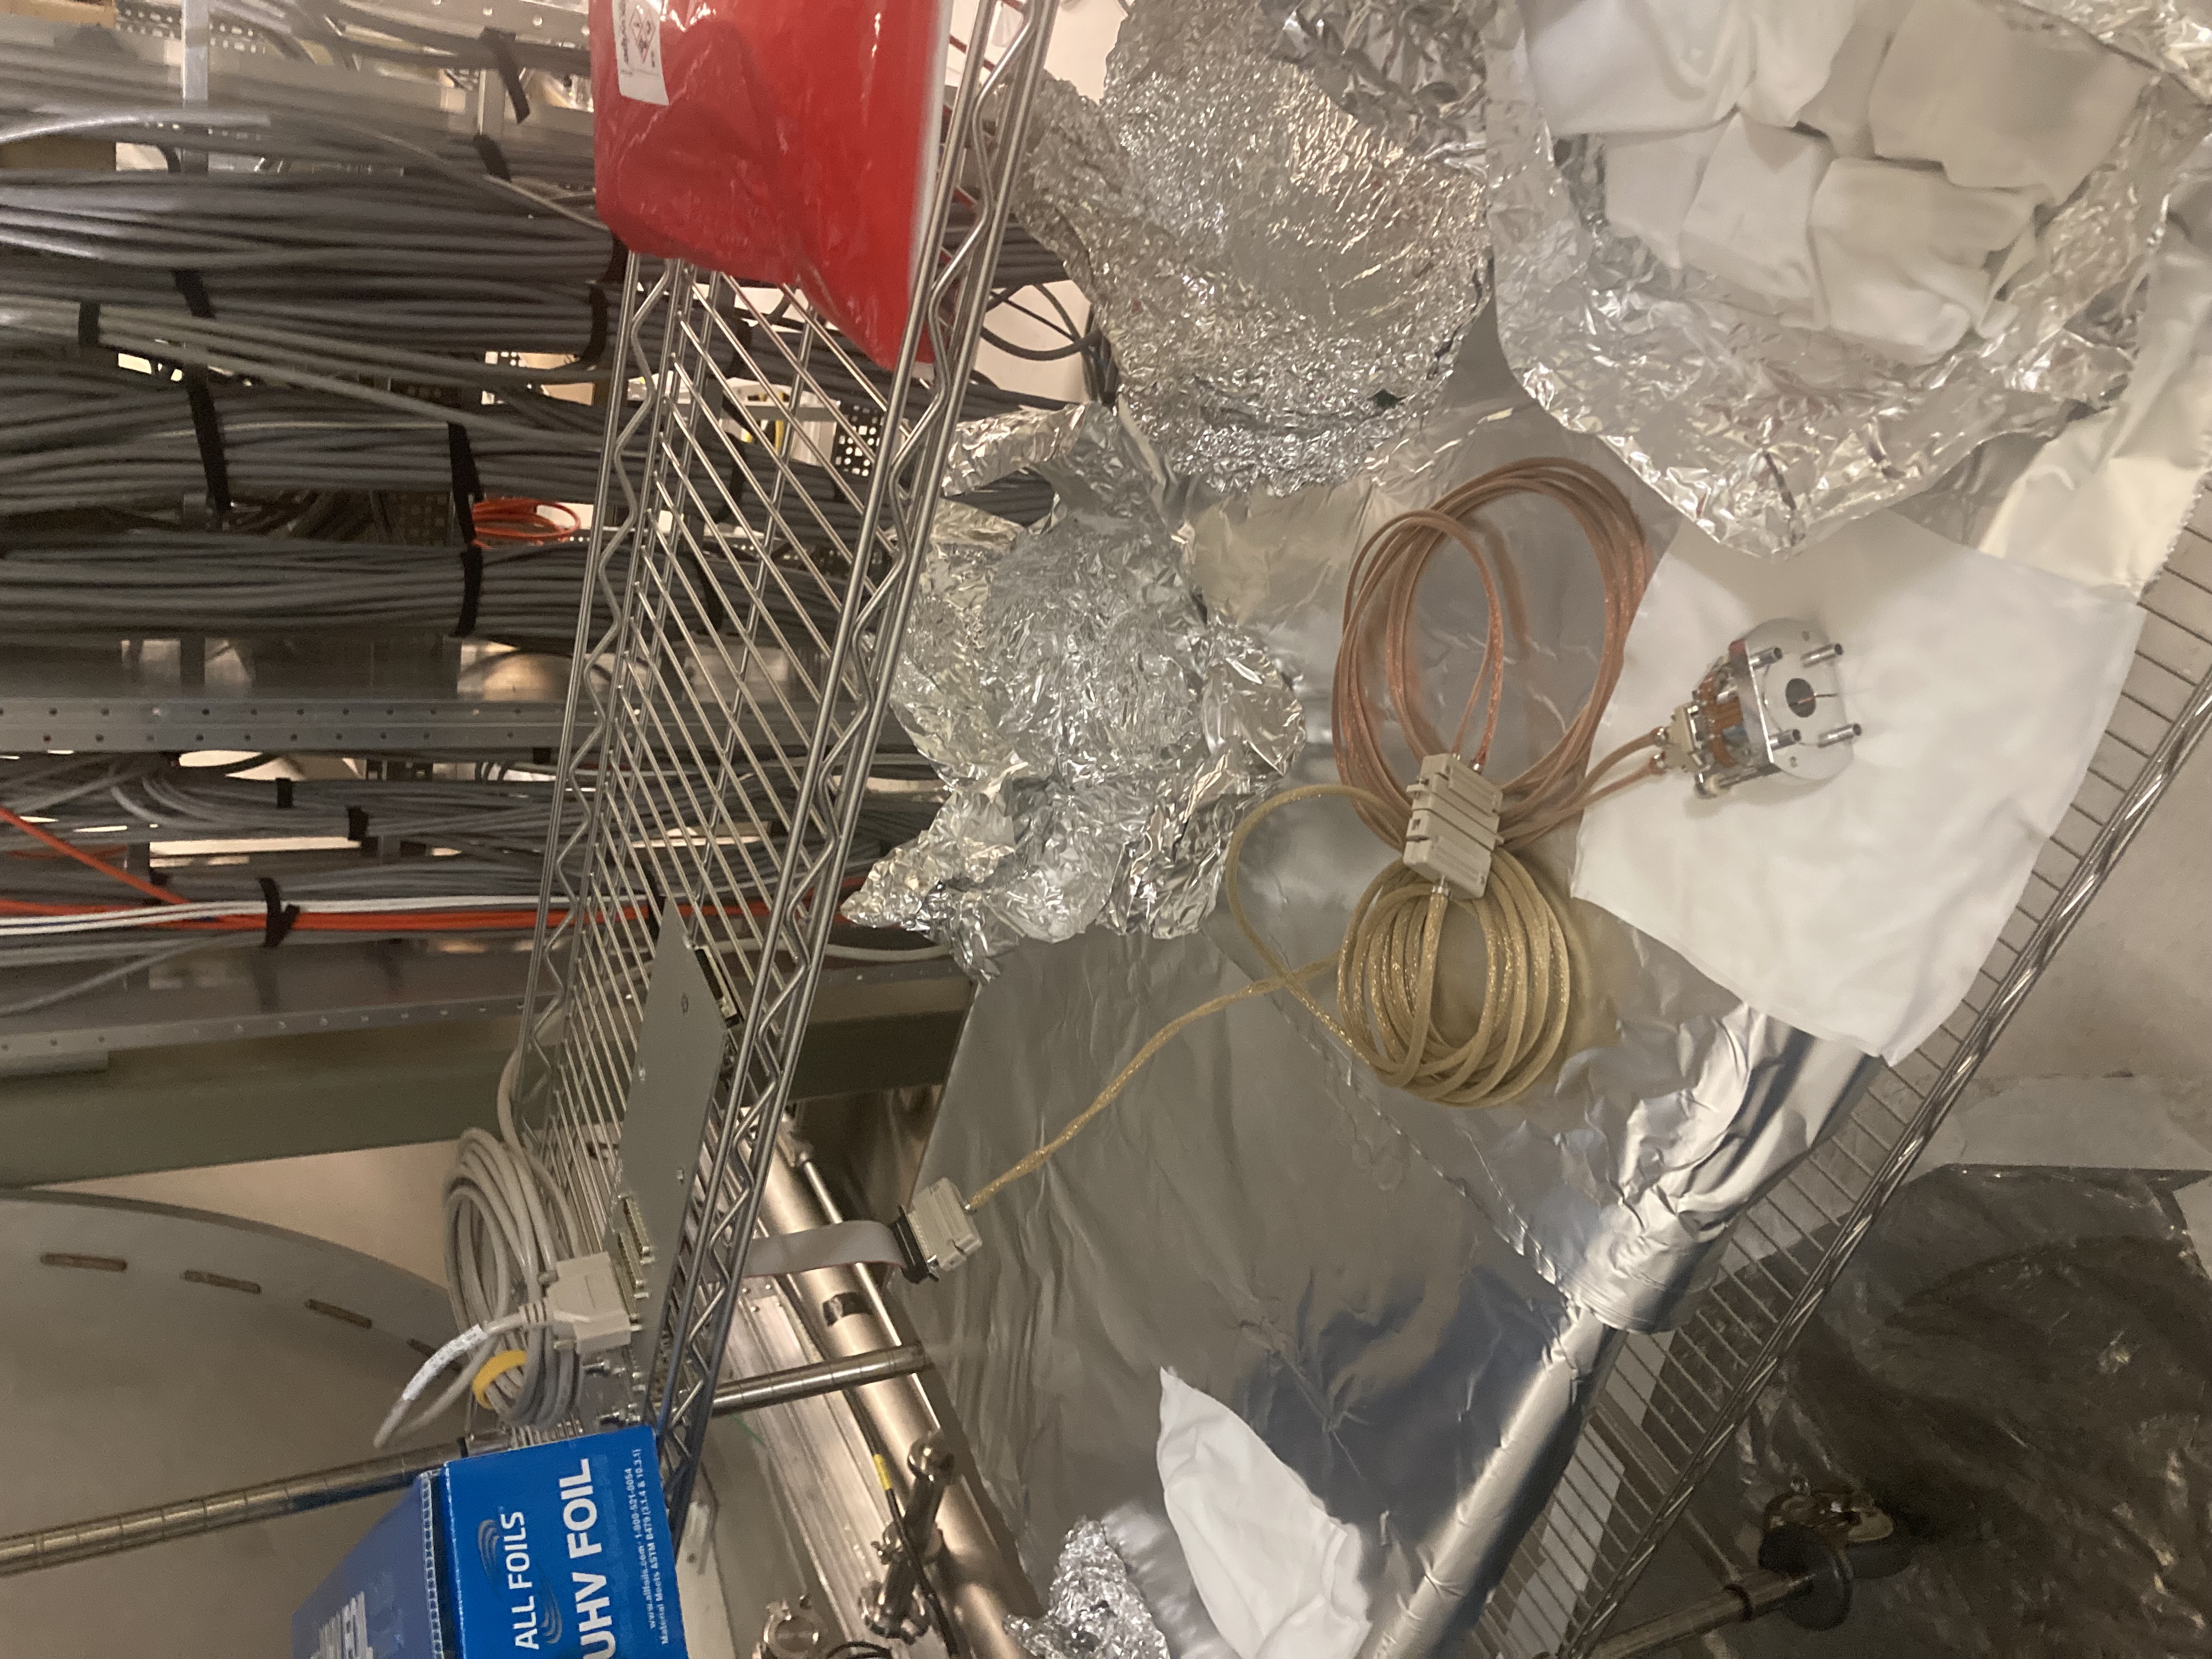
On Friday I setup the QOSEM calibration rig in the triple lab, in the staging building. It consists of a motorored translation stage (open loop picomotor), which drives the QOSEM flag into and out of the QOSEM body, while the sum and difference voltages produced by the sat amp are monitored. The position of the stage, and hence flag is readout by a Mach-Zender interferometer (SmarAct PicoScale). This is all controlled by a laptop running a python script.
The purpose of setting up this rig again is to better calibrate each QOSEM going on to the BBSS M1, by taking calibration data with the exact sat amp and flag that each QOSEM will use.
Today I finished setting up the QOSEM calibration rig in the triples lab. I grabbed the LHO production QOSEM sat amp from SUS-R2 for use in this calibration, and will match the flag and QOSEM pair to what they will be on the BBSS, such that the calibration is as valid as possible. The rig is all ready to go for calibration runs tomorrow.
[Tom Roocke, Oli]
Summary: The 6 QOSEMs and their signal chain for the BBSS are operational with the final sat amp, CER wiring, CDS mapping, in vac DB25 extension cables. All that remains to test before SUS installation is the duopus cables, which are in C&B currently.
In continuation from yesterday, we are testing out the QOSEM signal chain prior to installation of the BBSS. Yesterday we verified the sat amp was still functional and the readouts were showing up in CDS appropriately. See LHO:90072. Today we checked both the DB25 to DB25 extension cables, and the QOSEMs. To come is testing of the duopus cables, which are still in C&B.
DB25 Extension Testing:
Using a known functional Duopus cable (S2600215), and inair DB25, we tested the three DB25 extension cables by reading for the QOSEM coil resistance and diode drops at the in air DB25, where it connects to the sat amp. See the signal continuity test section in T2600170 for more information on this. All 3 cables are functional.
S2001548: DB25 working
S2100358: DB25 working
S2100410: DB25 working
QOSEM CDS Readout Testing:
Using a known functional Duopus Cable (S2600215), DB25 Extension (S2100410) and in air DB25, we checked for the open sum voltage in the CDS readout. This is the voltage seen on the sum channel of the QPD with no lens installed. Seeing a nonzero voltage here indicates that the QOSEM LED, QPD and signal chain are functional, but will be far lower than the operational sum level when the lens flag is appropriately focusing light onto the QPD. We tested the open sum voltage for all 6 QOSEMs designated for the BBSS. All QOSEMs and there signal chain are functional.
S2600008: working with open sum of 13910
S2600009: working with open sum of 14755
S2600010: working with open sum of 15550
S2600011: working with open sum of 15470
S2600012: working with open sum of 15348
S2600013: working with Open Sum of 14380
Today the QOSEM Duopus cable finished C&B, so I unbagged and tested them in the triples lab. I checked for continuty and any shorted pins with a multimeter, and all 4 cables passed. With this all parts of the QOSEM signal chain have been tested and ready to go for on suspension testing
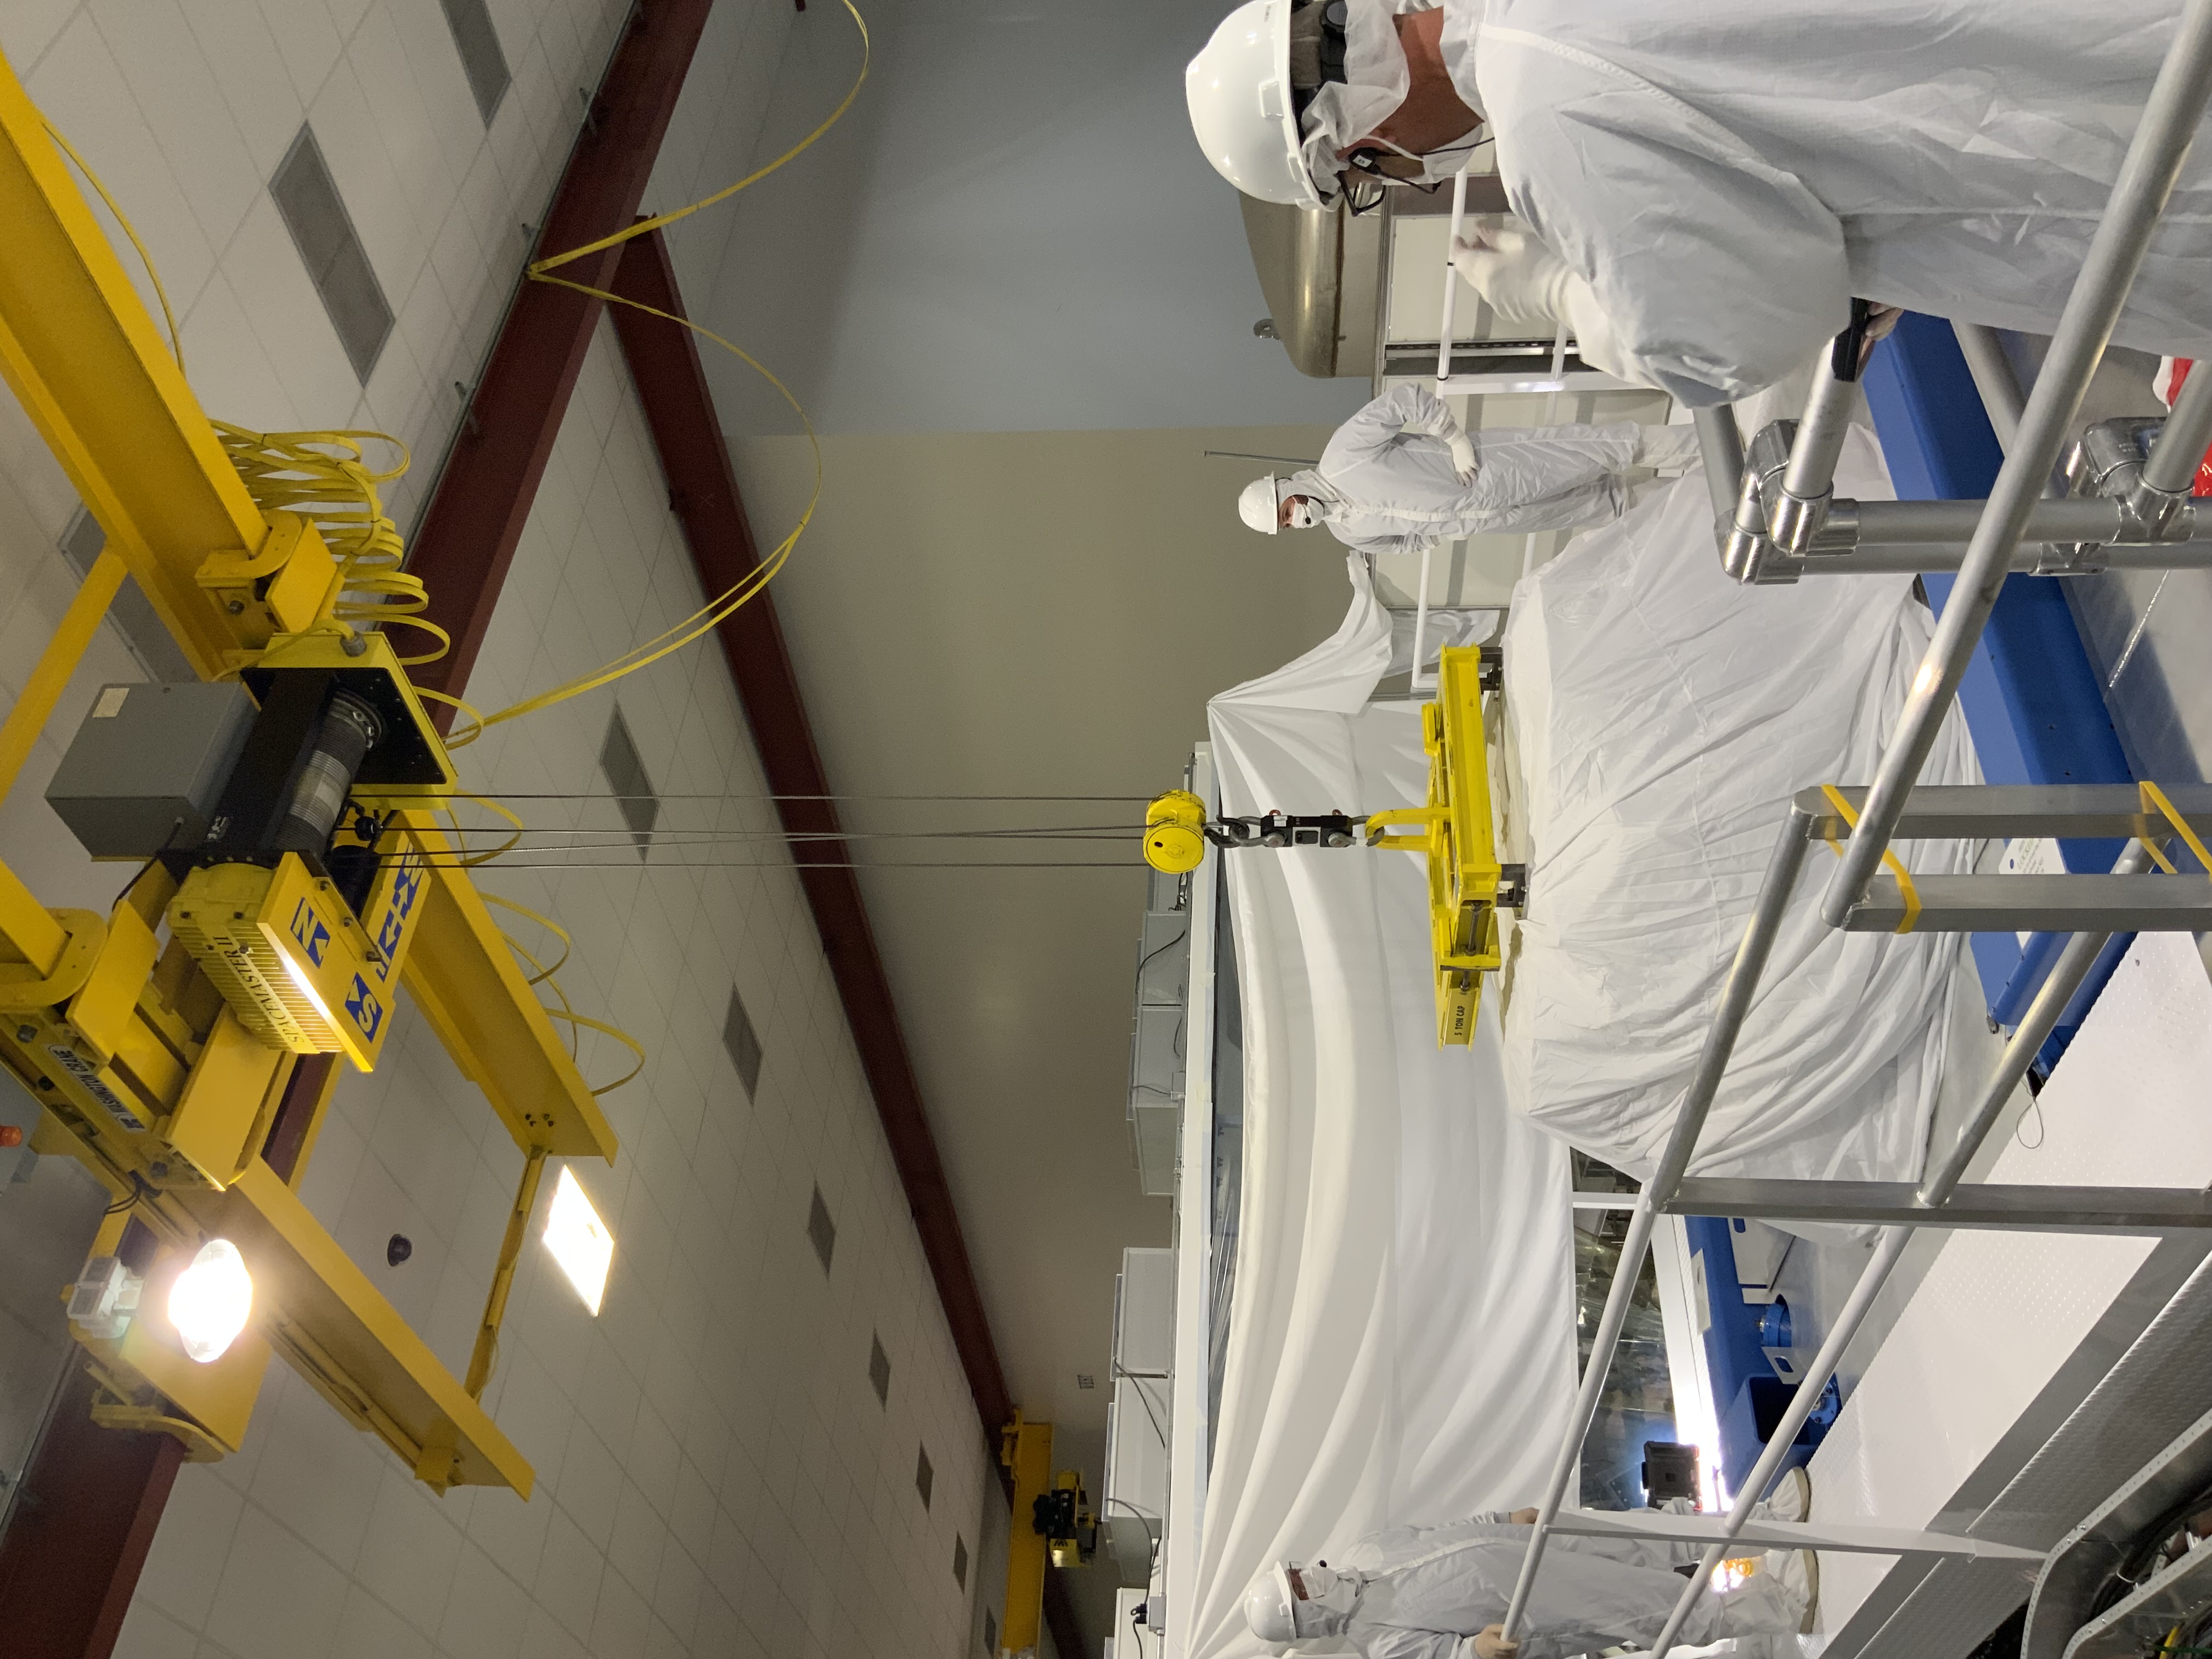
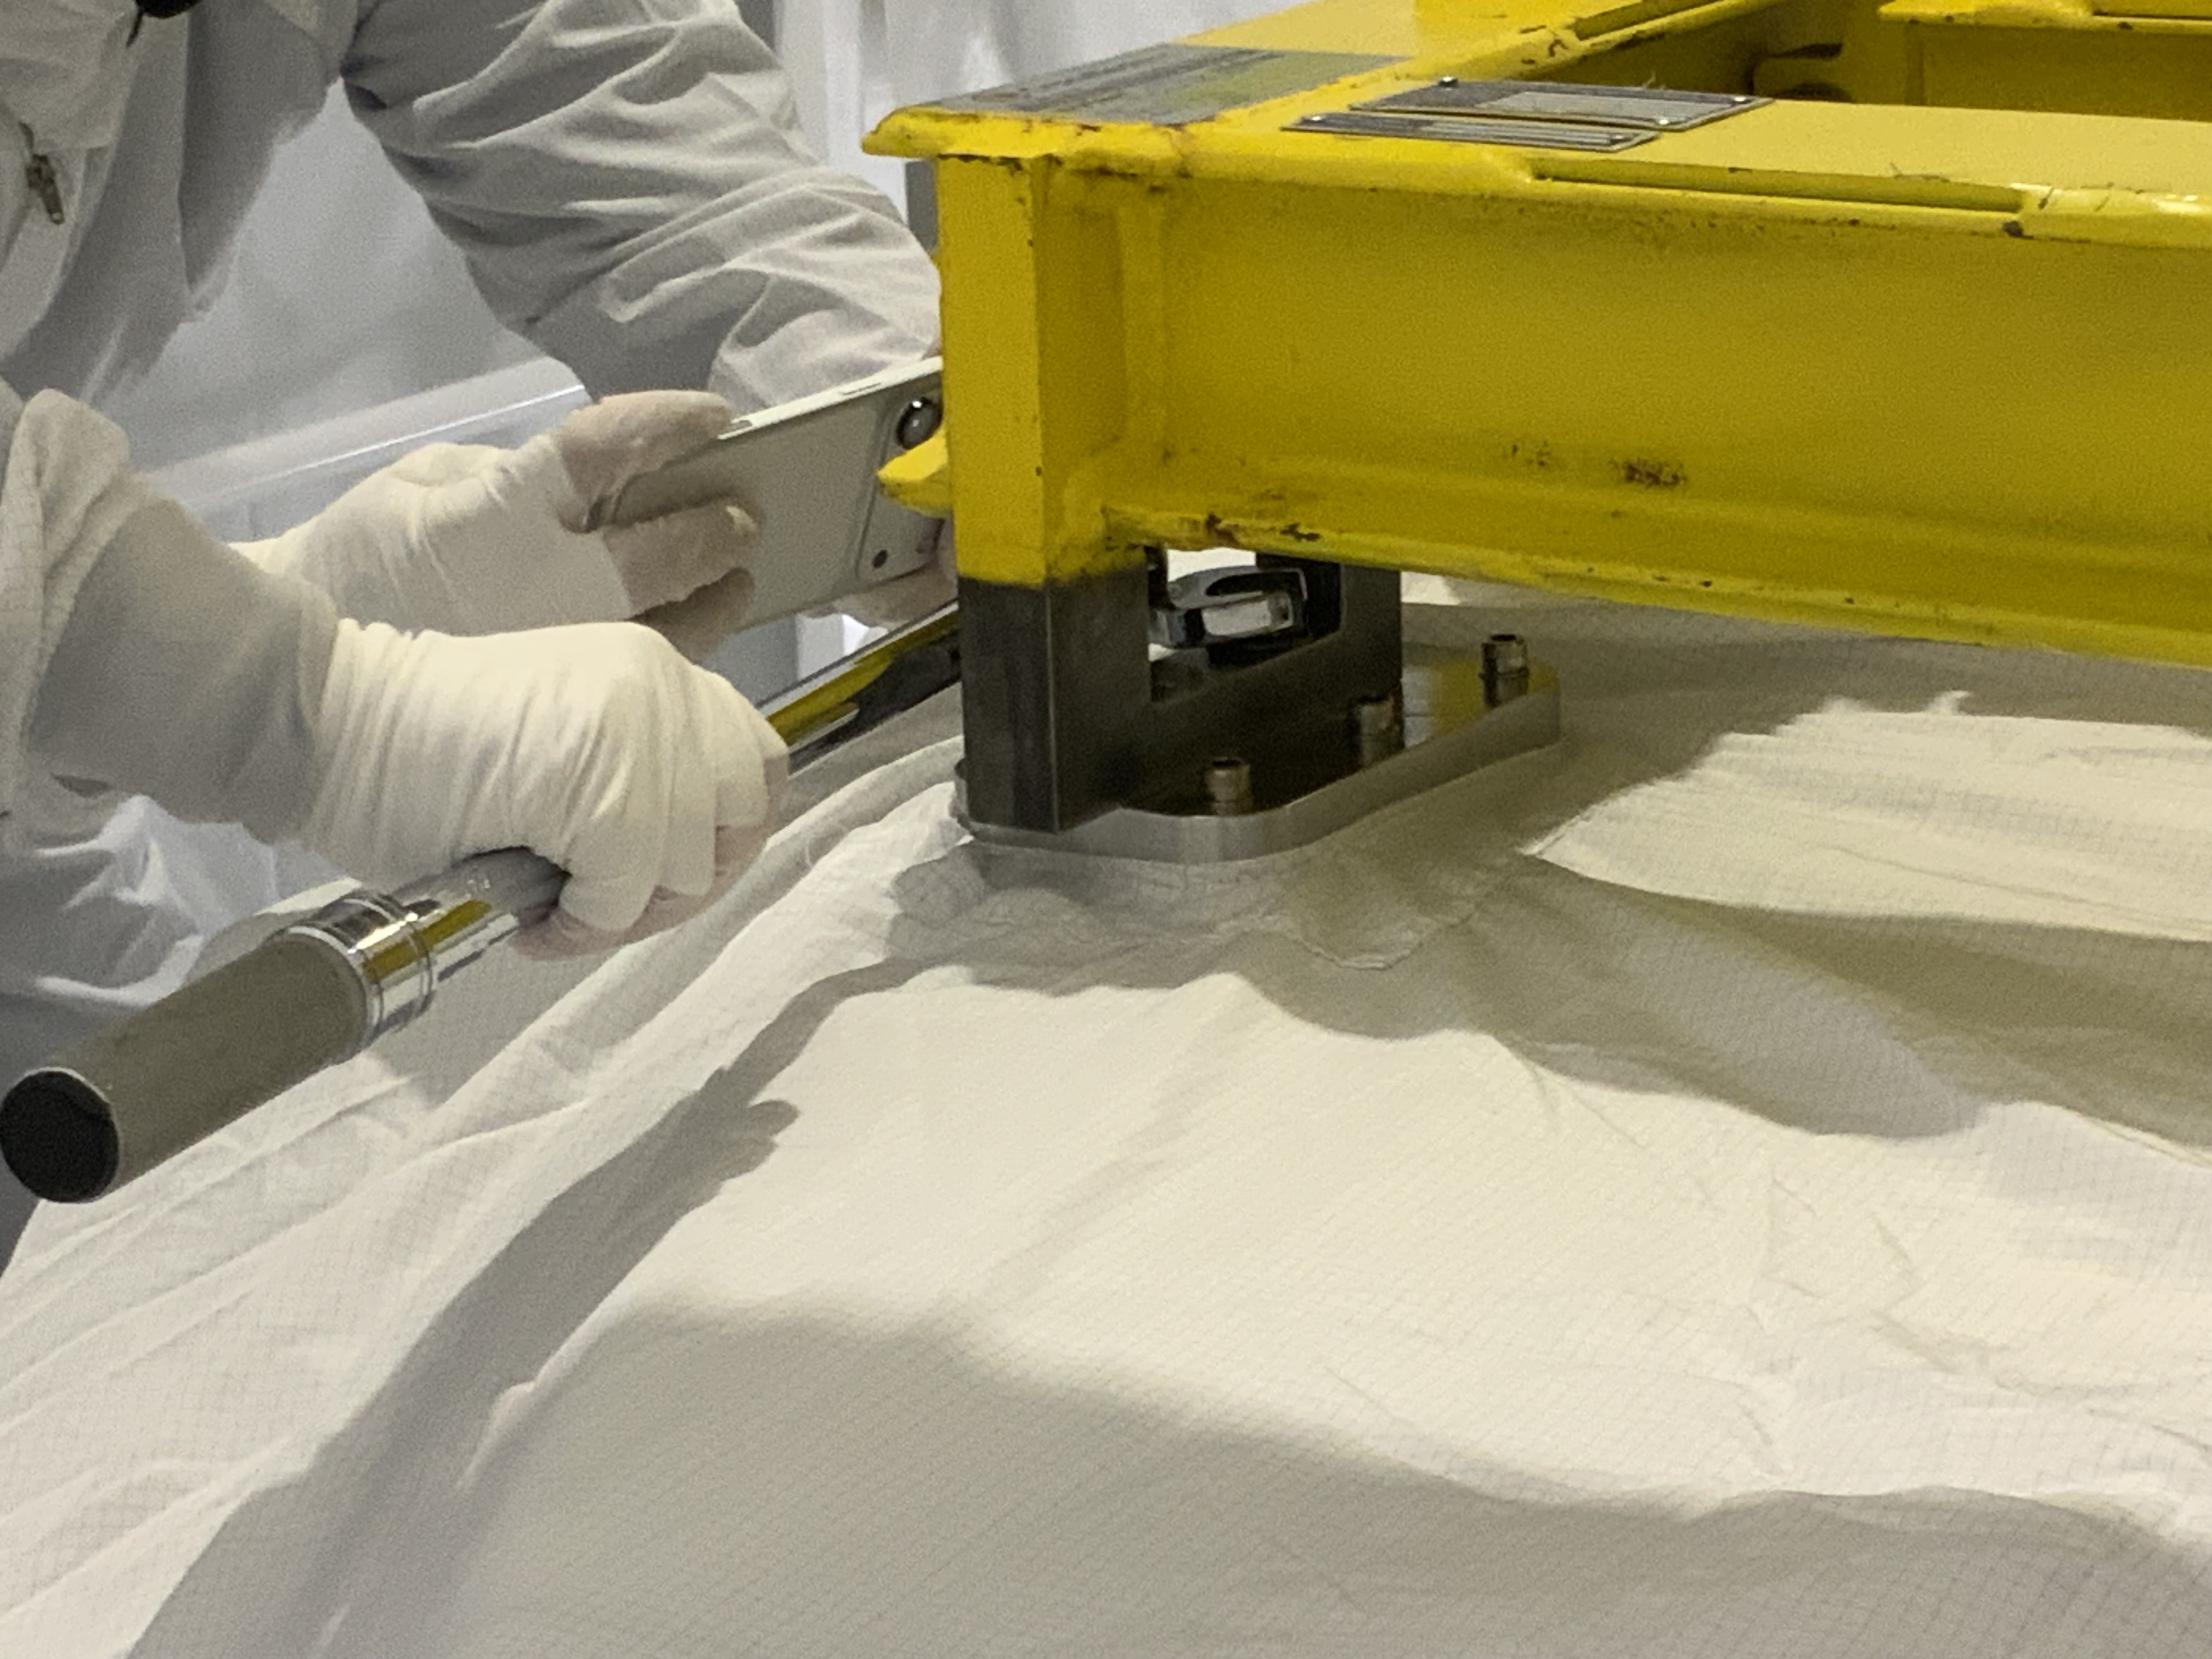
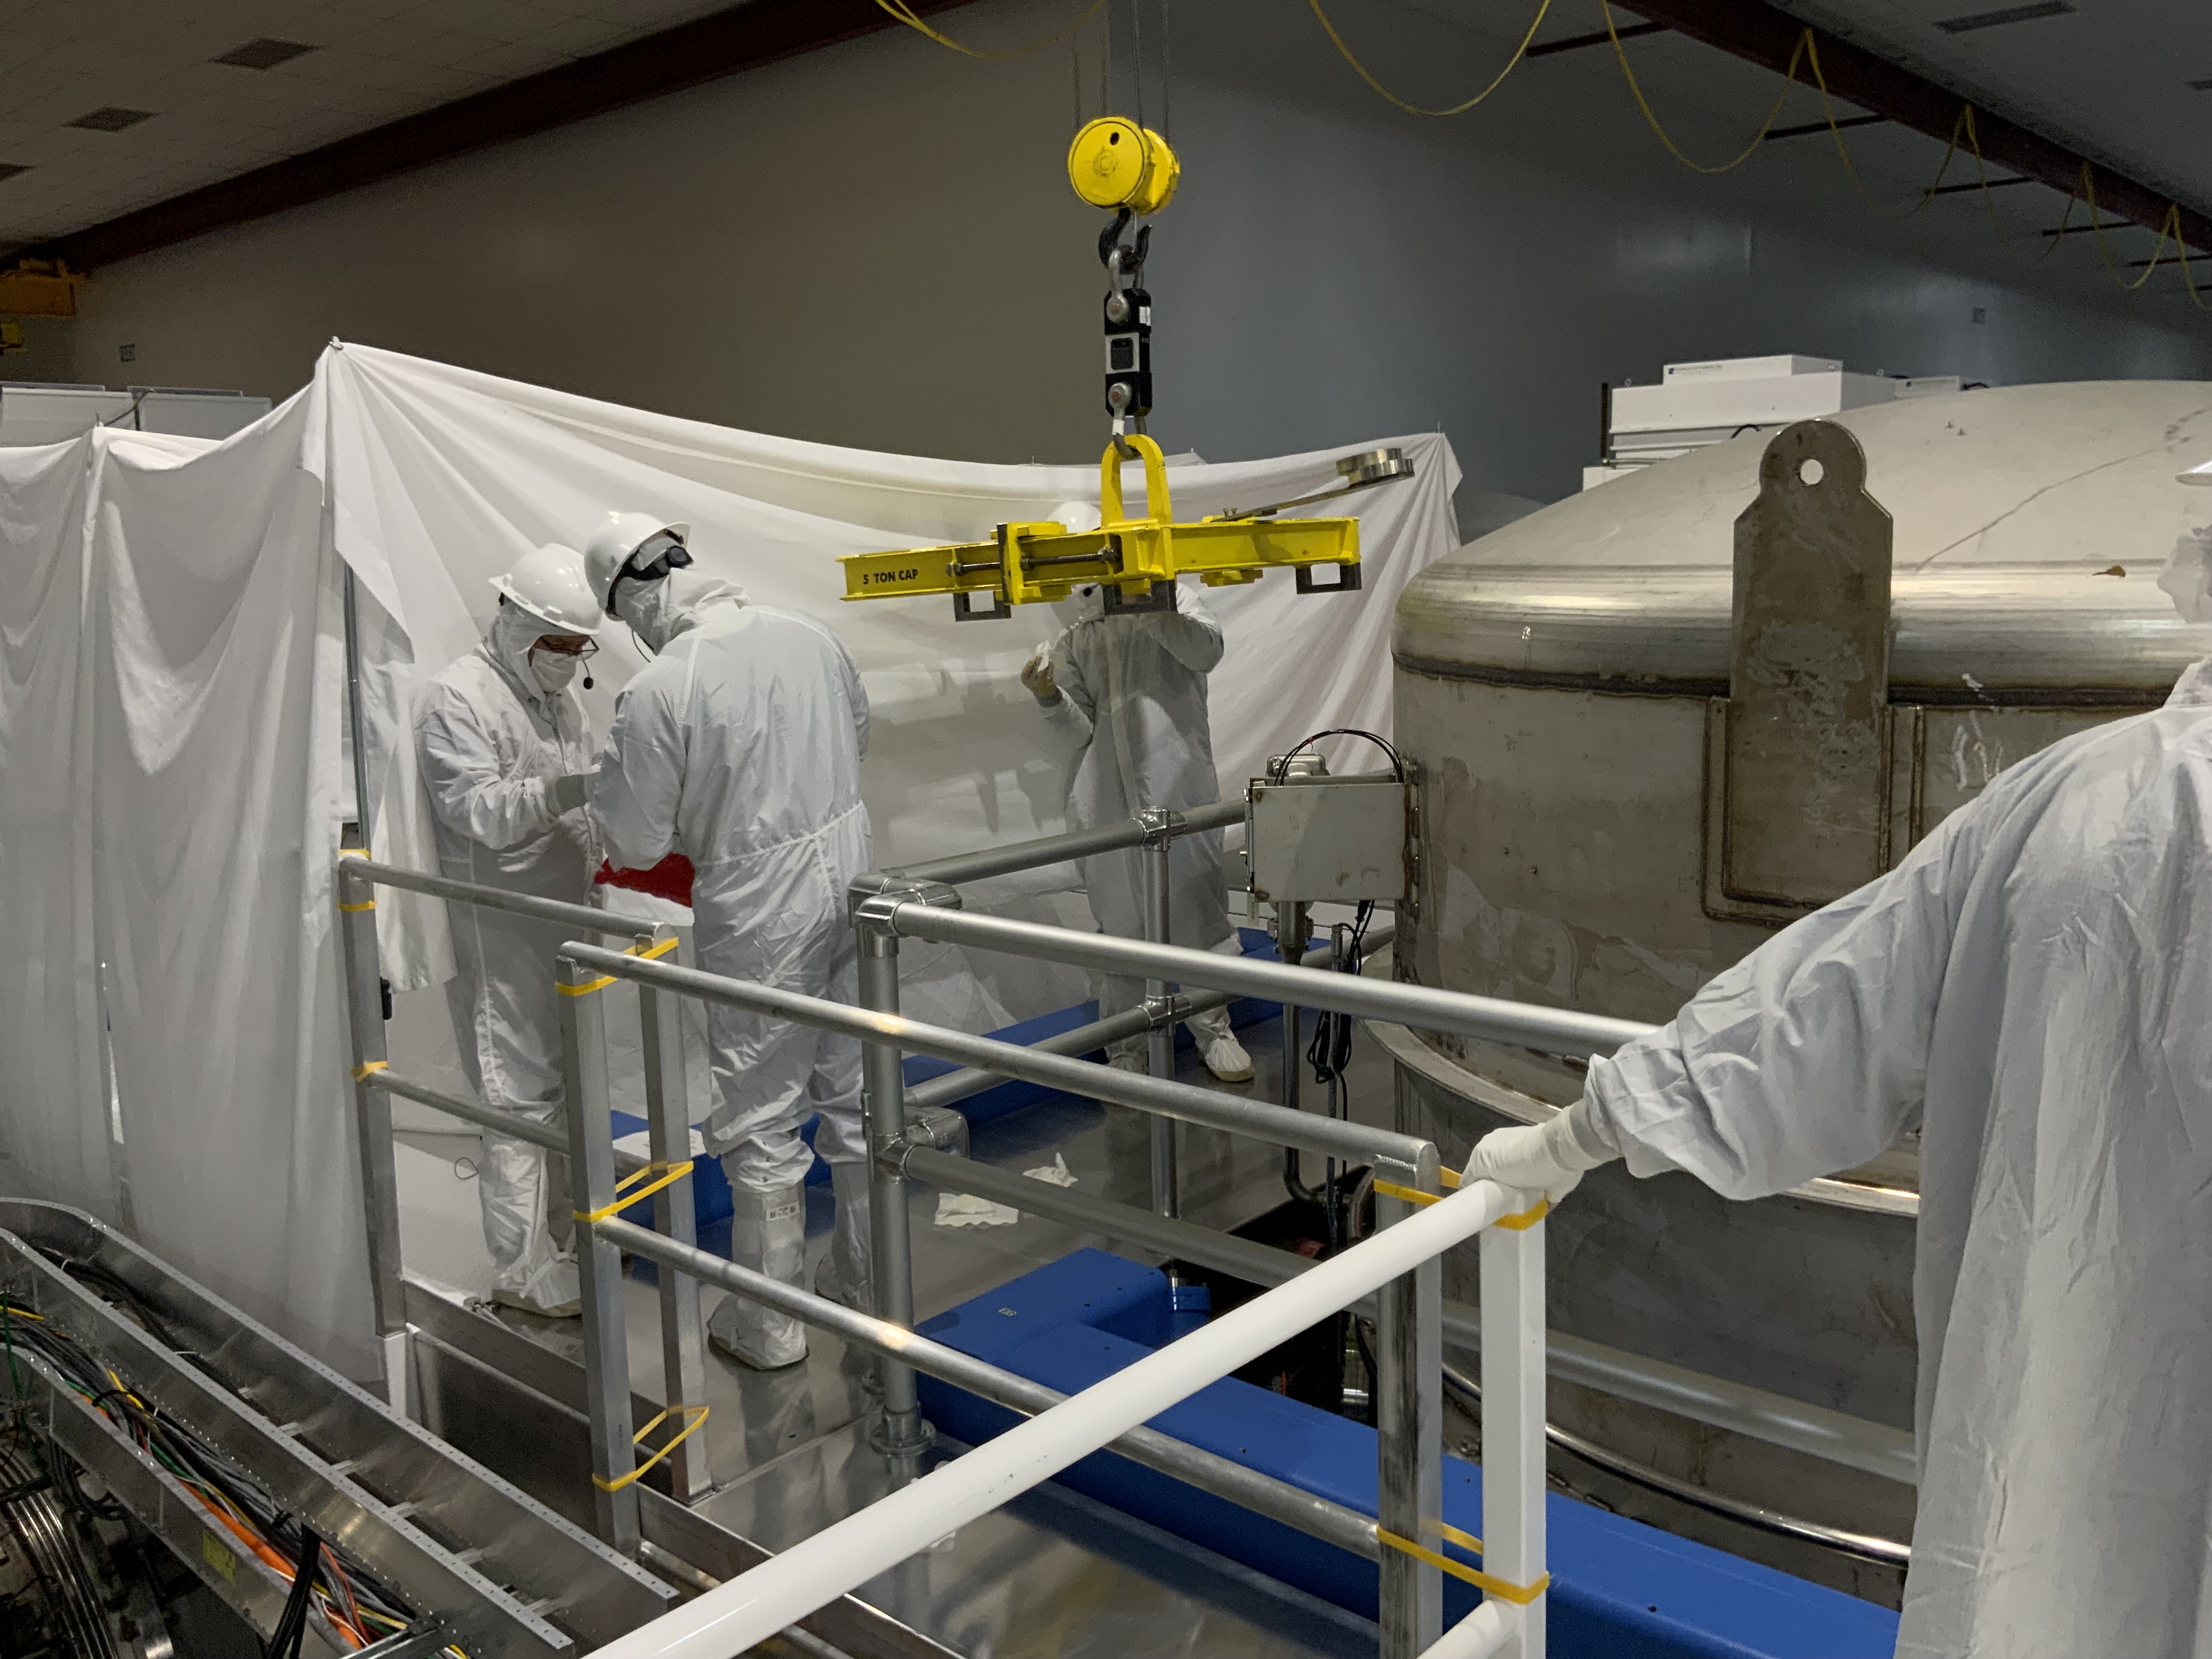
The BSC2 cartridge was removed from the BSC2 chamber today and placed on the Test Stand in the West Bay (+Y bay). The lift took 3 "test lifts" to make very minor adjustments to the CG prior to lift out of the chamber - on the 4th lift, we were very well balanced so embarked on the flight. Like LLO, the BS had it's "Stay Leg" assemblies and Vibration Absorber Assemblies removed for the flight. This means it was probably lighter than the 2013 time (alog 5689) when we did this which had the weight slightly heavier. The cartridge plus 3-point lift fixture and load cell together all weighed 9380 lbs. It was rotated 90deg Counterclockwise per the procedures and landed on the threaded rod in the test stand with little issue other than careful craning and spotting. All went as expected and according to the procedures E1200433-v3, E1200971-v4 and associated docs. Mitchell, Travis, Tyler, Randy (on crane) all up on the platform Jim and Tony inside of BSC2 Gerardo, Jordan on the eMod as Support TJ on the camera Betsy soaking it all in (support) A pre-lift meeting was held to go over the teams and maneuver details (again) at 9am prior to work starting. Particle counts up at the dome level were all 0,0 before starting. More photos and videos will be posted when those folks have them available. Covers used - A BS/QUAD SUS tube cover up underneath, an ISI cover up on the ISI, the BSC Cartridge sock which encased the whole thing, dropped down to Jim and Tony once the lift was up a couple feet. The bulk of the work was from ~10:30am-1pm. Most of the time before was getting folks in headsets and gear and getting equipment on.
Going over the details during the 9am pre-lift meeting. Congratulations, all, on a smooth operation!
More photos posted at alog 90103.
tagging for photos.
Jennie W, Sheila, Elenna
In order to get data for mode-matching and for Elenna to get data to calibrate sideband heights we ran some mode scans after the SR3 heater was turned on last night.
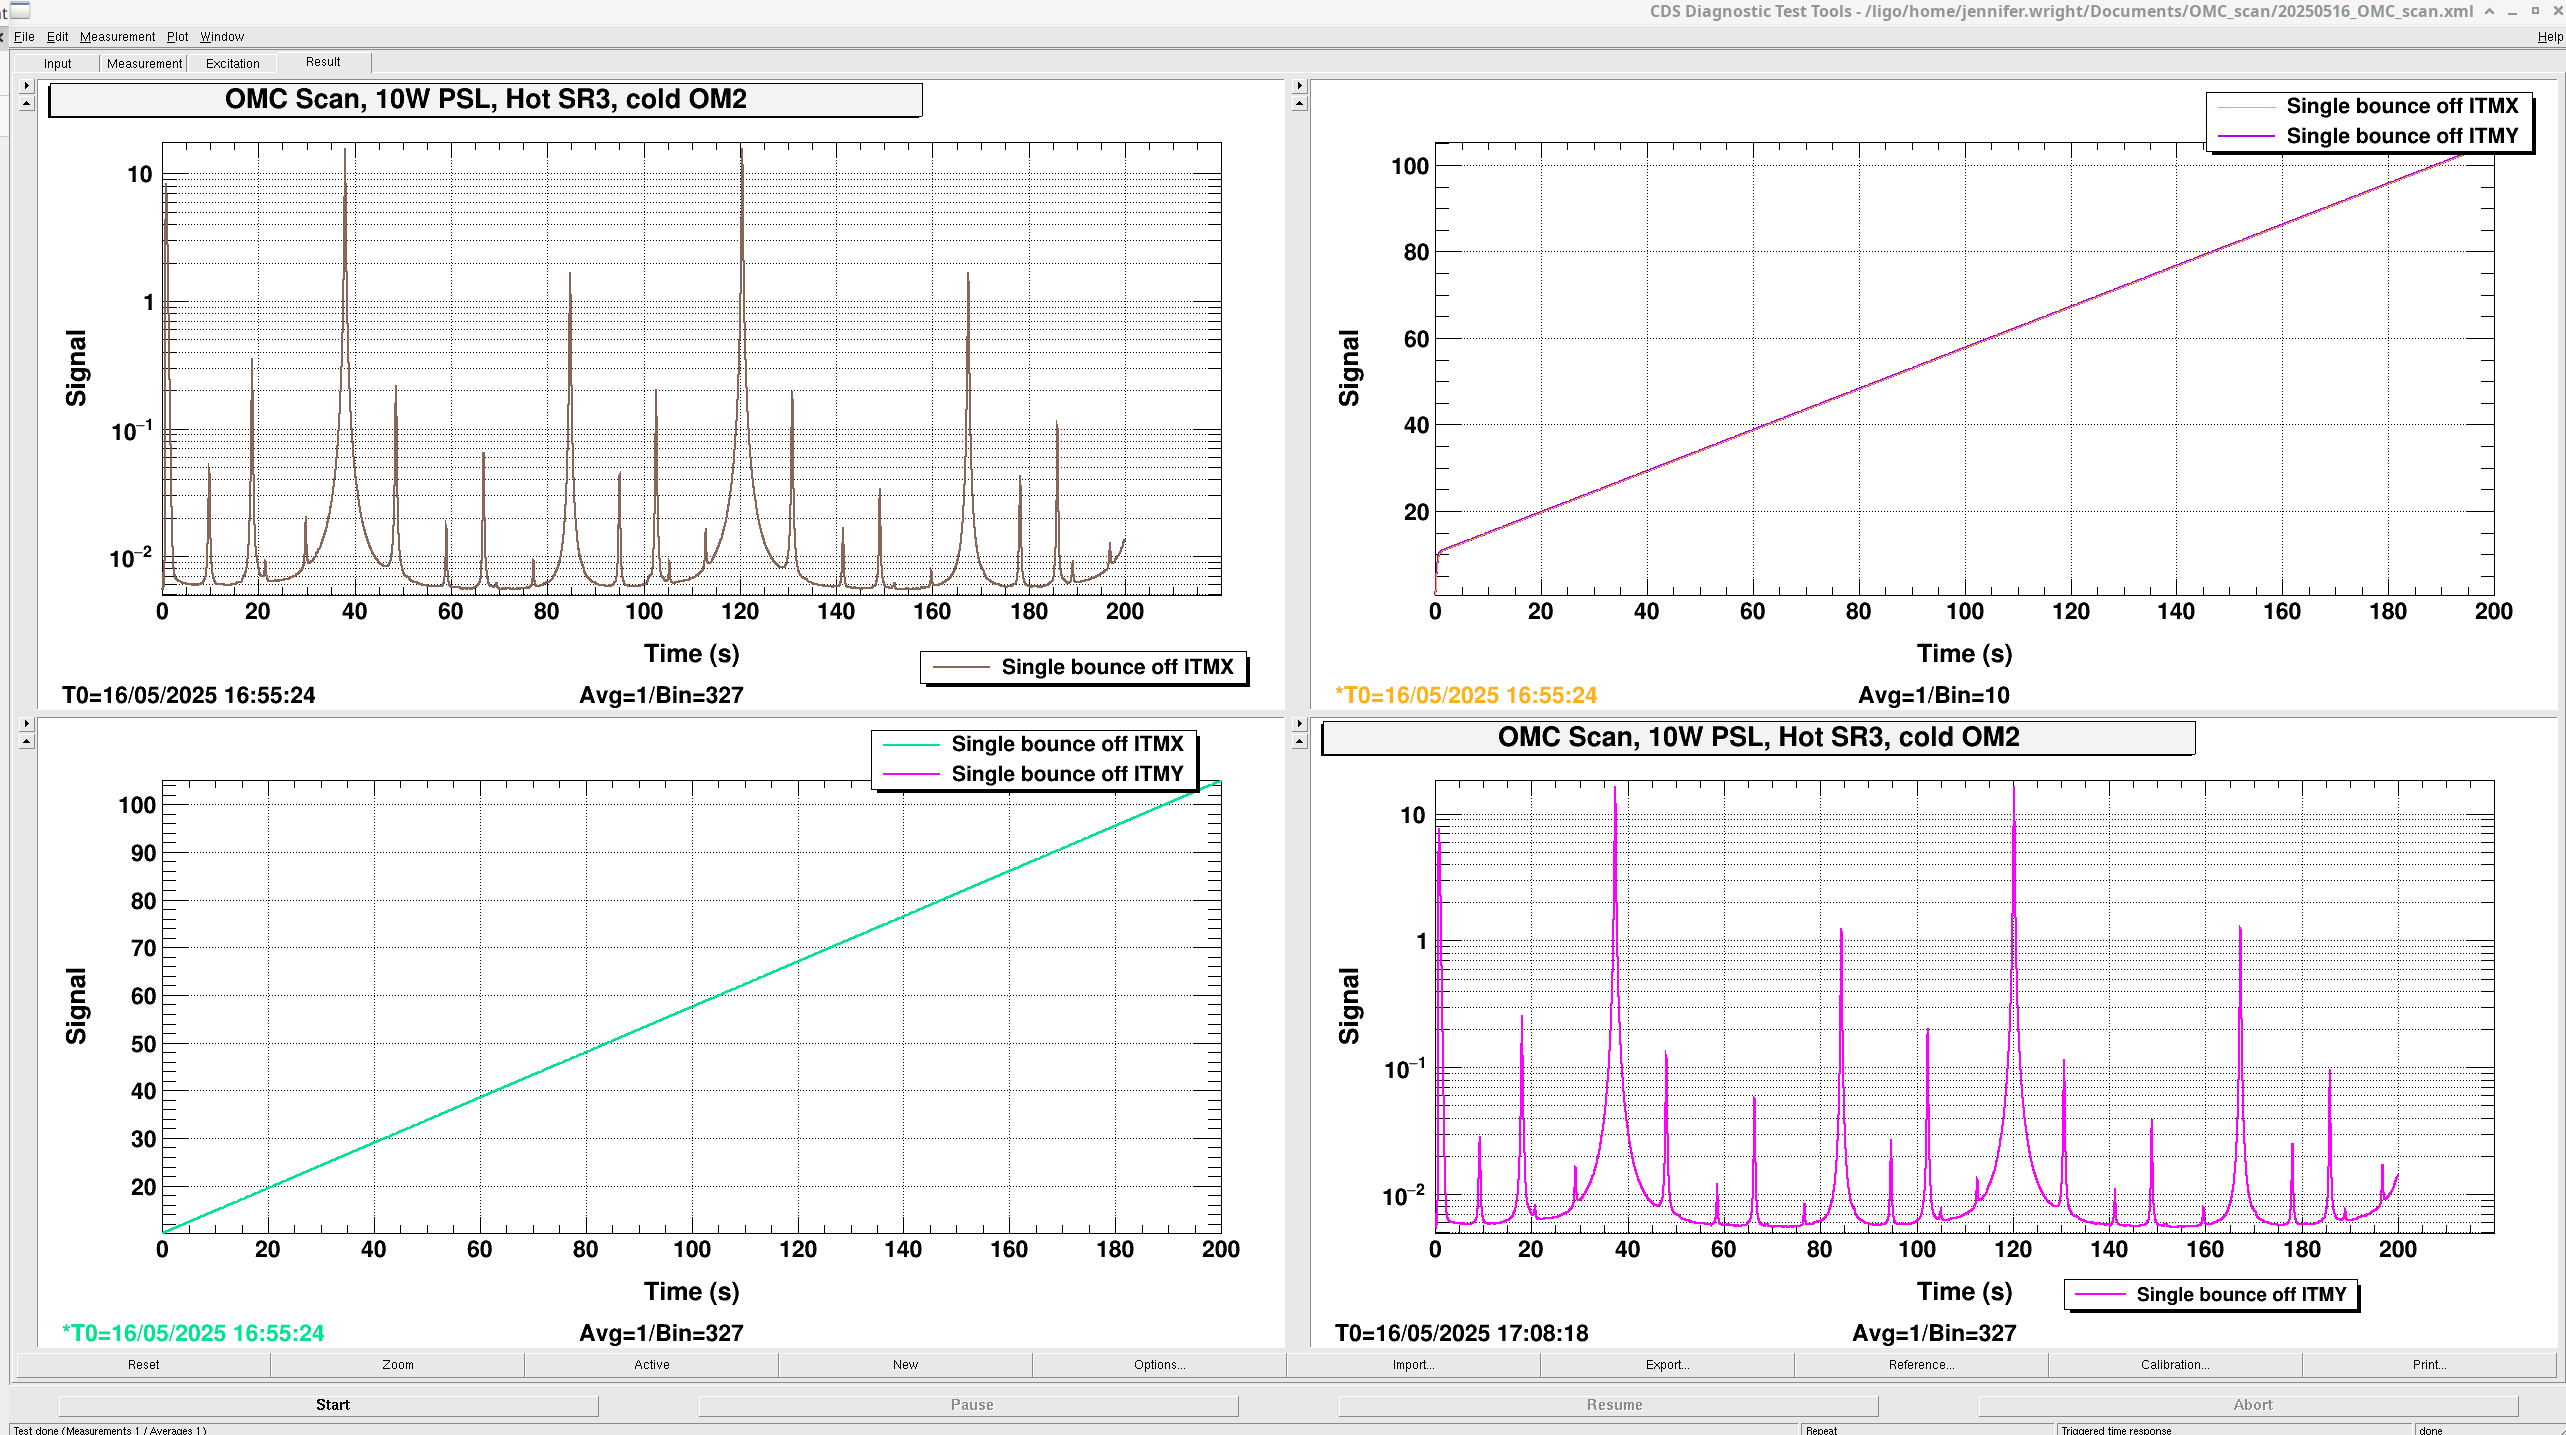
16:55:24 UTC Carried out single bounce OMC scan at 10W PSL input with sensor correction on HAM6 on, high voltage on for PZT driver in HAM6, sidebands off , SRM mis-aligned, ITMY mis-aligned, DC 3 and 4 on, OMC ASC on.
Excitation freq changed to 0.005 Hz as the top peak of the TM00 mode looked squint so could have been saturating. Lowering this frequency prevented this.
Ref 15-17 corresponds to dcpd data, pzt exc signal, pzt2 dc monitor.
Then mis-aligned ITMX and aligned ITMY (Sheila had to re-align SR2 to centre on ASC-AS_C).
Measurement starts at 17:08:18 UTC.
Ref 18-20 corresponds to dcpd data, pzt exc signal, pzt2 dc monitor.
Traces saved in 20250516_OMC_scan.xml. The top left plot is the first scan bouncing beam off ITMX, the second scan is the bottom right bouncing off ITMY.
The top right is the two plots of the PZT2 DC voltage monitor. That is, the current voltage applied to the PZT. The bottom left is the plot of the voltage ramp applied to the PZT2 on the OMC for this measurement.
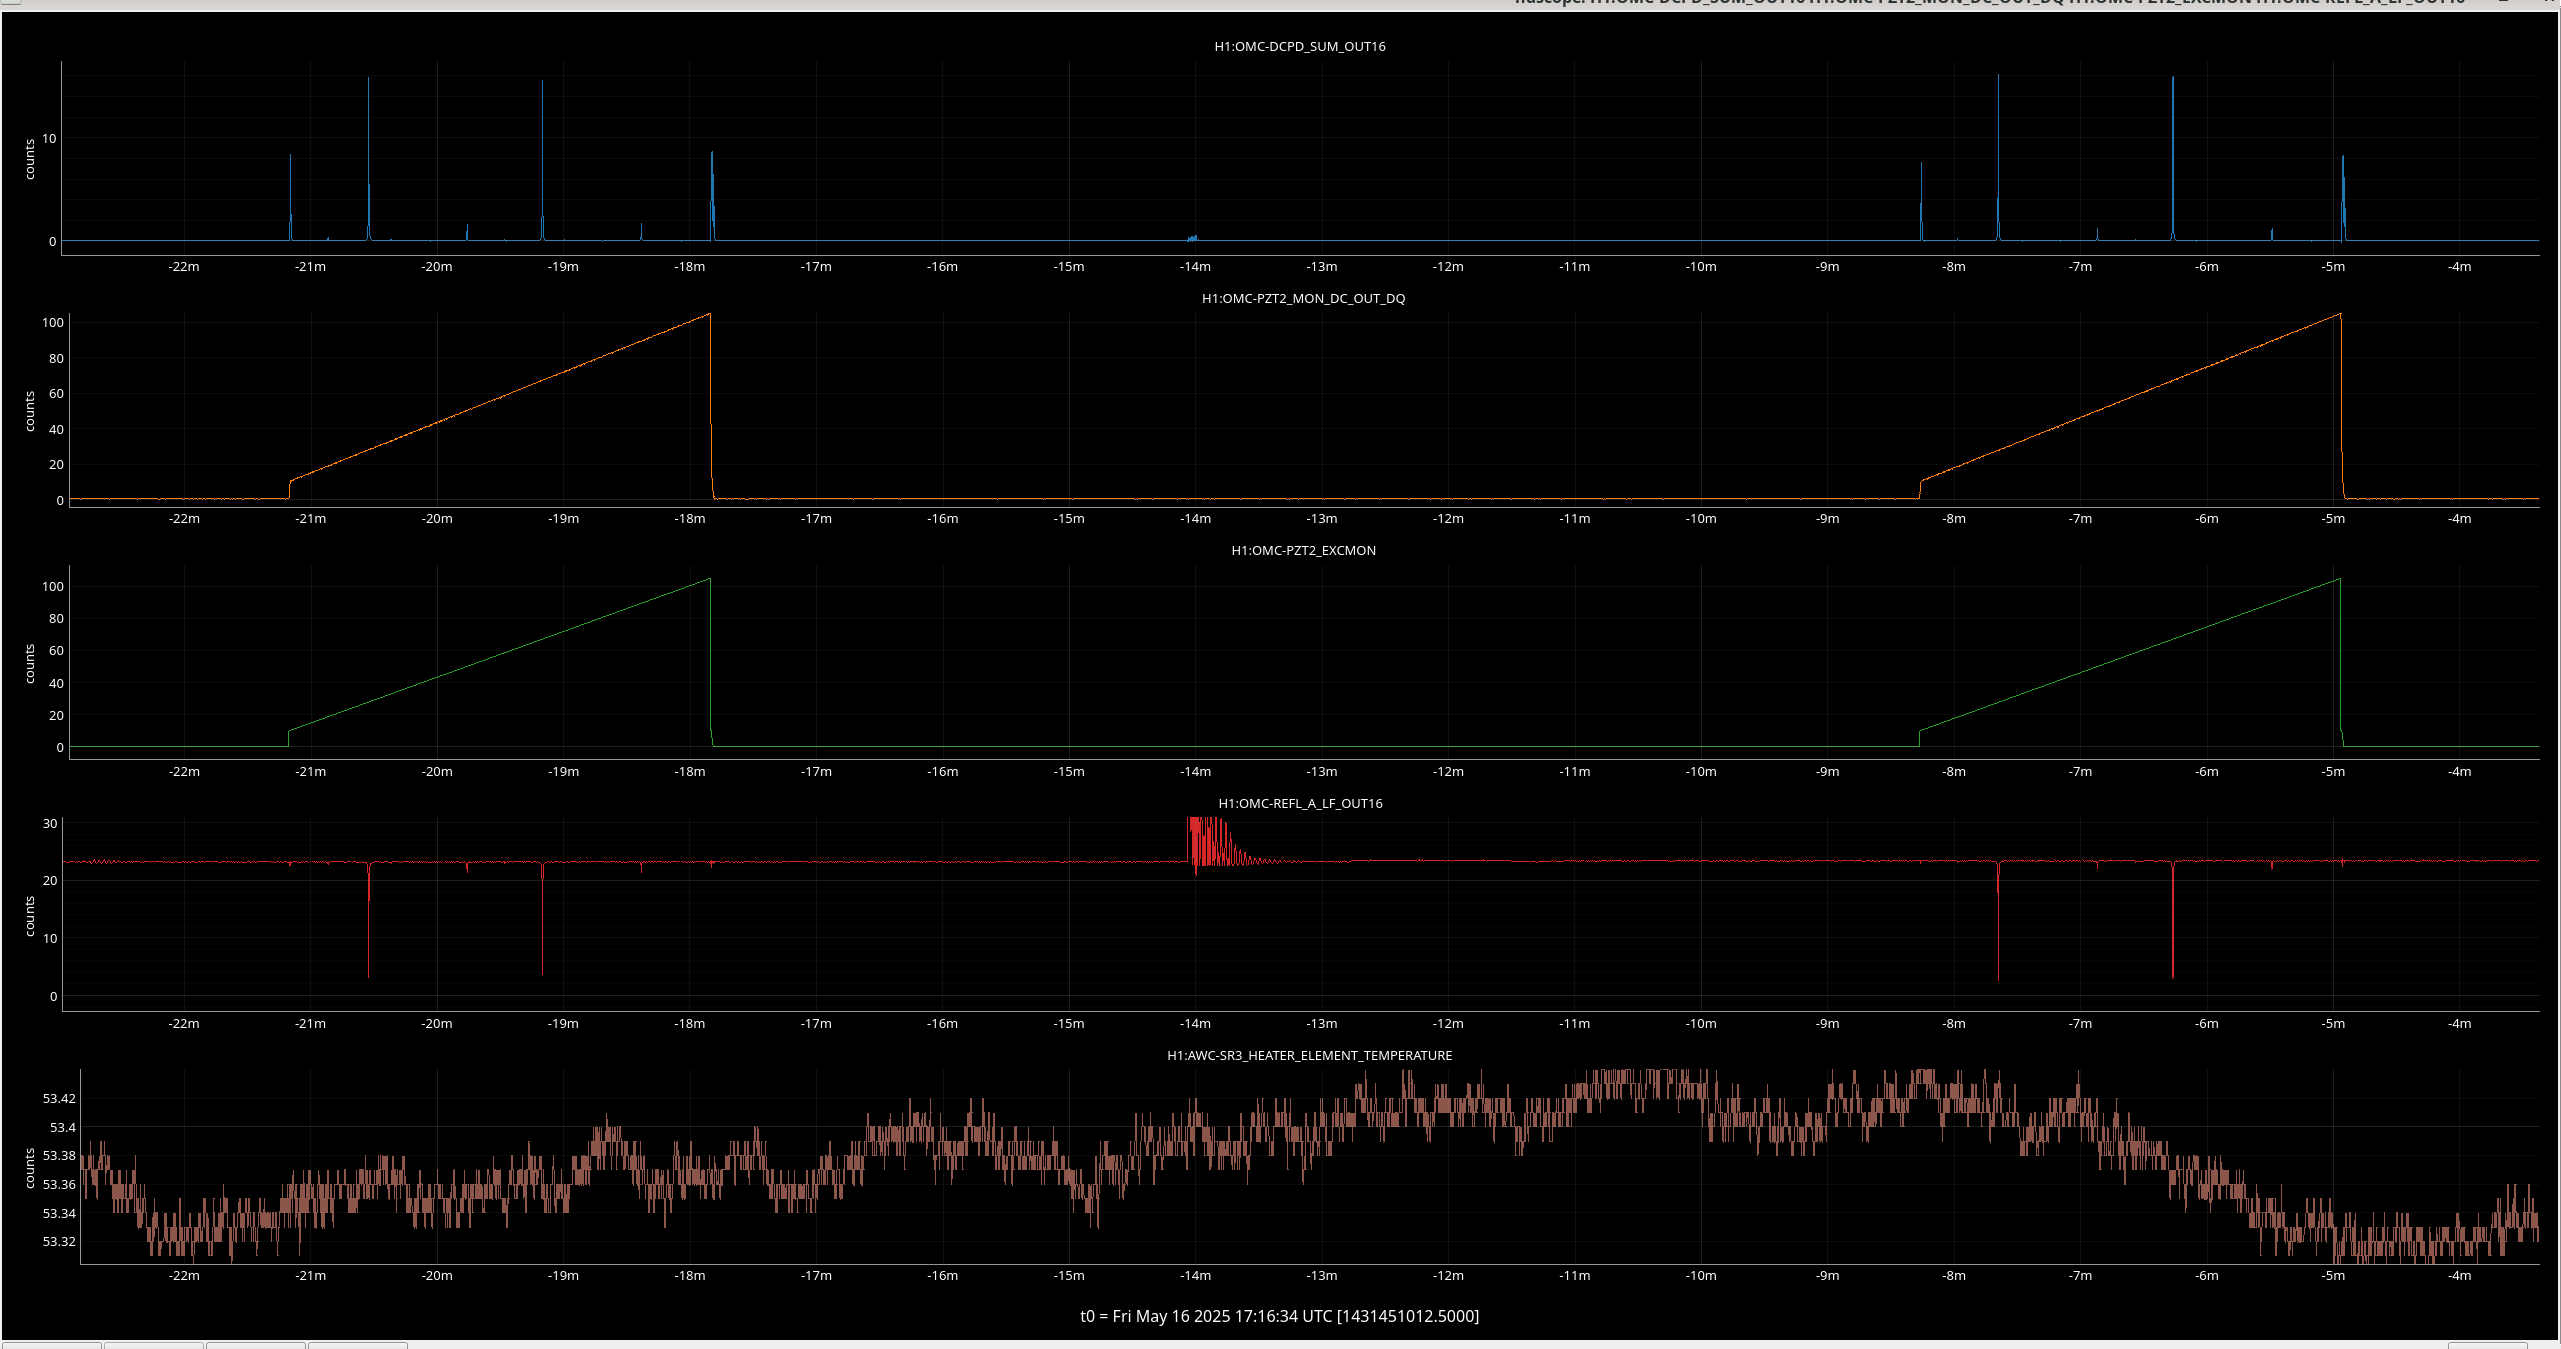
The ndscope attached shows the power in mA transmitted through the OMC on the top, then the PZT used for the scan DC voltage underneath, then the input PZT voltage underneath that, then the reflected power from the OMC in mW, then at the bottom the SR3 heater element temperature in degrees.
Elenna did two more scans in single bounce with sidebands back on and different modulations depths in each.
See Elenna's comment on her previous measurement where this saturation happened.
Turn off the sidebands - instructions in this alog.
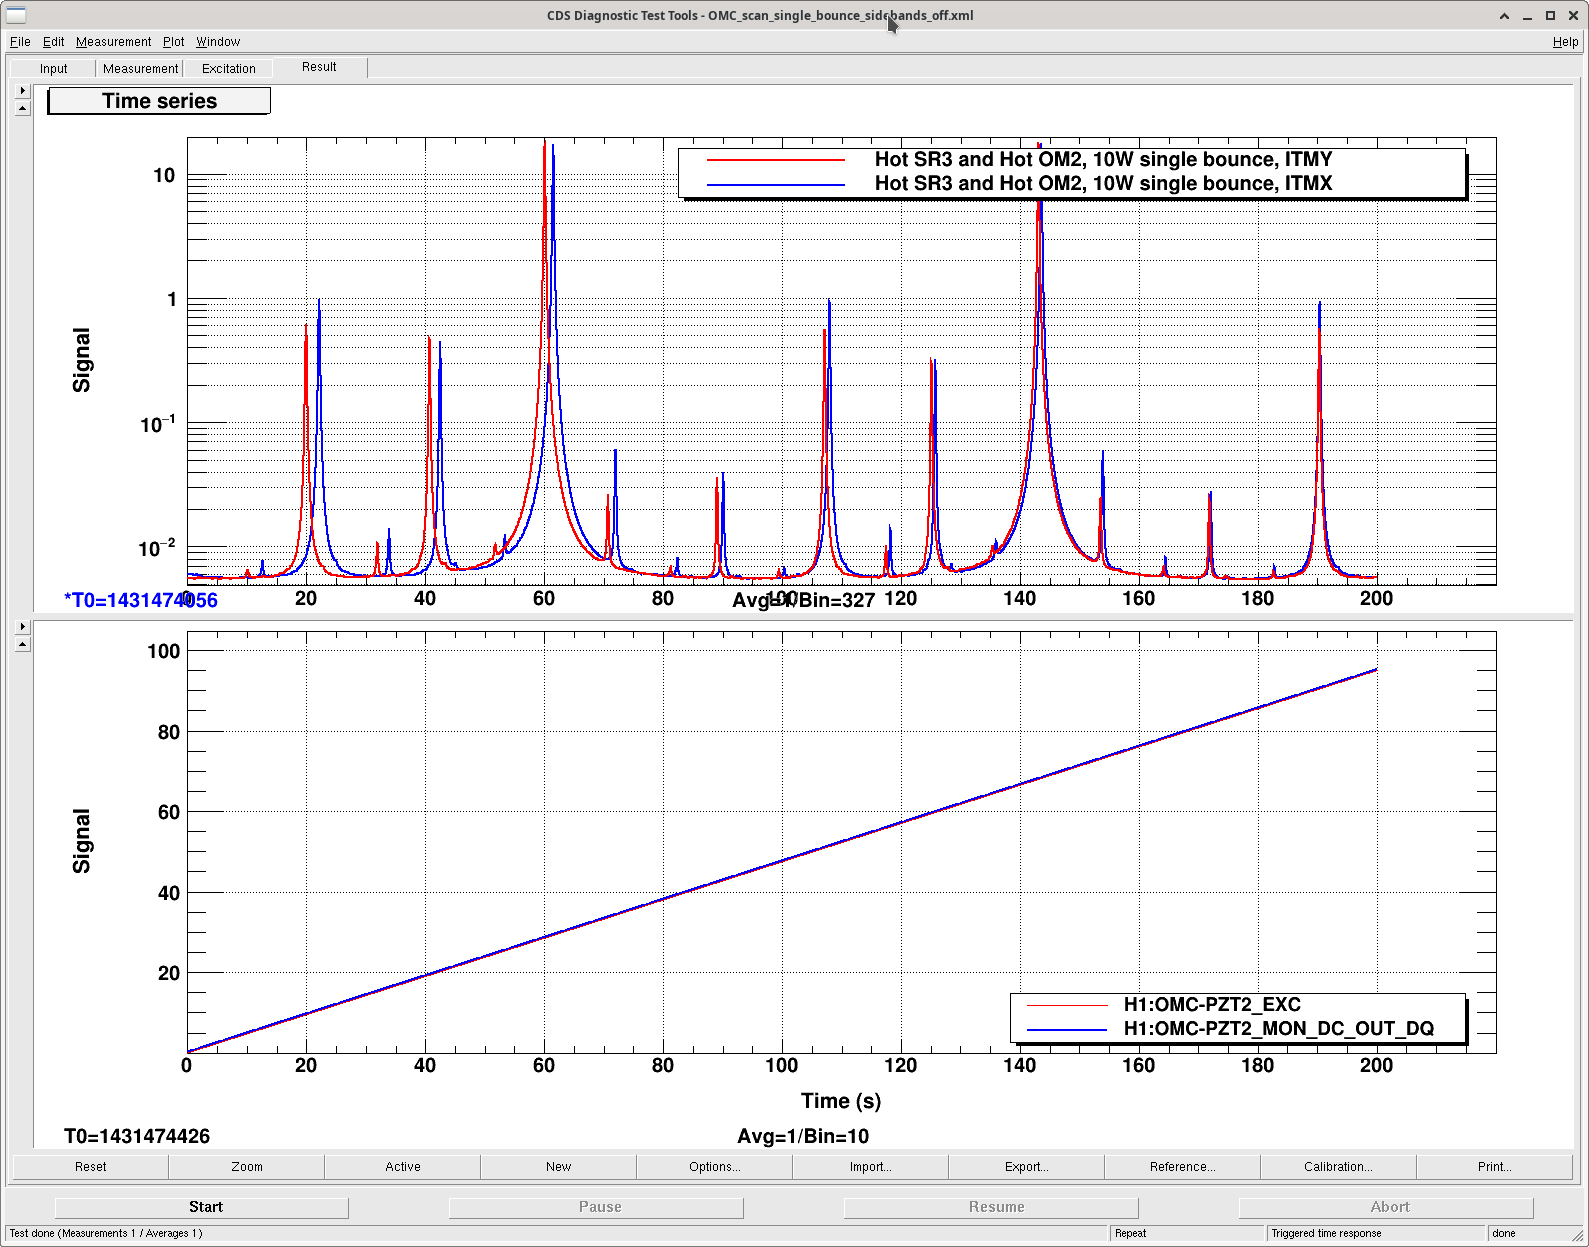
Sheila and I ran one more OMC scan with sidebands off after OM2 heated up. Attached is the screenshot with scans off both ITMX and ITMY, data is saved in [userapp]/omc/h1/templates/OMC_scan_single_bounce_sidebands_off.xml
I also ran two OMC scans, single bounce off ITMY, 10 W input, with the sidebands ON. One measurement I ran with the sidebands set to 23 dBm and 27 dBm (9 and 45 MHz) and another set to 20 dBm and 21 dBm (9 and 45 MHz). I will use these measurements to calibrate the modulation depth. Data saved in /opt/rtcds/userapps/release/omc/h1/templates/OMC_scan_single_bounce_RF_cal.xml
SR3 heater was on for this measurement but it should have little effect on my results.
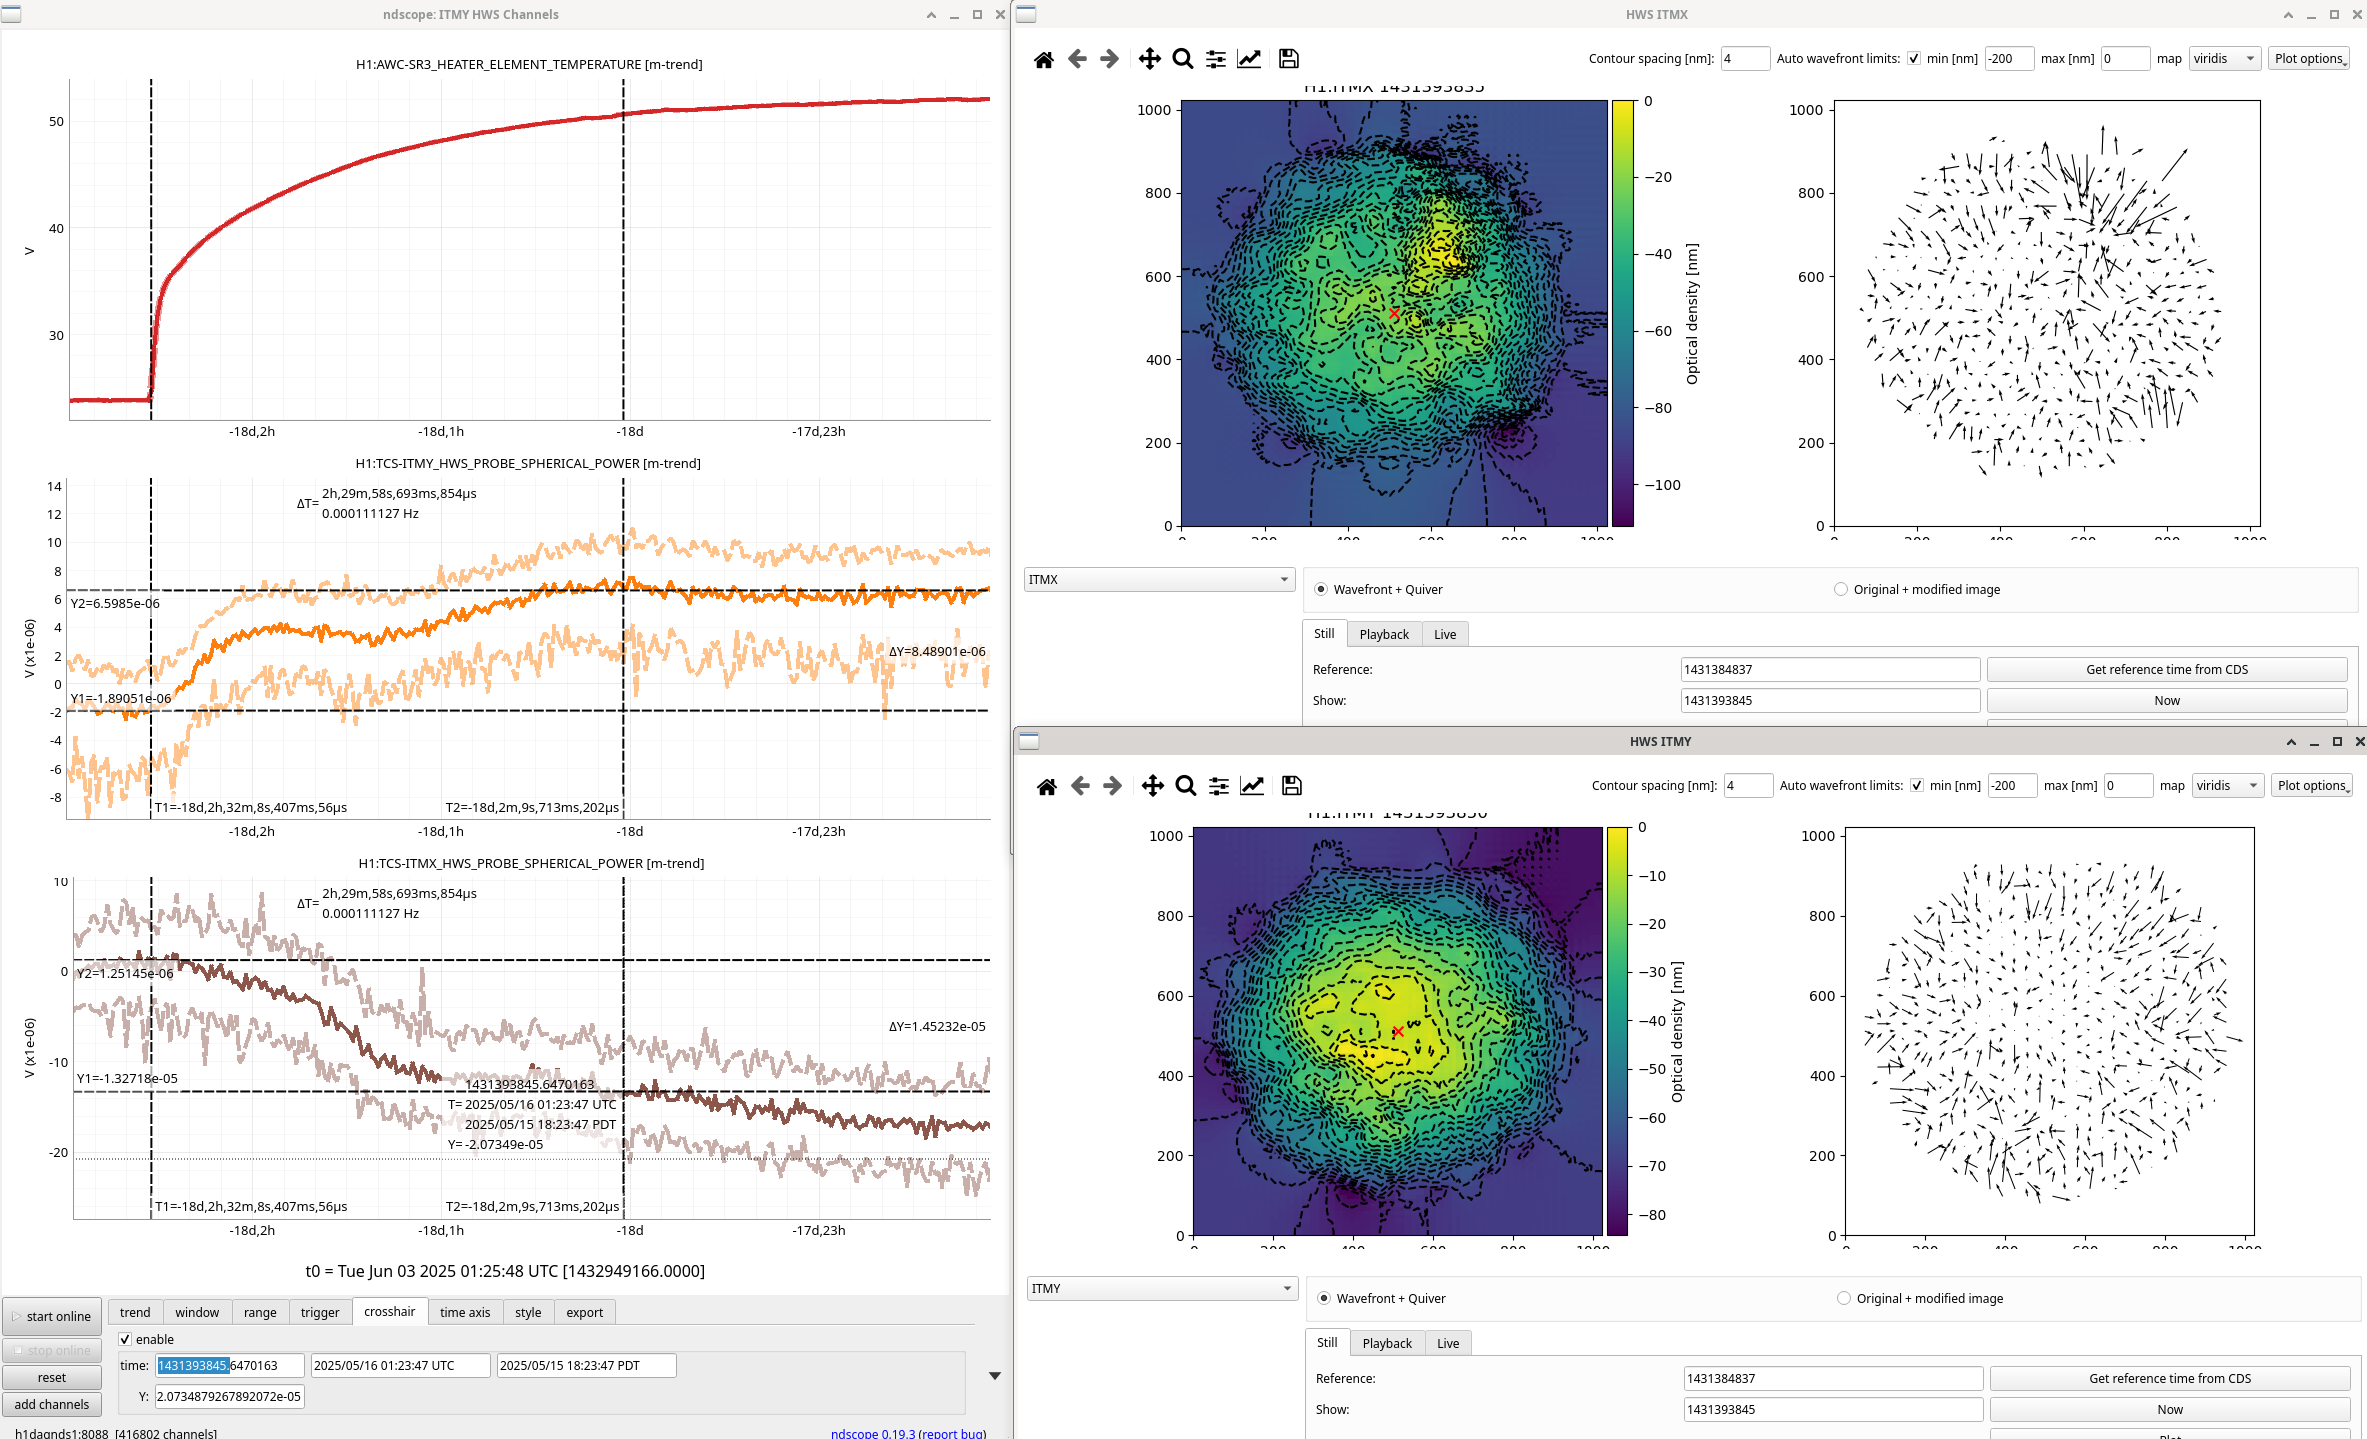
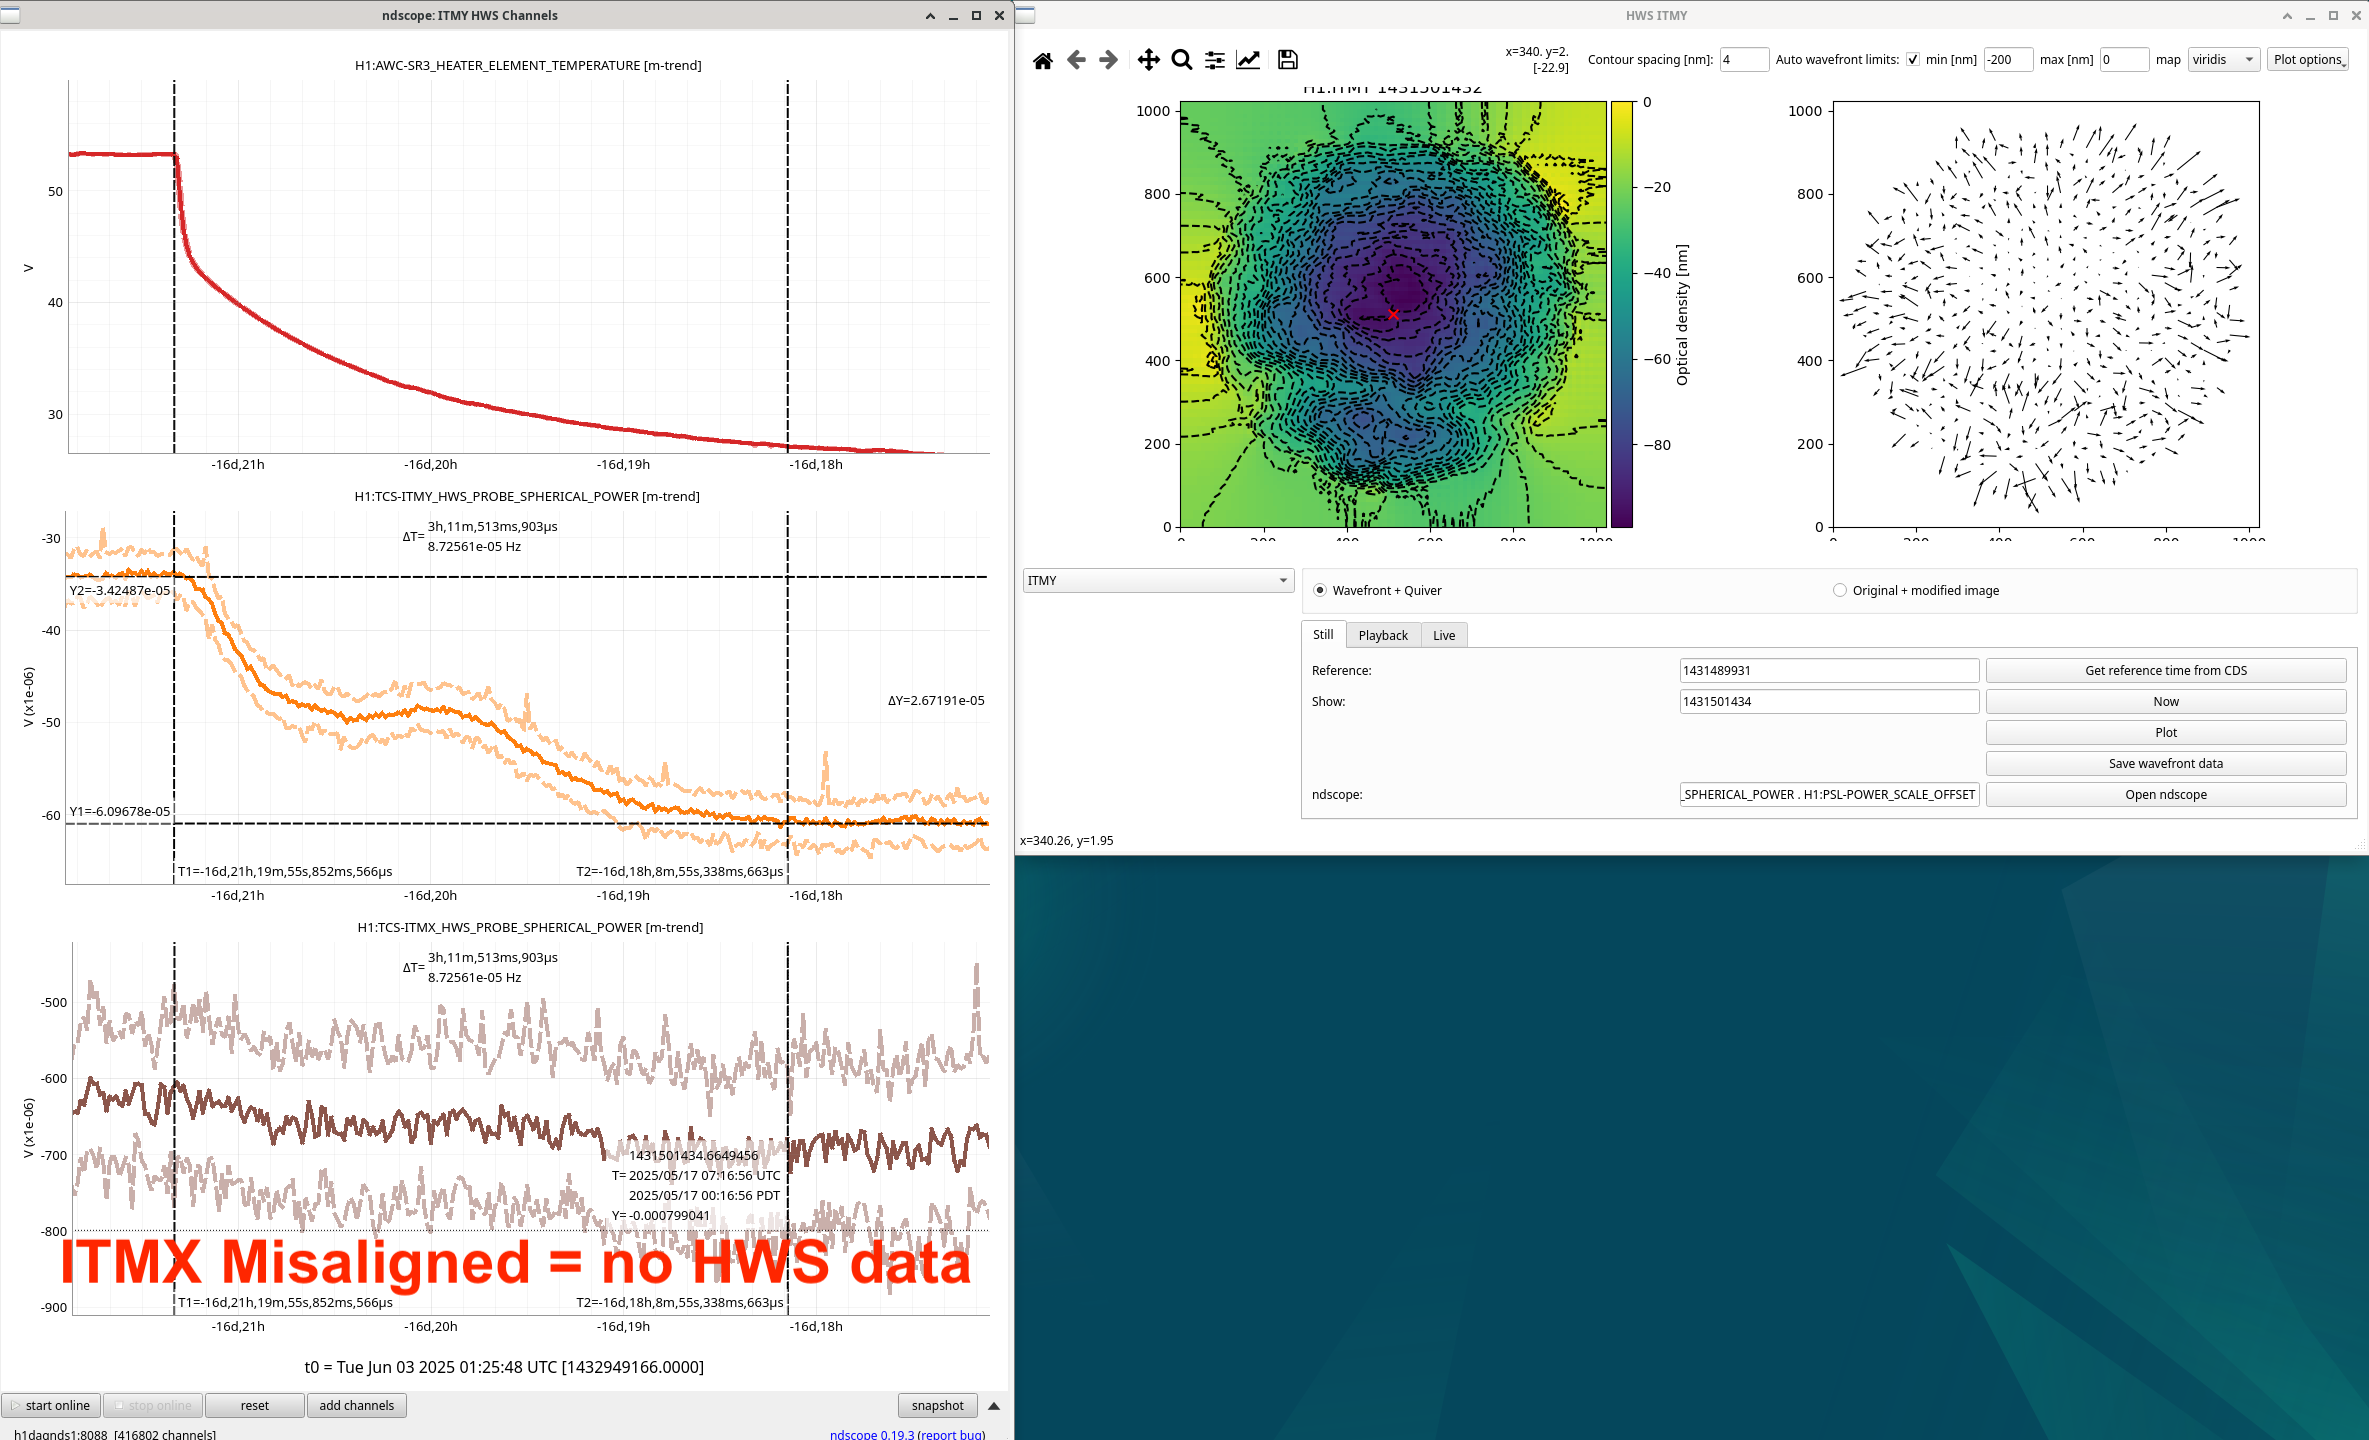
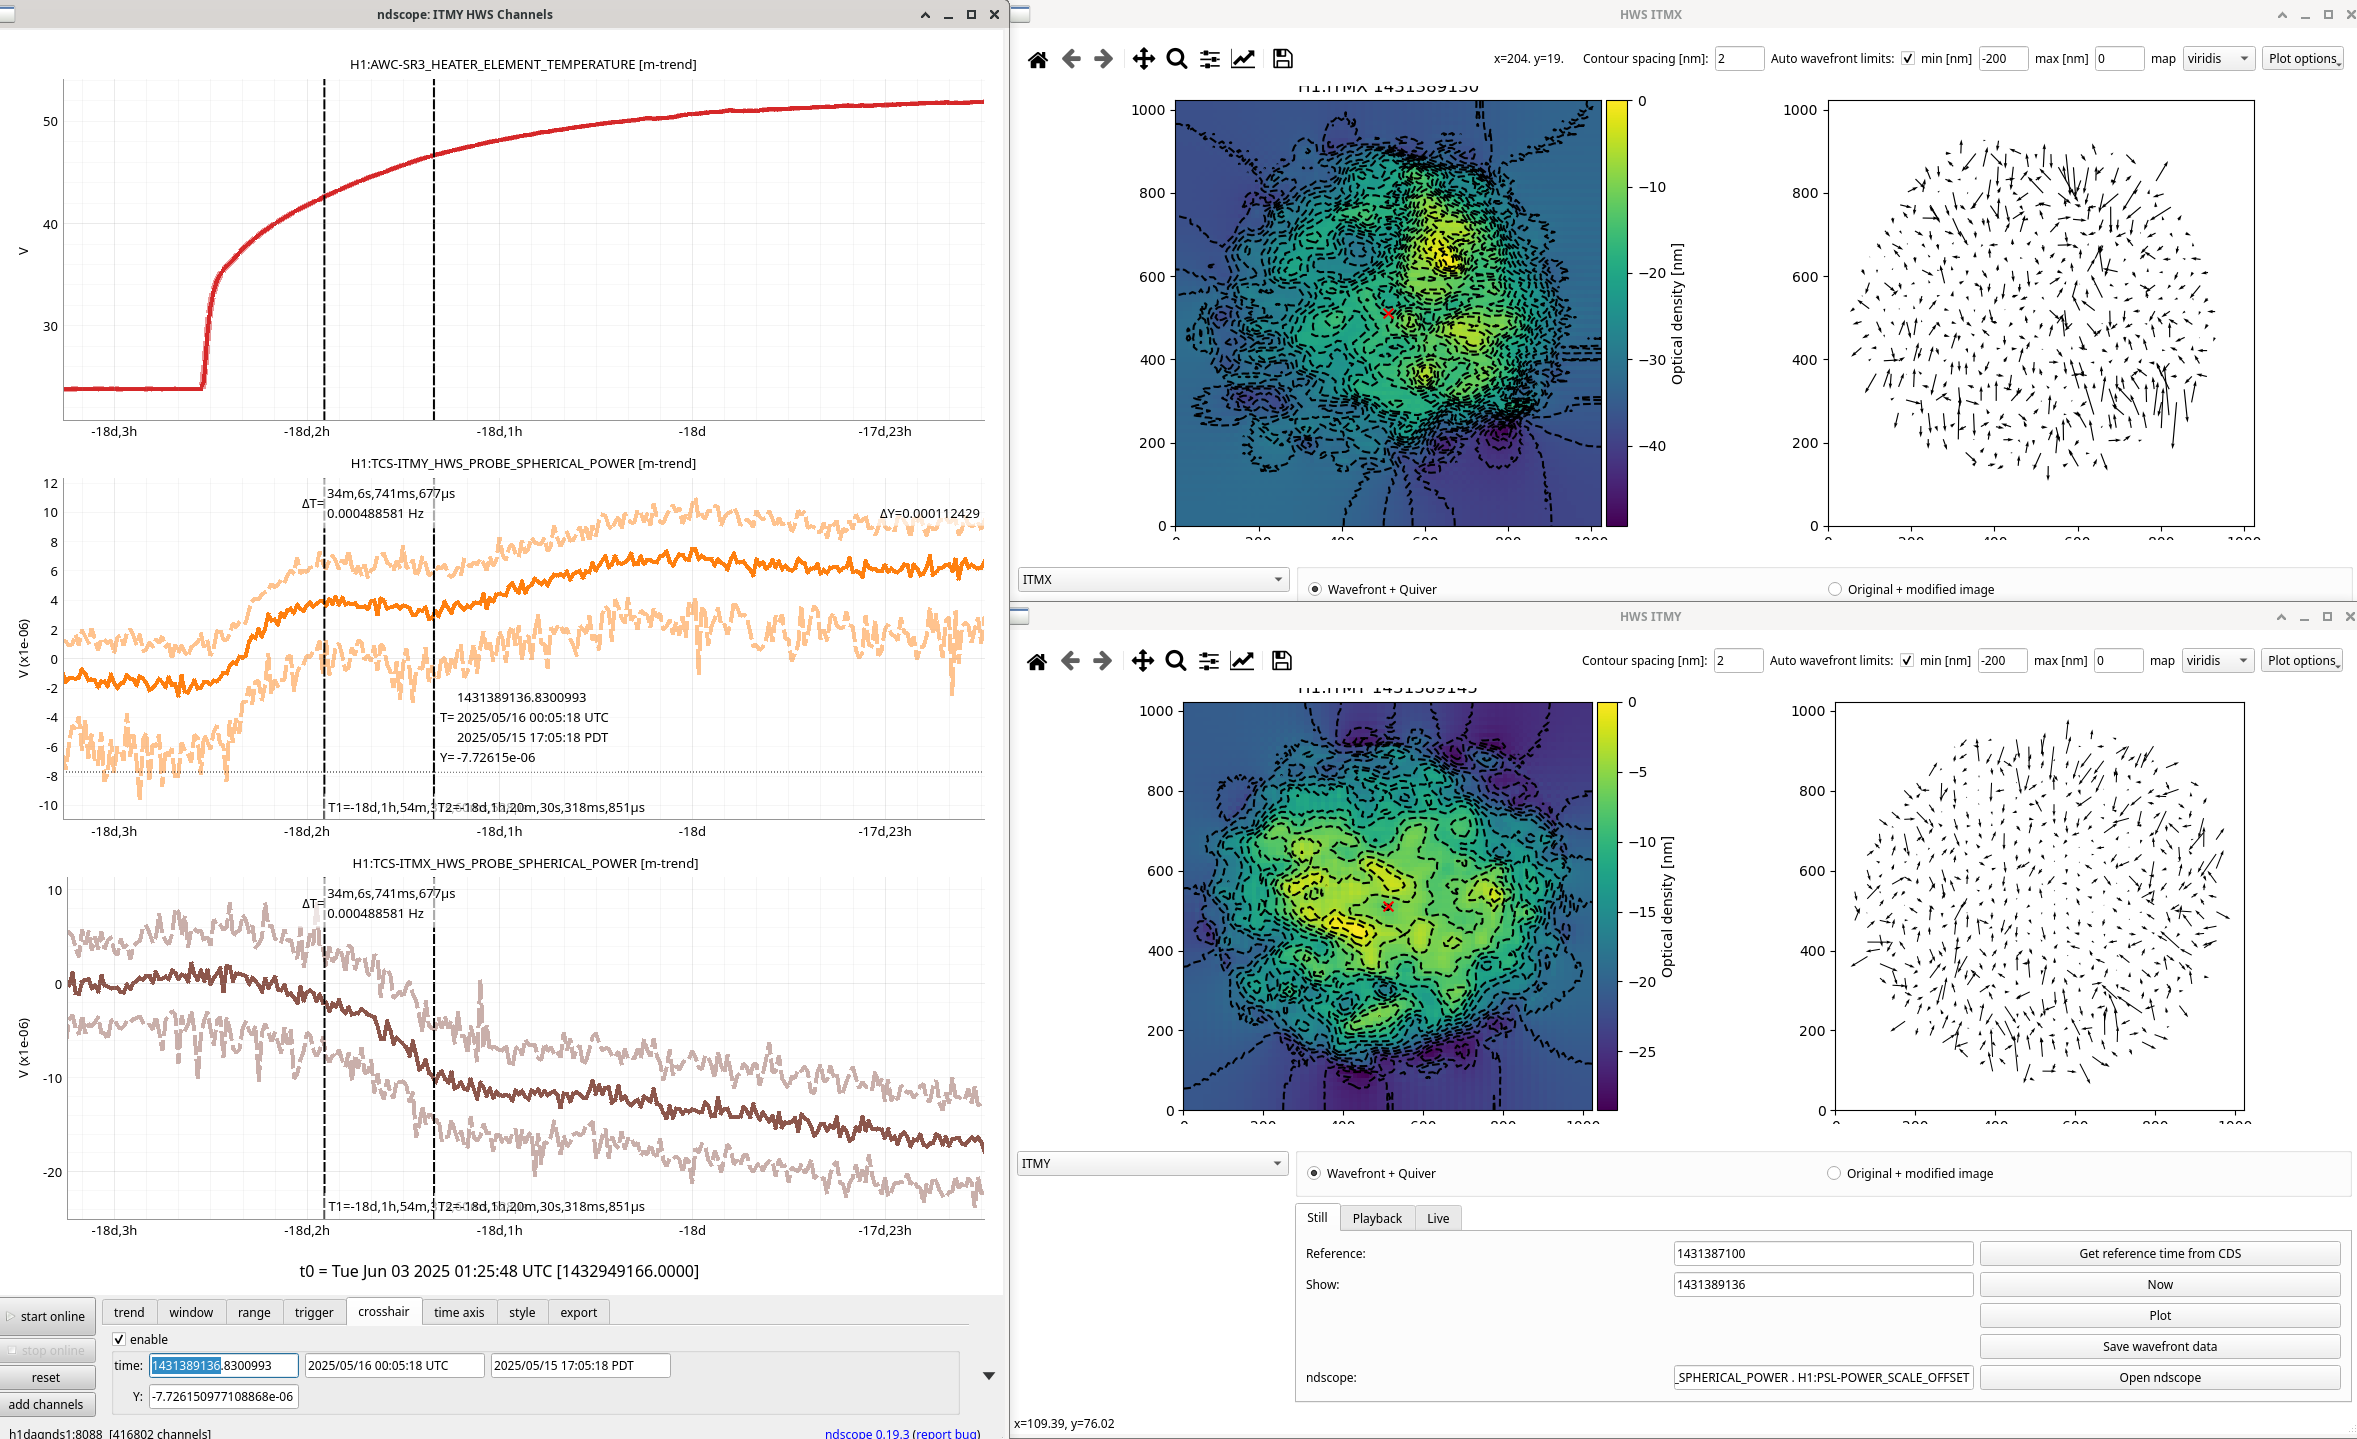
Looked closer at these HWS signals during SR3 heater heat up and cool down. In all these plots, the two t-cursors are used as the reference and shown HWS live image.
Some strange things:
Finally got round to fitting the two single bounce mode scans done with SR3 hot and OM2 cold. The first we had ITMX aligned, the second we switched to ITMY aligned.
These can currently be processed using OMCscan.py in the /dev branch for the labutils/omcscan repository at /ligo/gitcommon/labutils/omc_scan, you need to have activated the labutils conda environment to do so.
The call statements for the data processing are:
python OMCscan.py 1431449762 130 "1st 1431449762 - SR3 hot, 10W PSL, ITMY mis-aligned" "single bounce" -s -v -o 2 -m
python OMCscan.py 1431450536 140 "2nd 1431450536 - SR3 hot, 10W PSL, ITMX mis-aligned" "single bounce" -s --verbose -m -o 2
For each measurement the tag -s specifices that the sidebands were not on and so in order to calibrate the PZT the code uses the two TM00 modes and then you have to tell it in what height order the 10 and 20 modes appear relative to the highest peak which will be one of the 00 modes.
def identify_C02(self):
"""If in single bounce configuration, and with sidebands off,
identify 10 and 20 modes in order to improve fit.
Assumes that
OMCscan.identify_peaks()
and
OMCscan.identify_carrier_00_peaks()
have already been run.
Output:
-------
self.peak_dict: dictionary
first set of keys are carrier, 45 upper, 45 lower
second set of keys are TEM mode, e.g. "00", "01", "20", etc.
third set of keys is the fsr number
"""
# Create temporary dictionary to combine into self.peak_dict
peak_dict = {}
peak_dict["carrier"] = {"10": {}, "20": {}}
#print(peak_dict)
nn = [2, 1]
mm = 0
#freq_diff = np.empty(np.size(self.peak_frequencies)) not sure why this line here.
#set frequency to be that of third largest peak.
first_order = np.argsort(self.peak_heights)[-4]#-4 for second meas.
second_order = np.argsort(self.peak_heights)[-3]#change index to match where 20 is in terfirst meas if measuring from start of scan.ms of peak height.
#print(third_larg)
for ii, peak_freq in enumerate(self.peak_frequencies):
if peak_freq == self.peak_frequencies[second_order]:
#print("found C02")
#print(f"List fields in IFO {self.fields_MHz}")
#print(type(self.fields_MHz))
#print(f"OMC HOM spacing {self.omc_hom} MHz")
#print(type(self.omc_hom))
field = f"carrier"
#print(f"mode {field}{nn[0]}{mm}")
peak_dict[field]["20"][-1] = {
"height": self.peak_heights[ii],
"voltage": self.peak_pzt_voltages[ii],
"frequency": self.peak_frequencies[ii],
"true_frequency": np.mod((self.fields_MHz - (nn[0] + mm) * self.omc_hom), self.omc_fsr),
"label": r"$c_{20}$",
}
self.peak_ided[ii] = 1
elif peak_freq == self.peak_frequencies[first_order]:
field = f"carrier"
peak_dict[field]["10"][-1] = {
"height": self.peak_heights[ii],
"voltage": self.peak_pzt_voltages[ii],
"frequency": self.peak_frequencies[ii],
"true_frequency": np.mod((self.fields_MHz - (nn[1] + mm) * self.omc_hom), self.omc_fsr),
"label": r"$c_{10}$",
}
self.peak_ided[ii] = 1
else:
continue
# Merge dictionaries
#if not "20" in peak_dict["carrier"].keys():
self.peak_dict["carrier"] = {**self.peak_dict["carrier"], **peak_dict["carrier"]}
#print(self.peak_dict)
#print(self.peak_ided)
return
For both measurements I only took slightly over 1 FSR of the data, this is because in order to fit a polynomial to the known peaks (allowing us to calculate the PZT non-linearity), the code assumes the 1st order is the 3rd highest and 2nd order is the 4th highest. In the code above you need to change the indexes in the below lines to match the height order of the peaks (ie. and index of -4 is fourth highest peak).
first_order = np.argsort(self.peak_heights)[-4]
second_order = np.argsort(self.peak_heights)[-3]
When the mode-matching is bad this may not be true, also if there are multiple FSRs in the scan this also may not be true.
First measurement 1st order mode is fifth highest, 2nd order mode is third highest. The scan is here. I took 130 s of data. The PZT fit is here.
Second measurement the 1st order mode was the 4th highest, 2nd order mode was the third highest. The scan is here. I took 140s of the scan data. The PZT fit is here.
First measurement has
1.69/(1.69+15.86) = 9.63 % mode mis-match.
Second measurement has
1.25*100/(1.25 + 16.46) = 7.06 % mode mis-match
I also analysed the single bounce measurements Elenna and Sheila made after OM2 was heated up. So these have both SR3 and OM2 hot.
For both these measurements C02 was the third highest mode and C01 was the fourth highest. I took 120s starting 45s into the scan.
Measurement 1: 23:40:38 UTC on 2025/05/16 with ITMX aligned and ITMY mis-aligned.
See the spectrum with labelled peaks here.
And the PZT calibration here.
Mode mis-match is:
0.93/( 0.93 + 17.29 ) = 5.10 %
Measurement 2: 23:46:48 UTC on 2025/05/16 with ITMY aligned and ITMX mis-aligned.
See the spectrum with labelled peaks here.
And the PZT calibration here.
100 * 0.56/( 0.56 + 17.62 ) = 3.08 %
Bear in mind that this is assuming that there is no astigmatism in the OMC (since there is but we cannot resolve 02 vs 20 modes). This requires some careful analysis of uncertainties to get useful info about how we should tune for better mode-matching. Watch this space.
In these scans the SR3 heater request (POWER_SET) was 2W, the readback power monitor reports 1.9W.
Using the data from Elenna's scans with the sidebands on, I added a functioncalculate_modulation_depths()to the OMCscan.py code. I then used it to find the modulation depths for the 9 and 45 MHz from those scans:PDH measurement data for two GPS timestamps
Parameter GPS 1431450833 GPS 1431451160 Slider 9 MHz 23.4 dBm 20.4 dBm Slider 45 MHz 27.0 dBm 21.0 dBm Modulation depth 9 MHz 0.215 rad 0.165 rad Modulation depth 45 MHz 0.277 rad 0.145 rad