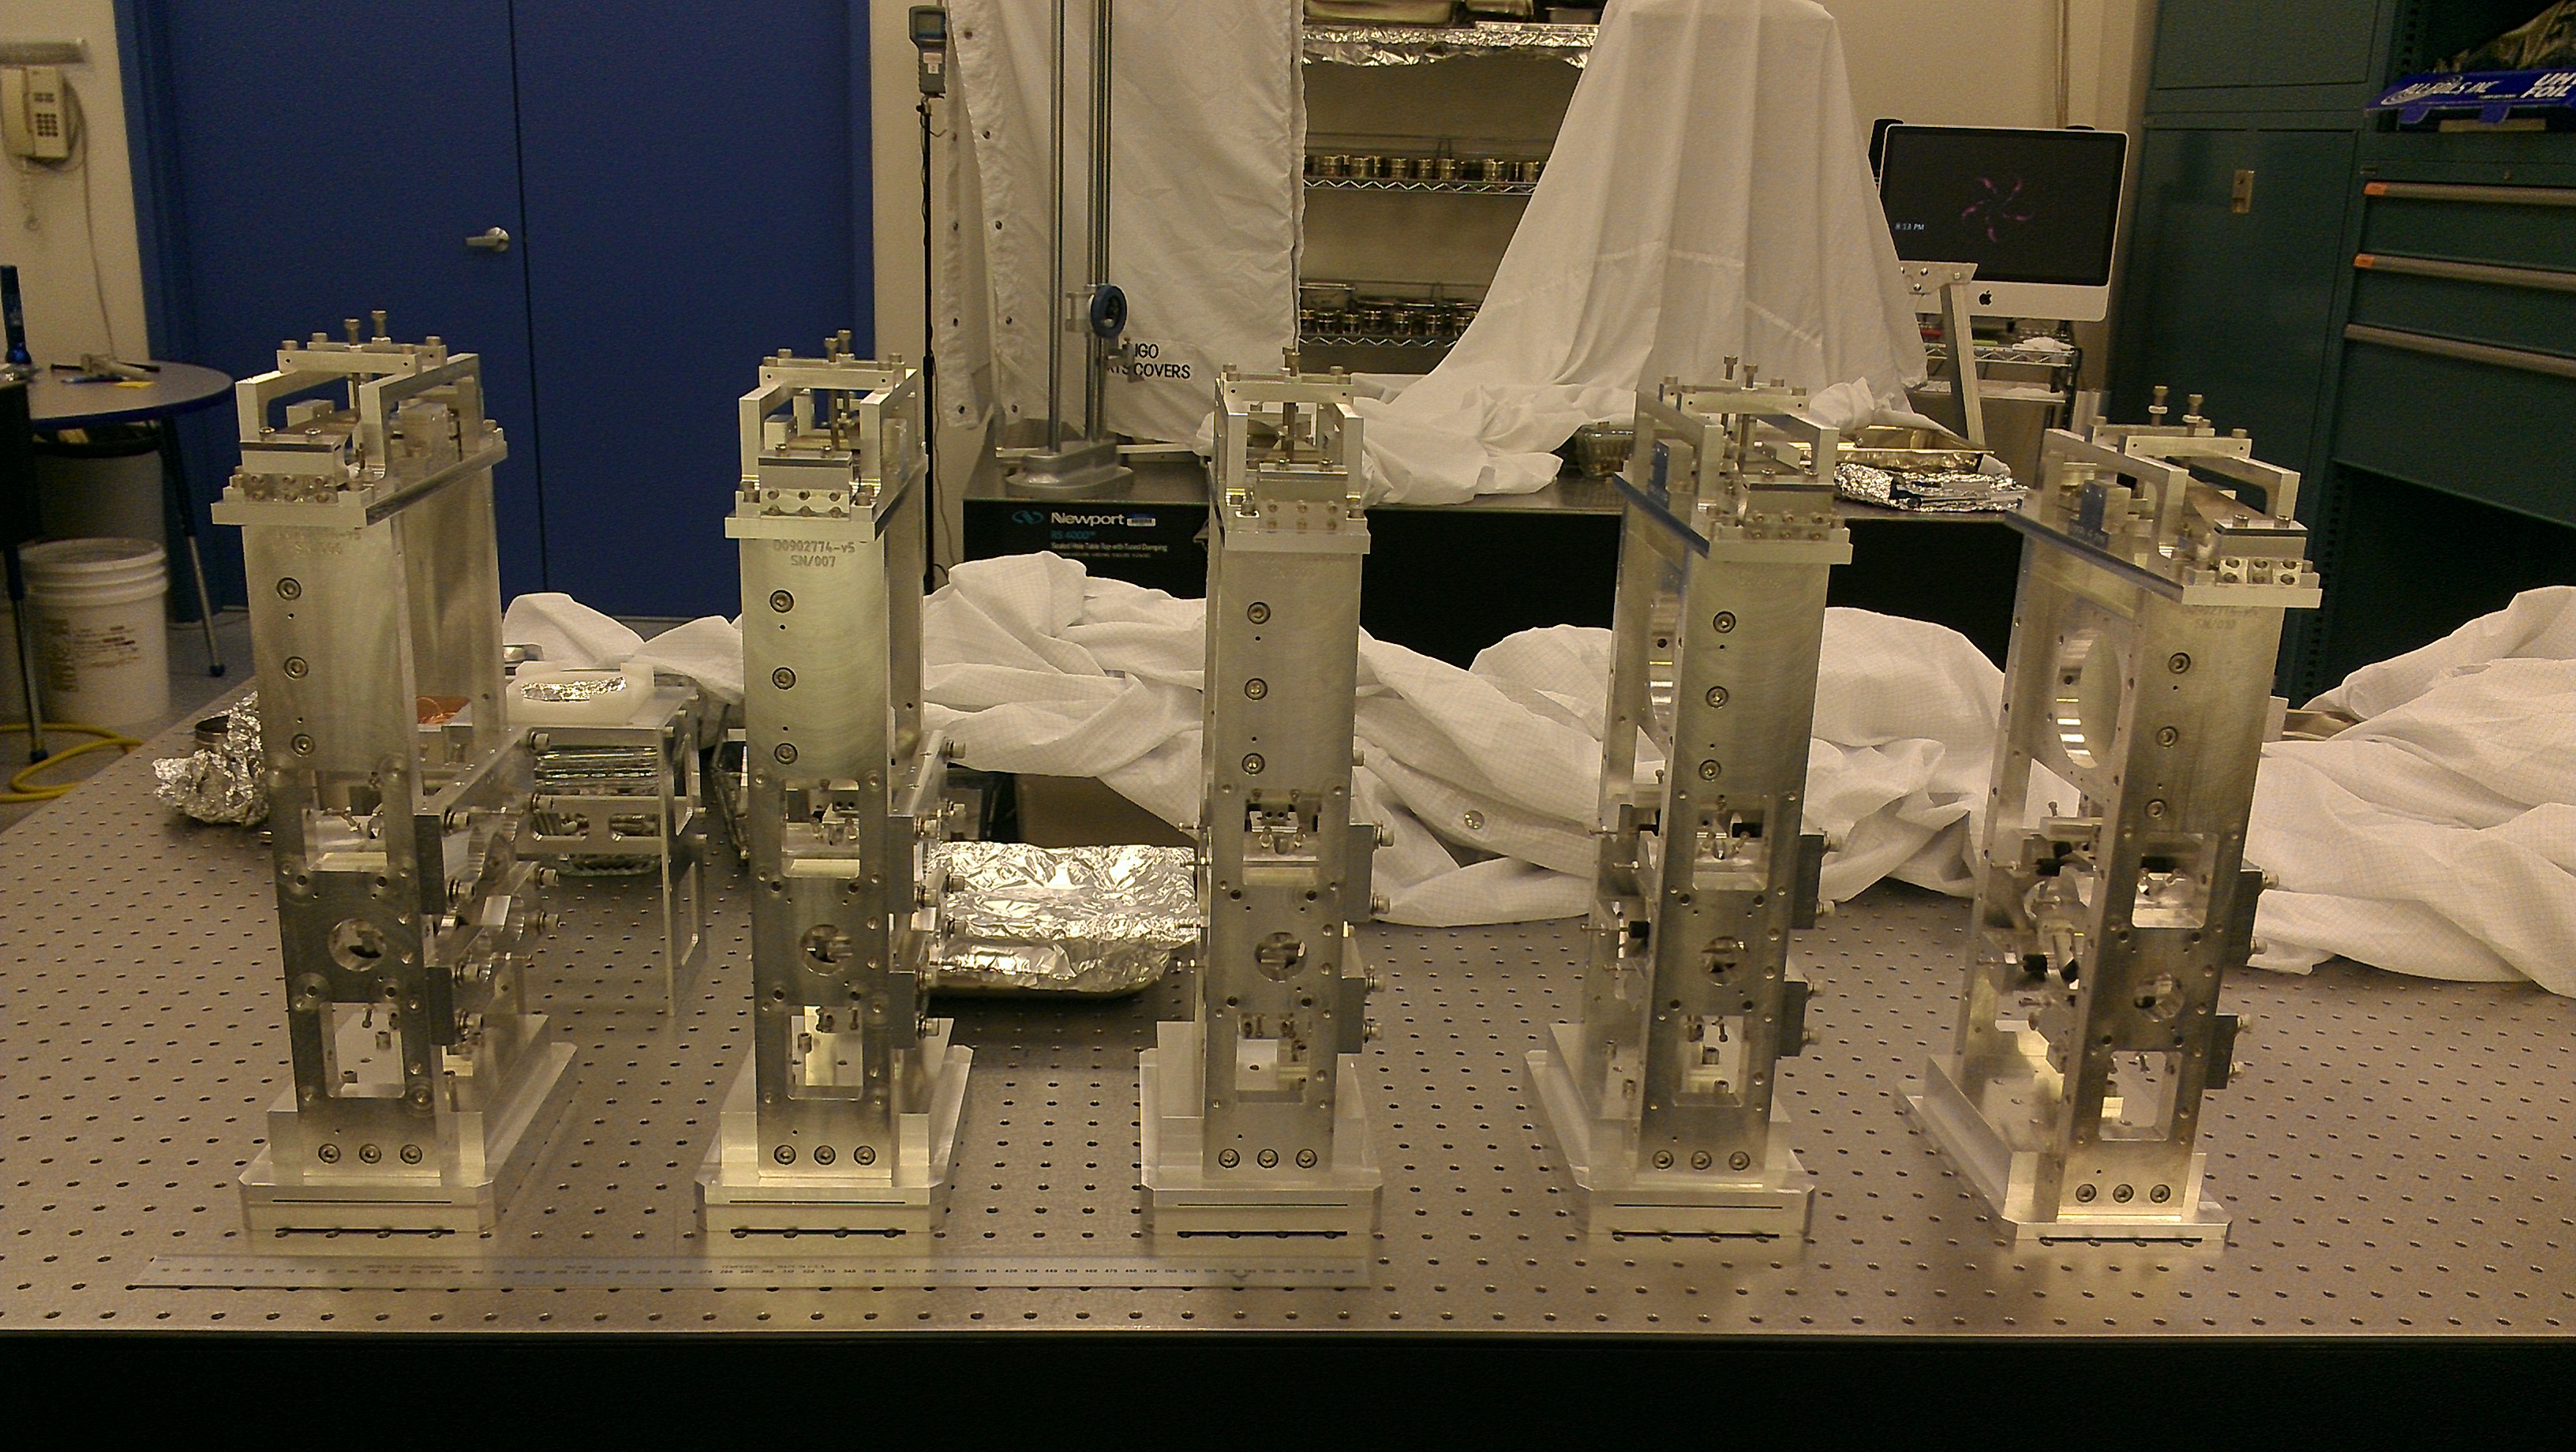
[Betsy, David F, Filiberto, Giacomo] Friday we have completed a few operation to get ready for starting HAUX testing on monday: - the old FC has been removed from the install optics and new one has been applied, covering the entire HR face and about 50% (diameter) of the AR face. No peek tab. The FC used is supposed to be red, but so light that it appears almost clear when applied in a layer. However, it belongs to the last shipment of FC sent to Betsy by Margot, so should be good. The spare optics were left untouched. - the HAUX were wrapped in foil, double bagged (we decided not to use any barrel) and moved from the staging building to the chamber-side cleanroom in the LVEA, awaiting optic installation on Monday. - the MEDM model has been checked, BURT restored and the filters installed: it seems to work fine (for what we can tell without OSEMs attached) and it now has the same setting as the one at LLO. - field cables where laid between sat-maps and chamber-side cleanroom, but we ended up not having time to connect anything to them. Binary I/O is not yet enabled (will be on Monday).
In July 2012 the top masses of the quadruple suspensions ITMY and ETMY were excited in order to obtain power spectra from the 24 OSEM sensor readback channels (6 on main chain top, 6 on reaction chain top, 4 on L1 stage, 4 on L2 stage). From these measurements the frequencies of 22 (between 0.1 - 6.0 Hz) out of the 24 mechanical resonances were found. These have been recorded in the aLIGO wiki https://lhocds.ligo-wa.caltech.edu/wiki/mark.barton/ResonanceTest
This wiki page is designed so that when the resonant frequencies of the other suspensions (HSTS , HLTS, BS) or other quadruple suspension resonances are measured they can be easily added to this catalogue of known measured and predicted frequencies. The idea is to have a list of identified features in the spectra of certain known channels, as was done in iLIGO: http://blue.ligo-wa.caltech.edu:8000/iLIGO/H1_Resonances (LVC login). The list may prove useful to aLIGO commissioners or detector characterization scientists trying to track down glitches.
The data and templates for these measurements resides in:
/ligo/svncommon/SusSVN/sus/trunk/QUAD/H2/ETMY/SAGL2/2012-07-25_top_actuation_ETMY_4times_power.xml
/ligo/svncommon/SusSVN/sus/trunk/QUAD/H2/ITMY/SAGL2/2012-07-25_top_actuation_test.xml
Attached are plots of dust counts > .5 microns in particles per cubic foot. The dust monitor that was under the clean room over HAM 3 (LVEA location 15) has been moved outside of the clean room. I do not know when this happened. The dust monitor in the clean room over HAM 4 (LVEA location 1) is near the edge of the clean room on the floor. I think it is probably reading counts from outside of the clean room.
We're done with M0 and L1 but not L2. I'm going home and will continue next week.
The PSL was transitioned back to low power at the end of the day. The PMC was realigned but I'm sure the alignment will drift while the path cools down. The heater was left off. ISS and FSS were also left off.
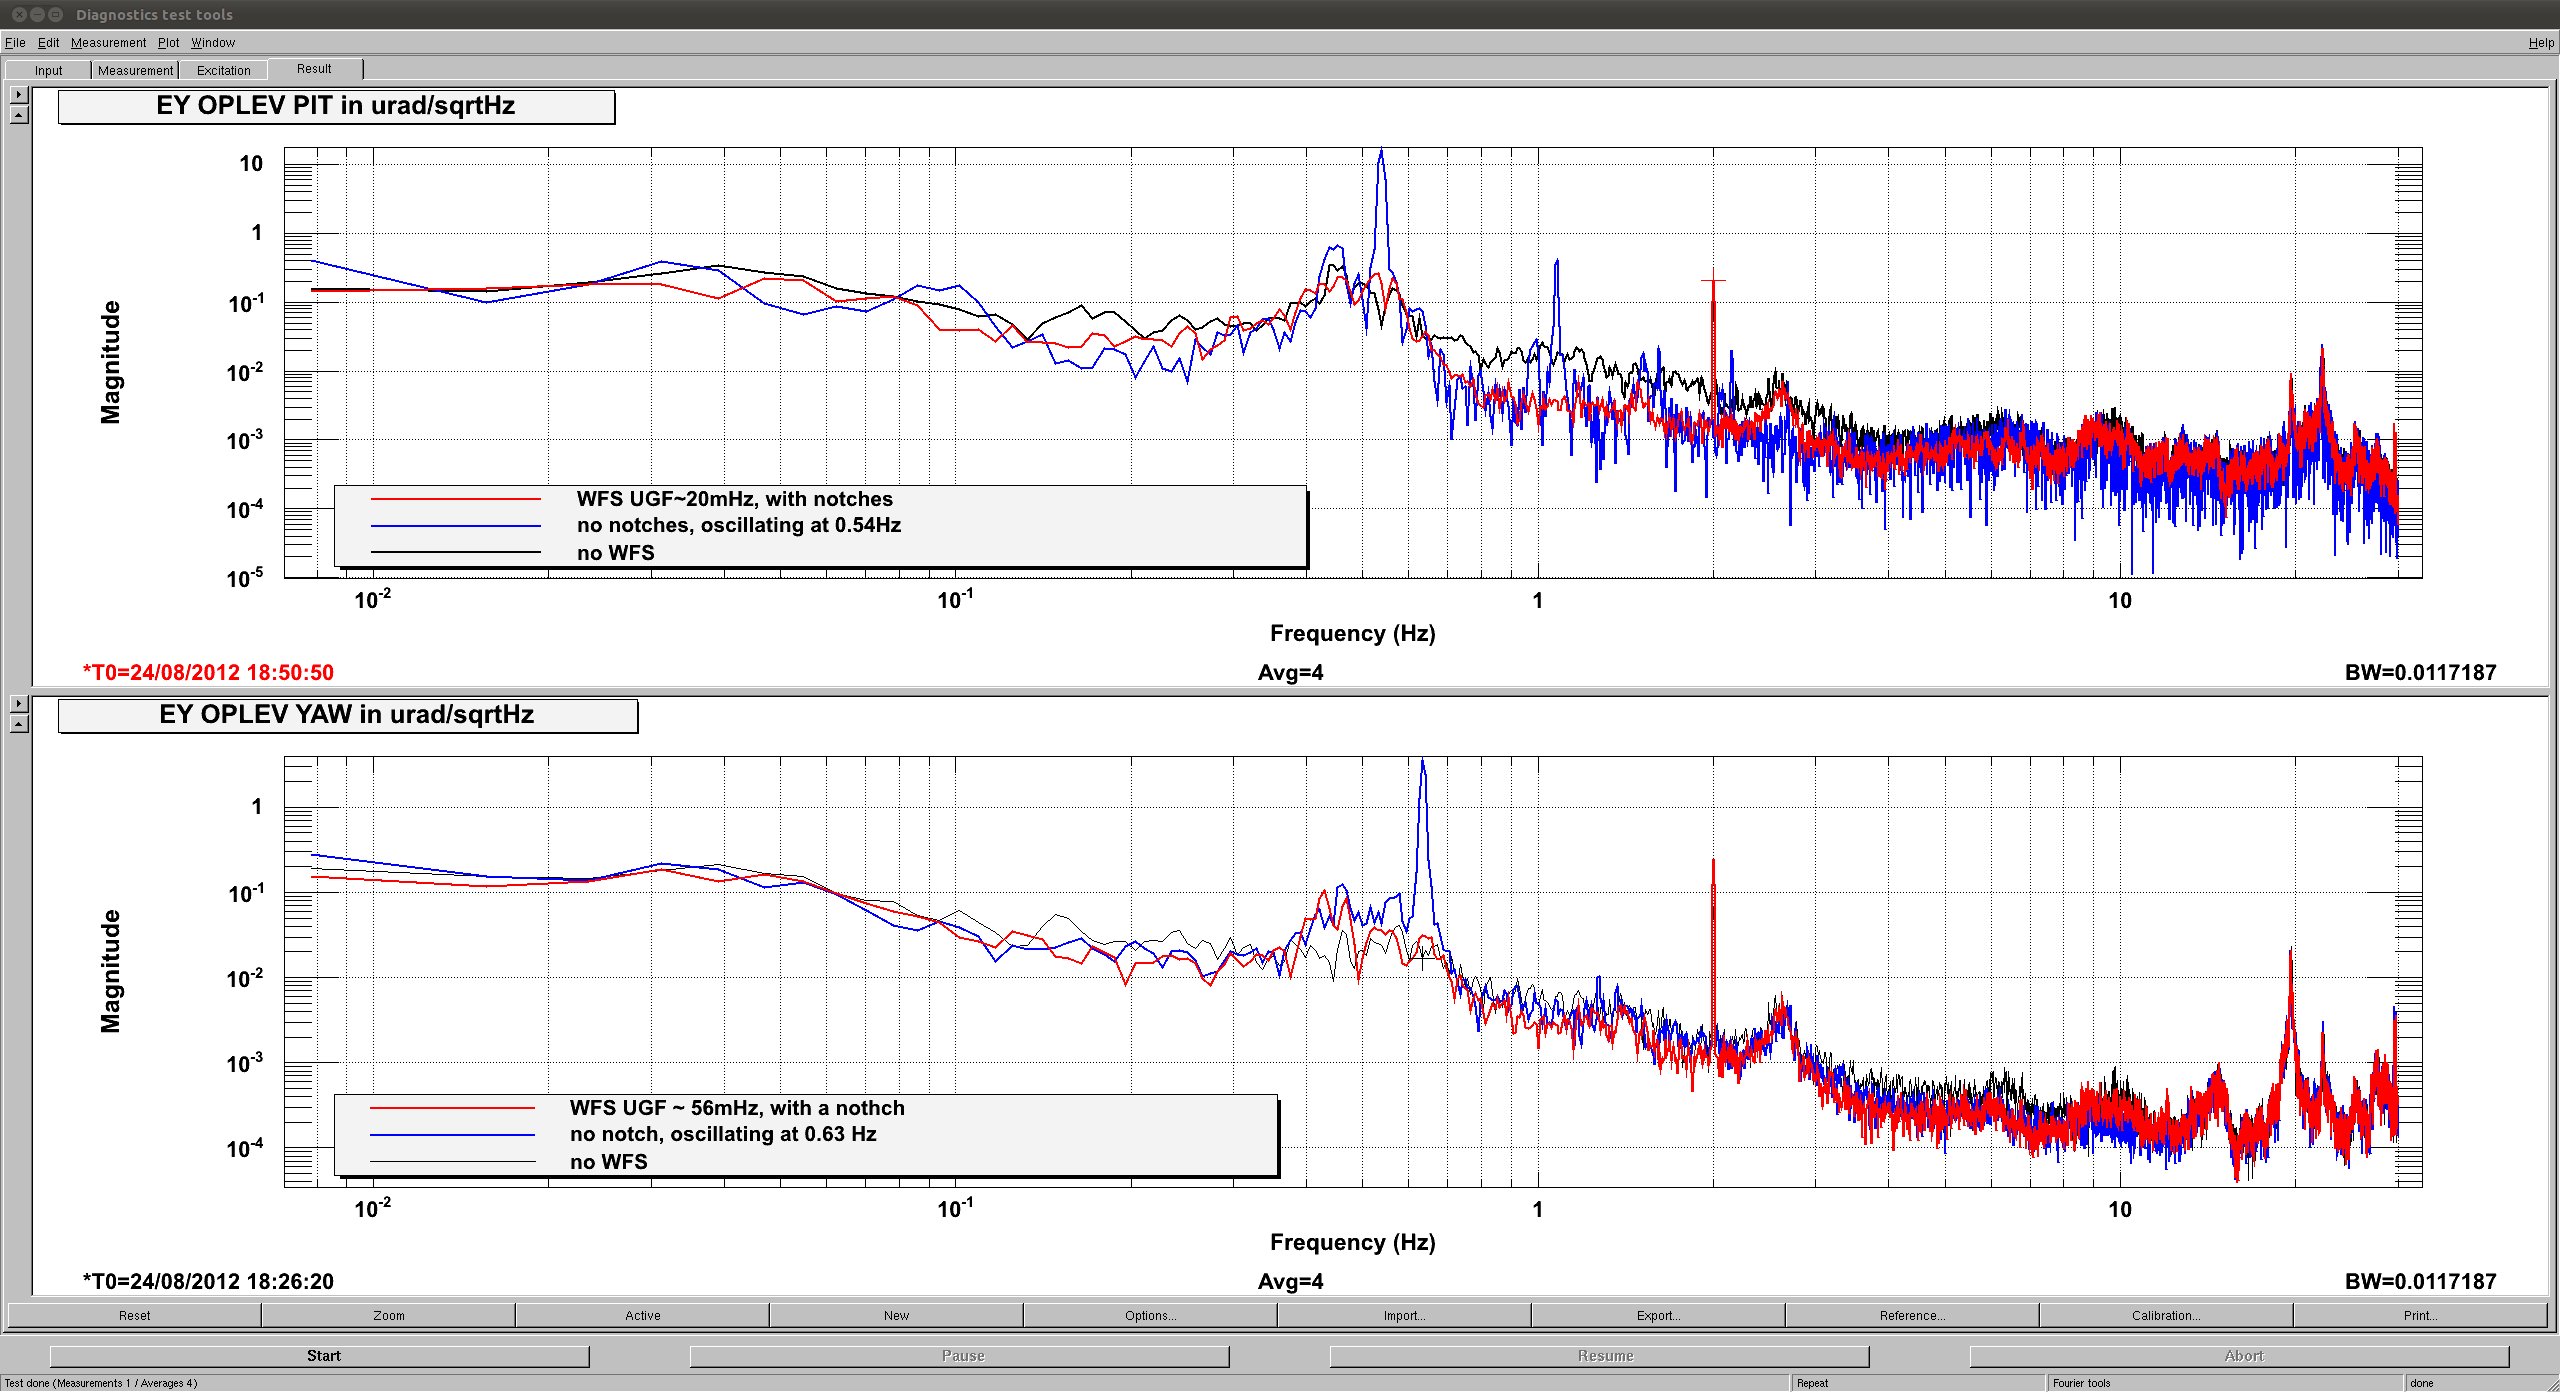
Assuming that the sensing matrix was correctly measured, from the filter shape it looked as if the UGF of WFSs were set to a mHz or two. This was because Alberto and Bram found that setting gain higher made things unstable.
Today I and Alberto reproduced the problem by simply setting the UGF higher: Apparently 0.54Hz PIT mode and 0.64 Hz YAW mode goes unstable because of high Q (attached, glue traces).
The PIT mode number looks like it's in good agreement with JeffK's SUS resonance plots, though for YAW 0.64 Hz in our data looks more like 0.6Hz in JeffK's.
Anyway, I made some notches (0.54Hz and 0.44 Hz for PIT, 0.63 Hz for YAW) and brought the gain up by a factor of 10 or so and they didn't oscillate (red). With this setting, the UGF for PIT should be about 20 mHz and for YAW it should be about 55mHz.
I haven't tried to push anything further.
BTW 2Hz on the plot is caused by Robert's injection.
I and Bram briefly checked if things looks sane by giving an offset step to each DOF (ETM/ITM, PIT/YAW) one by one.
Each time, the feedback eventually brought everything back to where it should be, so it's OK.
Due to ETM - ITM servo coupling (remember, the servo is supposed to be diagonalized based on POS/ANG rather than ETM/ITM), when you kick one mirror there is an initial kick to both of the mirrors and eventually everything gets back to normal. Or it's supposed to be so.
For ITM step, the time constant for both the ITM and ETM to go back to the original angle looked about right.
For ETM step, for some reason the bulk of ETM step itself is removed almost instantaneously, and then ITM moves with what seems to be a right time constant while ETM goes through the same slow thing but with lesser amplitude.
Maybe the sensing matrix measurement was still far from nice. But anyway it works and I don't intend to fix that immediately.
Now WFS is with some useful oomph, which is good. However, this also means that, when the arm drops out of lock, WFS output might go big and the cavity might not be able to relock on its own.
Though there are limiters to the WFS output (30 counts for PIT and 50 counts for YAW, which was set somewhat arbitrarily), 50 counts is large enough to tilt the mirrors such that 00 mode is really small in the cavity.
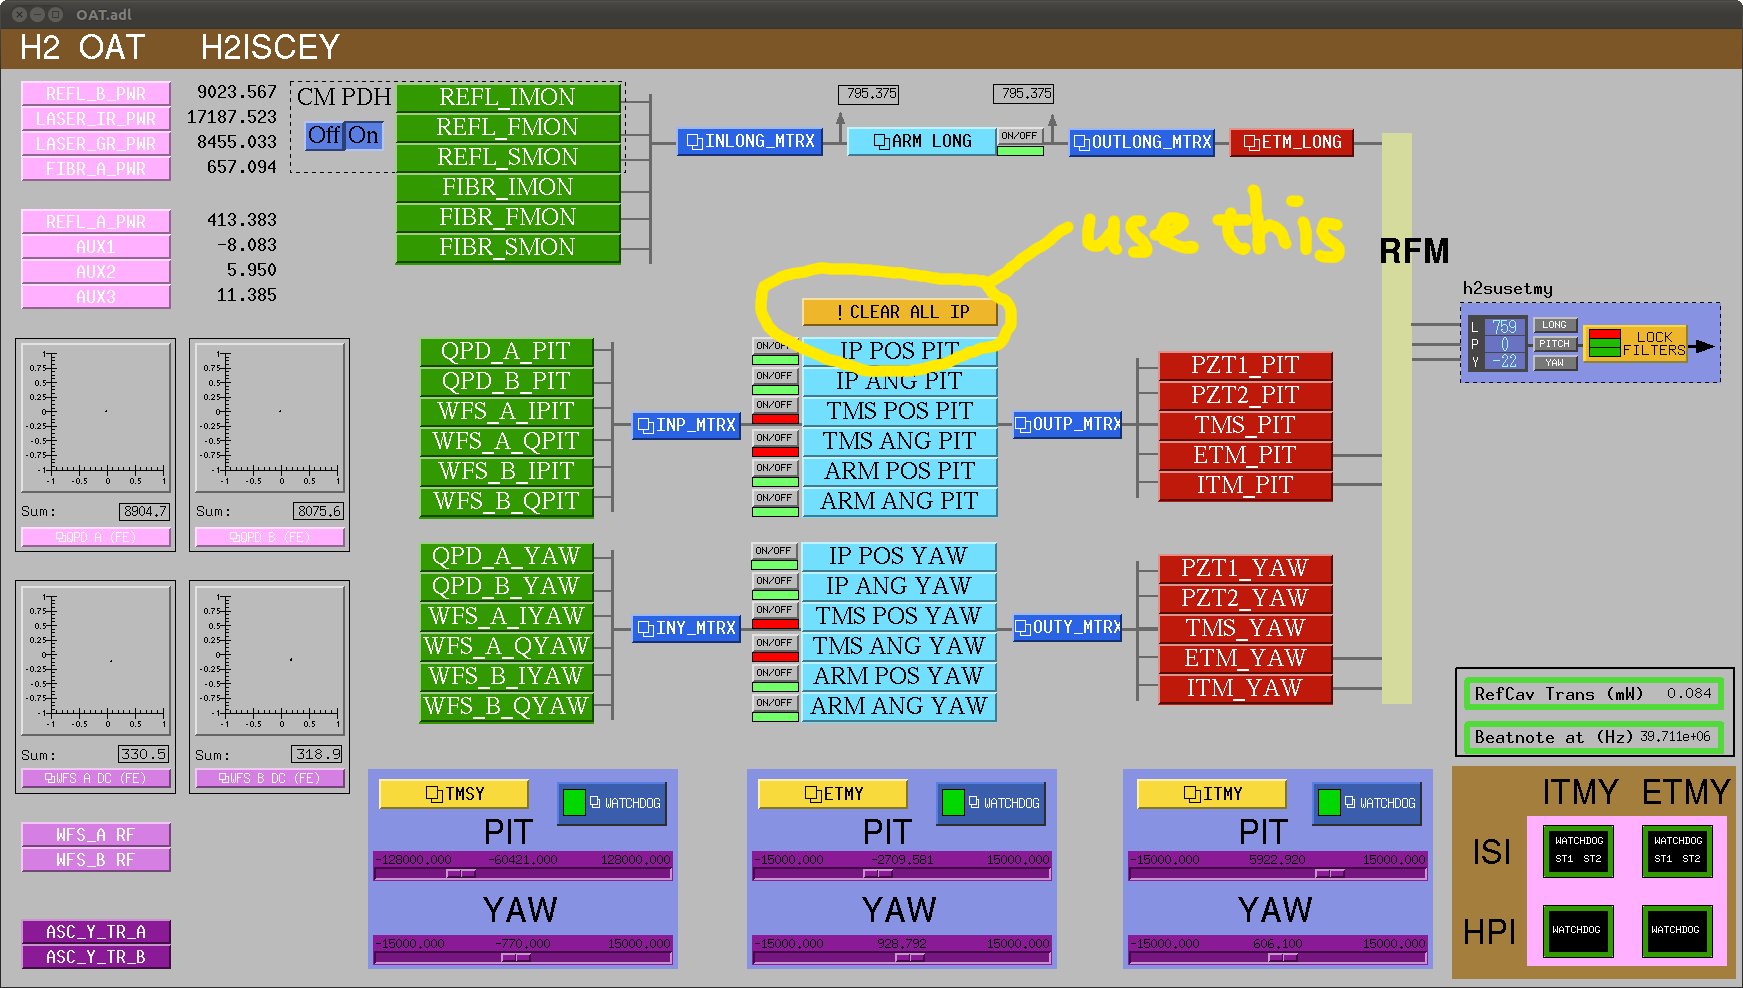
If this happens, you need to reset the integrator of the WFSs by pressing an ill-named "Clear all IP" button from H2 OAT medm screen (see attached) that is available from the ISC section of the sitemap.
If somebody writes an auto relocker that polls H2:ALS-Y_REFL_B_PWR_OUTPUT, disables CM PDH servo, press "Clear all IP" button and then enables CM PDH servo again, that would be greatly appreciated.
I did some analysis on the ring heater cavity scan measurements from yesterday. I've plotted the region around [0.37, 0.63] FSRs. This region encompasses the PDH TEM00 sideband resonances [0.45 FSRs and 0.55 FSRs] and also the LG10 sideband resonances. I've taken this section of data for each cavity scan and removed the constant phase offset and also the linear variation in phase with FSR. I've then plotted the scans as a movie. Despite the noise and the relatively quick speed, you can clearly see the response of a higher order mode shifting in frequency [0.53 FSRs to 0.58 FSRs] as time progresses. This is consistent with the cavity g-factor changing as the ring heater is applied.
I've yet to quantify the frequency shift.
Lisa Austin, Rodney Haux, Scott (Apollo), Thomas Vo We finished installing the aperture baffles for MCA2 and MCB2 this morning, and tightened up all the fasteners. This completes the entirety of our install for the output mode cleaner baffle. We were unable to screw in one button head cap screw on the MCA2 side due to alignment issues, pictures will be posted soon. Lisa Austin has documented this.
On Thursday we chased the 3 tapped holes where there was resistance while in chamber with a clean #10-32 tap and cleaned/flushed with alcohol. All hardware was attached, missing button head screw mentioned by Thomas Vo was installed. Photos available on ResourceSpace at https://ligoimages.mit.edu/?c=1139&k=98338475ad
It was noticed that the 10-32 holes that needed to be chased with a tap, had inadequate countersinks at the top of the holes for easy lead in and centering of screw installation.
8:15 - 1:30pm Activities (Thomas relieving for end of shift)
Morning Activities: Installing 3 doors, & heating tests for OAT
I have implemented the sensor correction at HEPI-BSC8. Sensor correction improves the isolation performances of the HEPI in the X, Y and Z directions. In attachment, spectra of the L4C installed in the HEPI boots are presented in different configurations:
There is no plots in the uncontrolled configuration (Robert S wants to keep the cavity locked).
Ugh -- no units on the vertical scales. Noise at 1 Hz goes down from ~100 to ~10; wish I knew what that means.
The spectra are measured before blending the L4Cs with the position sensors. The units are (nm/s)/sqrt(Hz) above 1Hz. To get the calibration in nm, you need to invert the idealized L4C (3 zeros at 0Hz and a pair of complex conjugate poles at 1Hz with a 45deg phase).
Even if there is no plots of the uncontrolled HEPI, the isolation provided by the controller without the sensor correction is visible in the blue curve (“V shape feature”). The isolation is defined by the blend filters (LP) of the position sensors (first segment of the “V” – Blend at 800mHz) and the super sensor suppression (second segment of the “V” – UGF at 10Hz).
When the STS-2 (ground) signal is added to the position sensors (sensor correction), it is like having a seismometer (STS-2) in the HEPI boot (TF from ground to top of the pier close to 1 below 10Hz). Now, the super sensor is an inertial sensor above 40mHz. With the sensor correction (red curves), the actual suppression follows the super sensor suppression. Consequently, the isolation improvement is visible in the 40mHz to 3 Hz frequency band.
Doors were returned to HAM2 East, HAM2 West and HAM3 West, in that order. The task was completed by 11:20 AM. We reported to the Control Room at the start of each door. The main crane was returned to the parking position. The forklift is sitting on the West side of HAM3.
David and I measured the reflection off the PMC window as 1.7W. When we had the 35W laser running this beam was 100mW. The razor blade dump was warm to the touch.
For the 200W beam
Note that the peak in the ISS at ~120Hz is back indicating noise eater noise. This is odd as I had already reset the noise eater once today and it already went back into oscillation.
After talking to Jan I left the PMC heater off. The temperature is still coming to equilibrium.
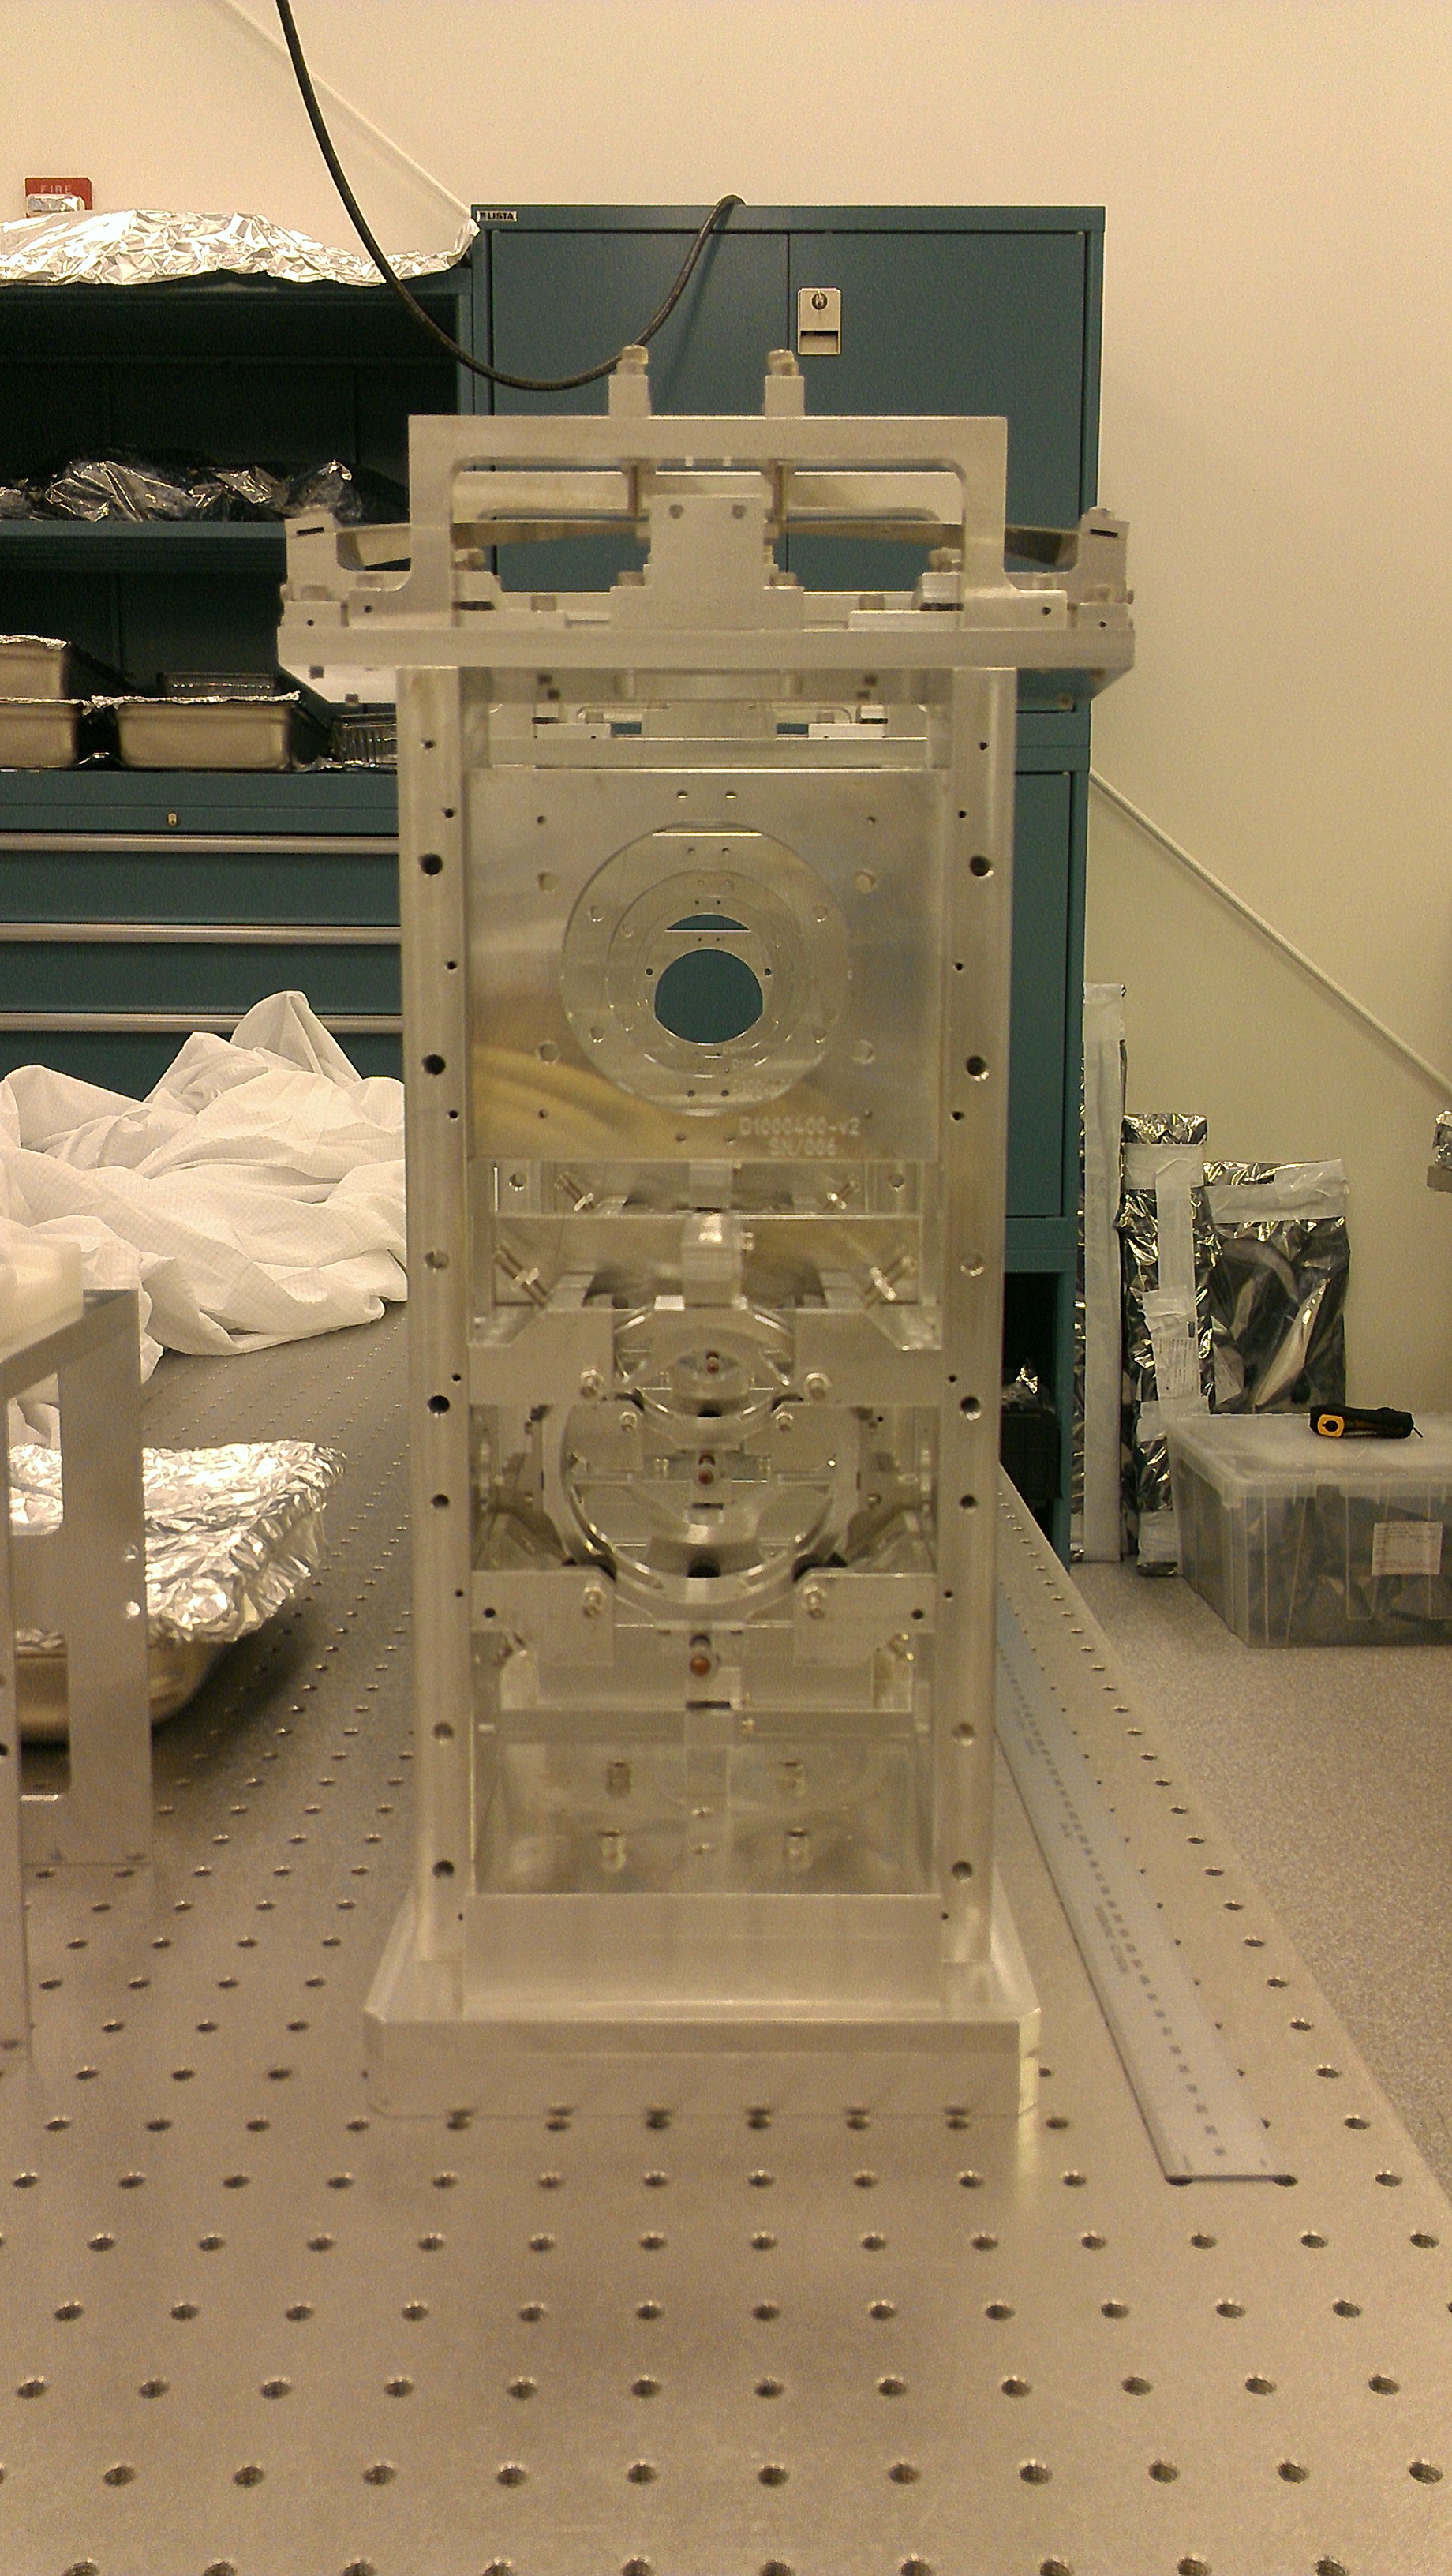
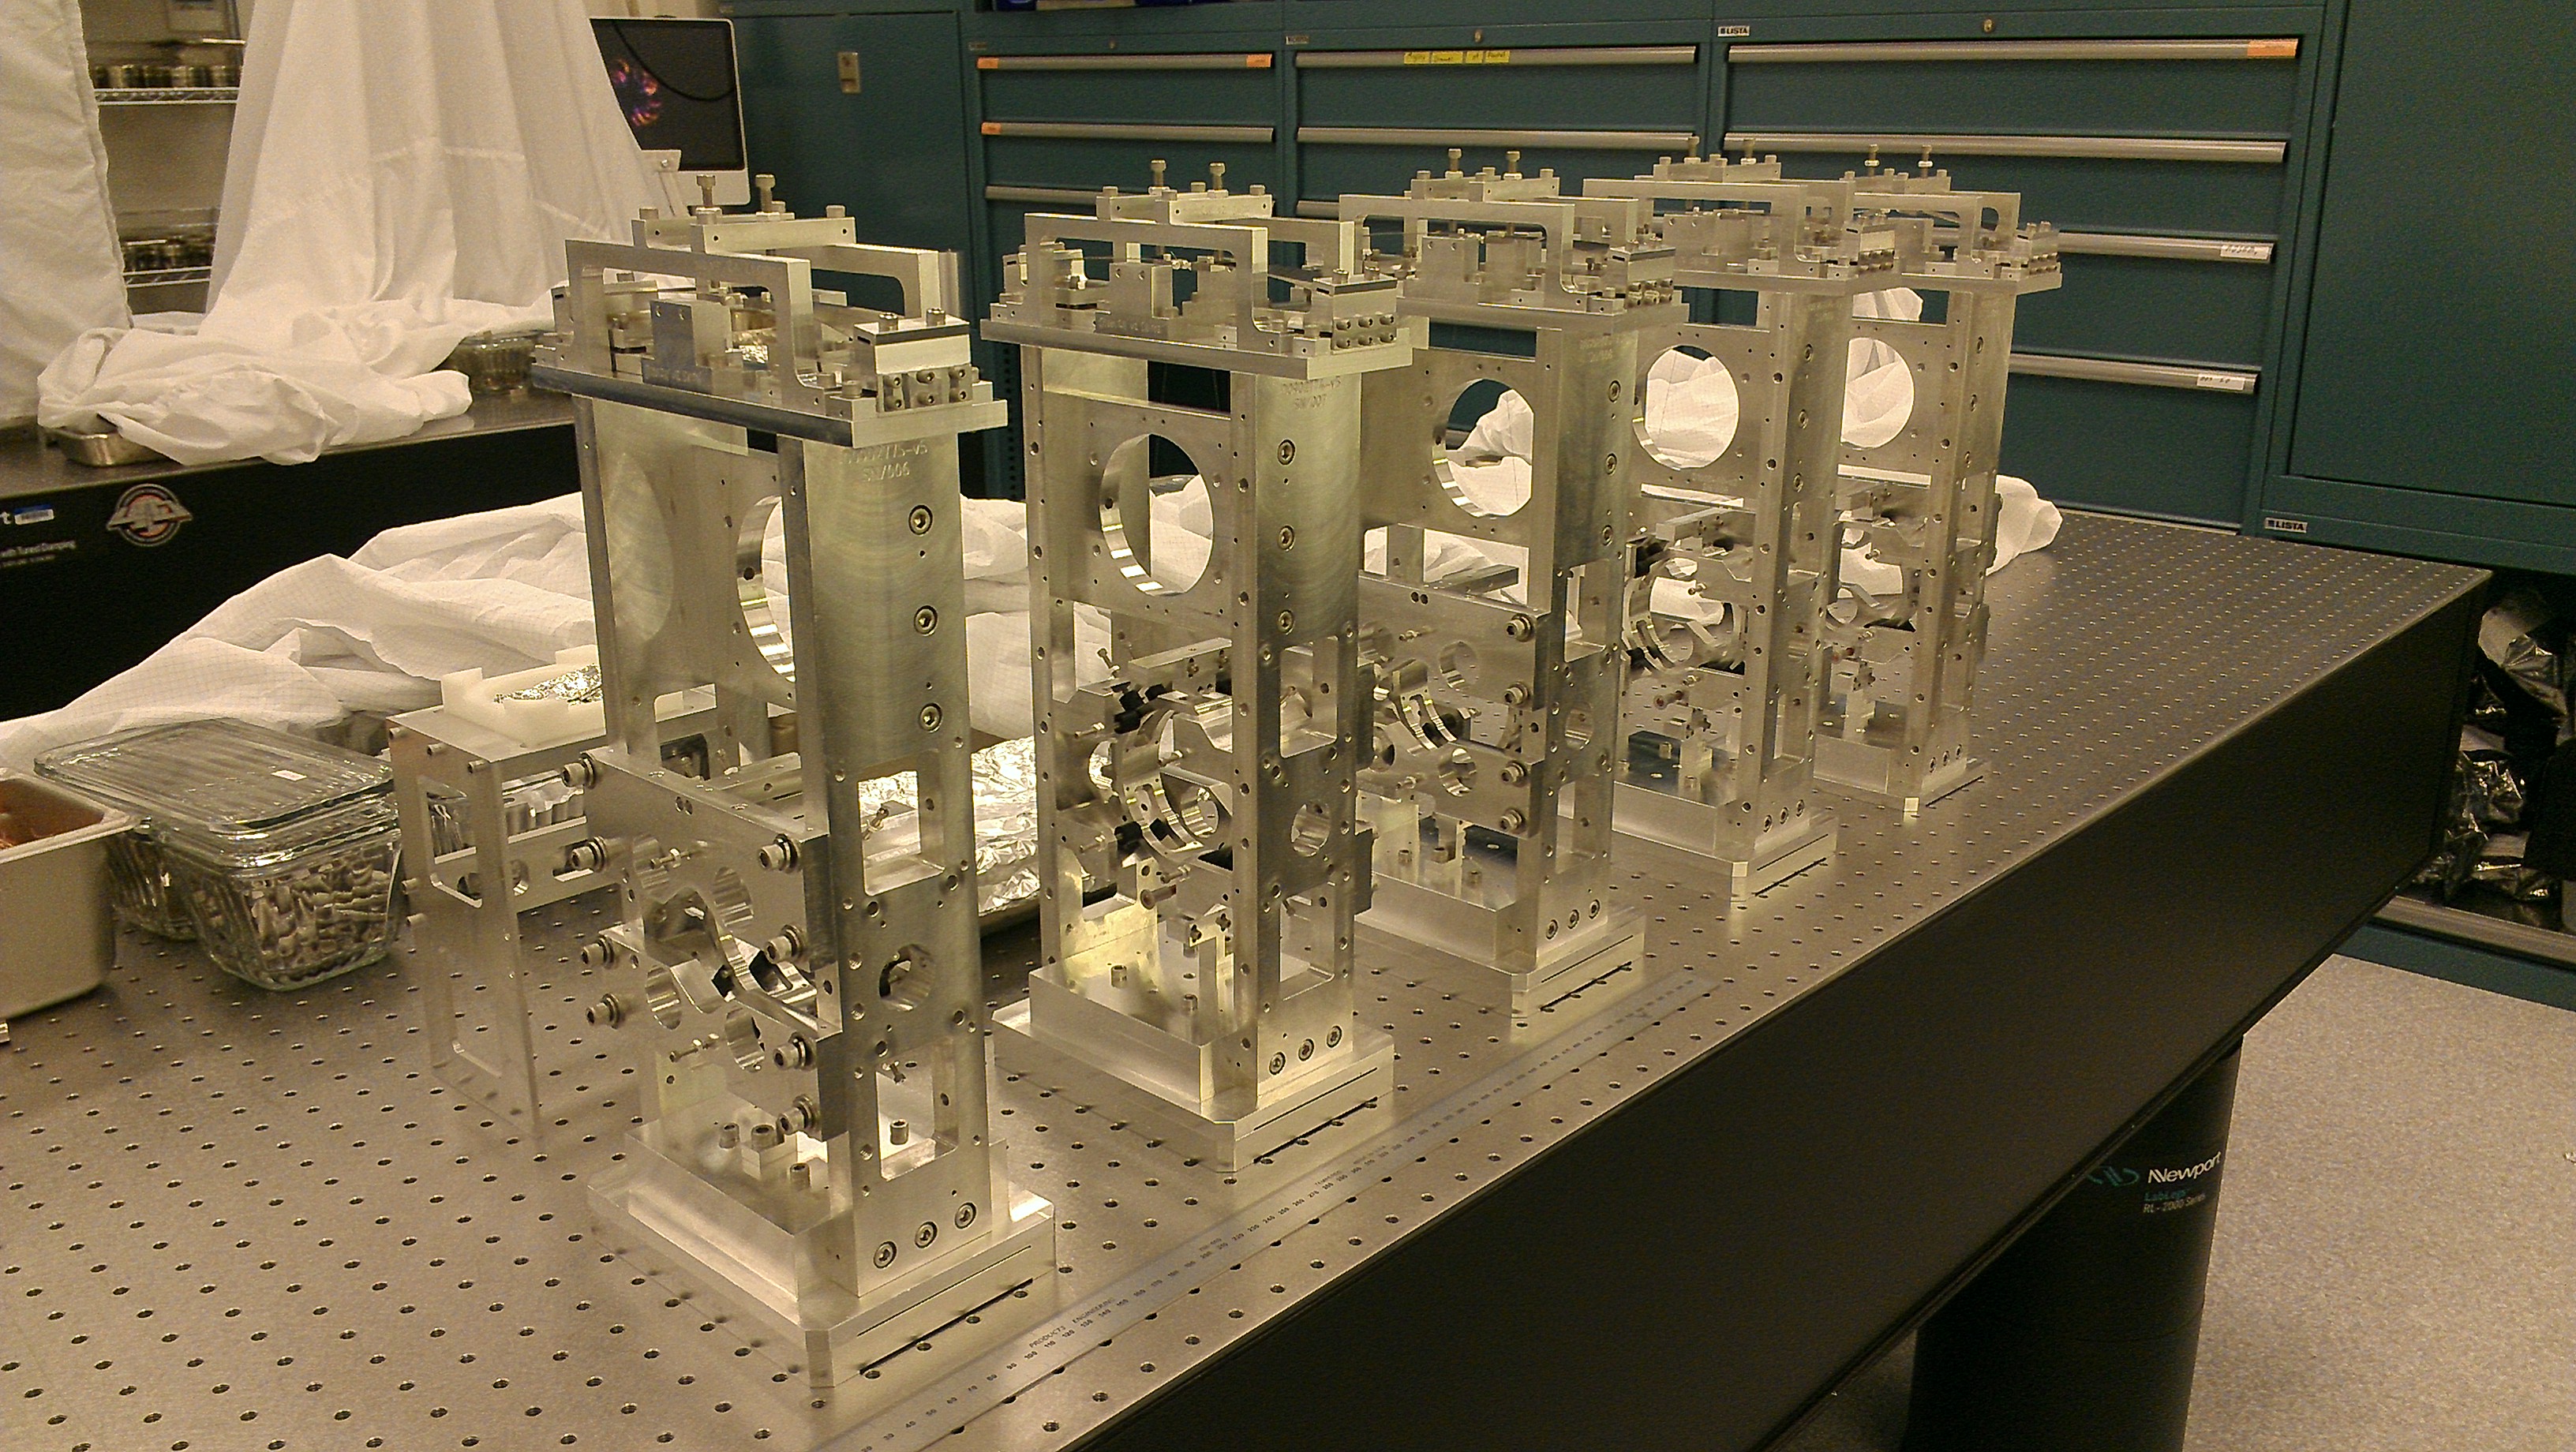
[Giacomo, Deepak] Owing to the invaluable help of Deepak and the support of a lot of people on- and off-site (thanks all for searching, investigating, procuring, shipping, etc.,..), HAUX build has gone smoothly and swiftly. As of yesterday night, we have 5 complete suspensions, that you can admire in the attached pictures. If you can't see the optics, it not because they are very clean: as they were not immediately available due to needed FirstContact work, we decided that the suspensions could be completed (including wiring) without the optics, and the optics added later (procedure in which we have been forced in the past to become experts). Because of that, we didn't even put in OSEMs and magnets. Altogether this would probably amount to another 1/2 to 1 hour of work per suspension. The plan for today is probably to move the suspensions chamber-side, and then give priority to setting up electronics and cabling to exploit David Feldbaum experience (it's his last day here). After that's taken care of, we'll FC the optics, insert them and then proceed to the testing phase.