Naoki, Andrei, Camilla, Vicky
To investigate the effect of vacuum pressure incident in HAM6 reported in 78346, Peter suggested to measure the FC loss since the FC should be the most sensitive cavity. We tried the FC ringdown measurement, but the result does not make any sense. We will take the data again.
Previous ringdown measurement: 66403, 67273
For ringdown measurement, we need the cabling as written in 67409 to lock the FC green with SQZ laser VCO since the SQZ laser frequency noise is too much for ringdown measurement with only TTFSS. We did only the first and second cabling in 67409. The third and fourth cabling is necessary if you want to do homodyne measurement.
After the cabling, we requested OPO guardian to LOCKED_SEED_DITHER, but the dither lock did not work well. The seed stayed around 25% of maximum seed trans. We confirmed that the OPO CMB EXC is connected to some DAC output which should be dither signal. Although the seed is not on resonance of OPO, the seed power seems stable so we moved on.
Then we manually locked the FC green. We also engaged one boost of FC green CMB. We adjusted green VCO tune to get the seed on resonance of FC.
We increased the seed power to 2.7 mW. More than 2.7 mW seed saturated the FC trans IR PD.
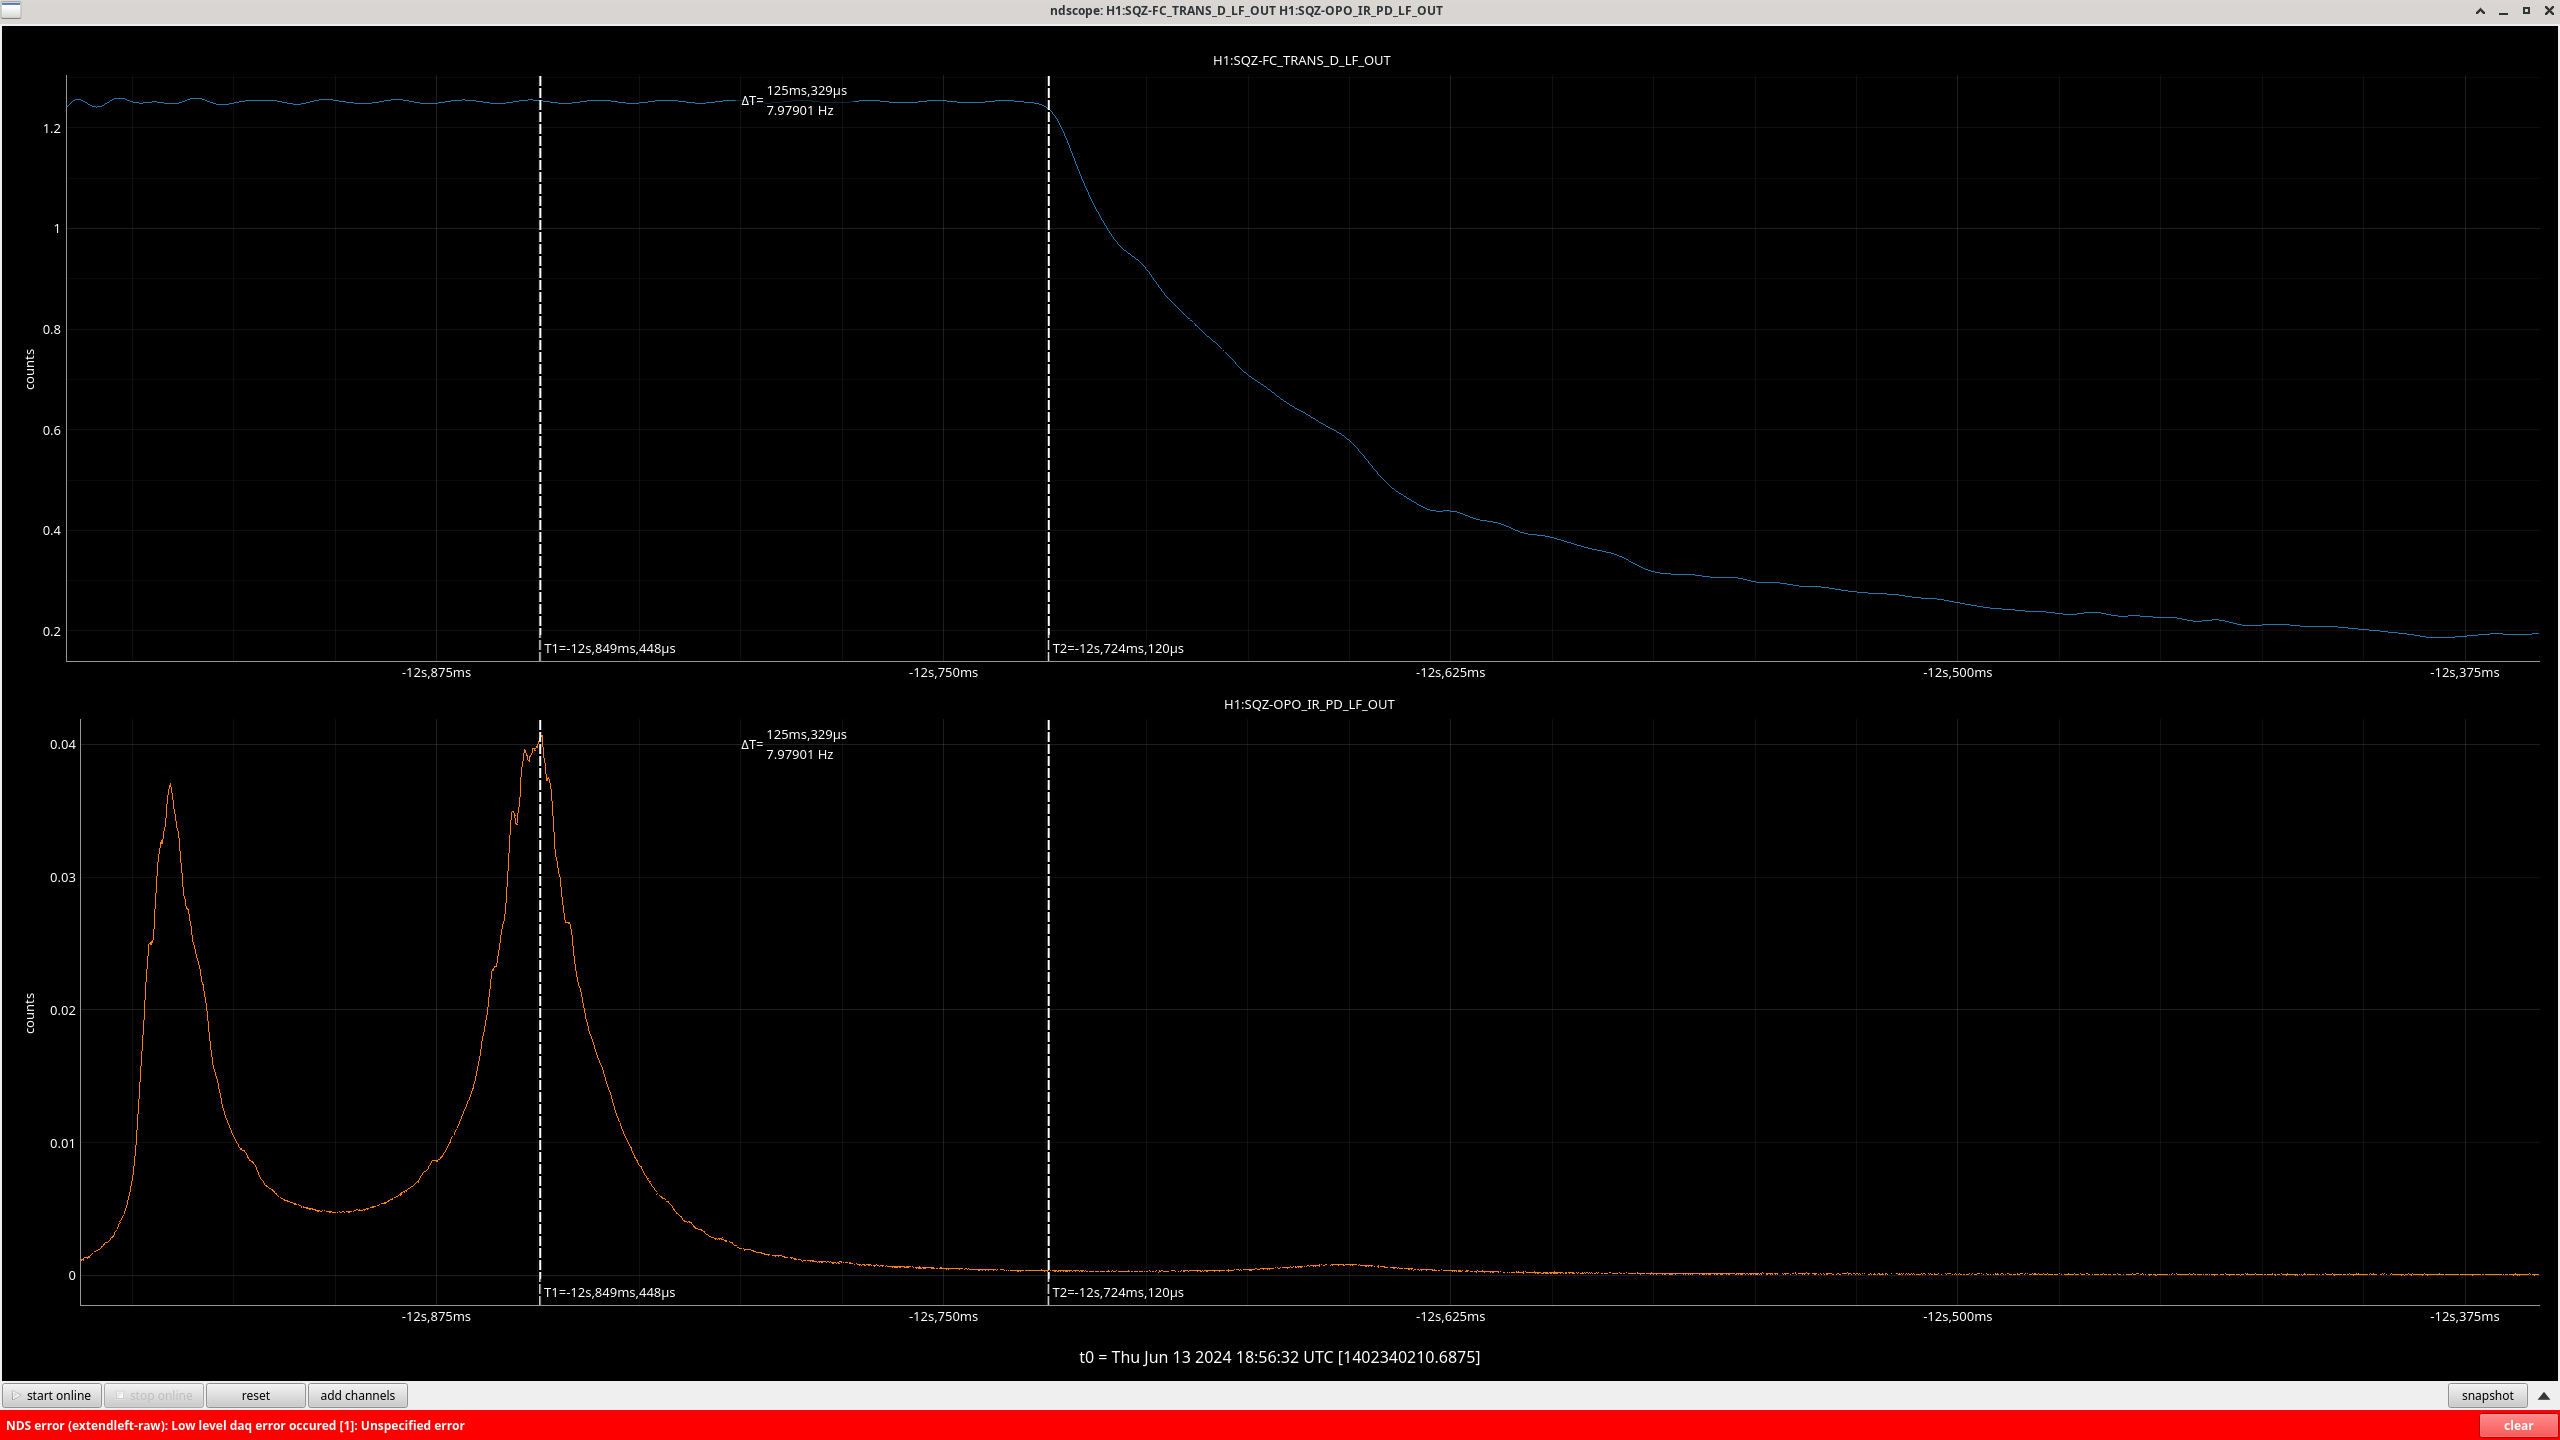
We looked at H1:SQZ-FC_TRANS_D_LF_OUT and H1:SQZ-OPO_IR_PD_LF_OUT for FC TRANS and REFL since they are 16k channel. We maximized the seed FC trans by adjusting green VCO tune and requested OPO guardian to DOWN.
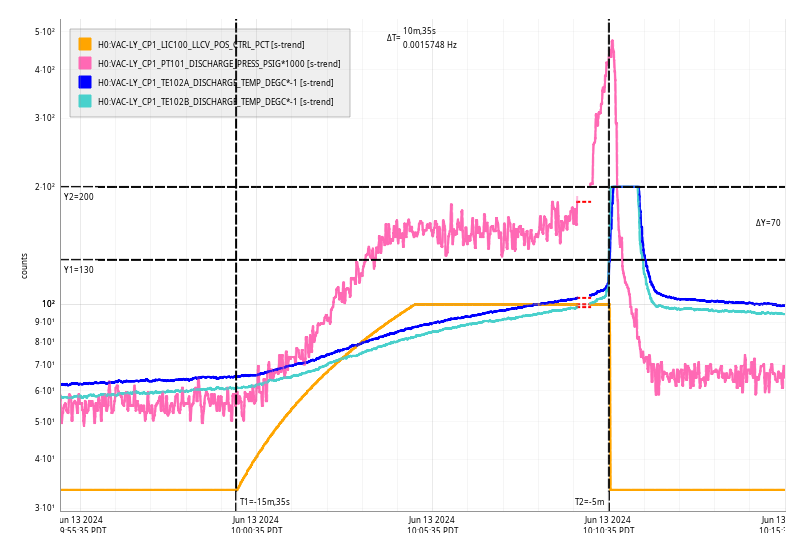
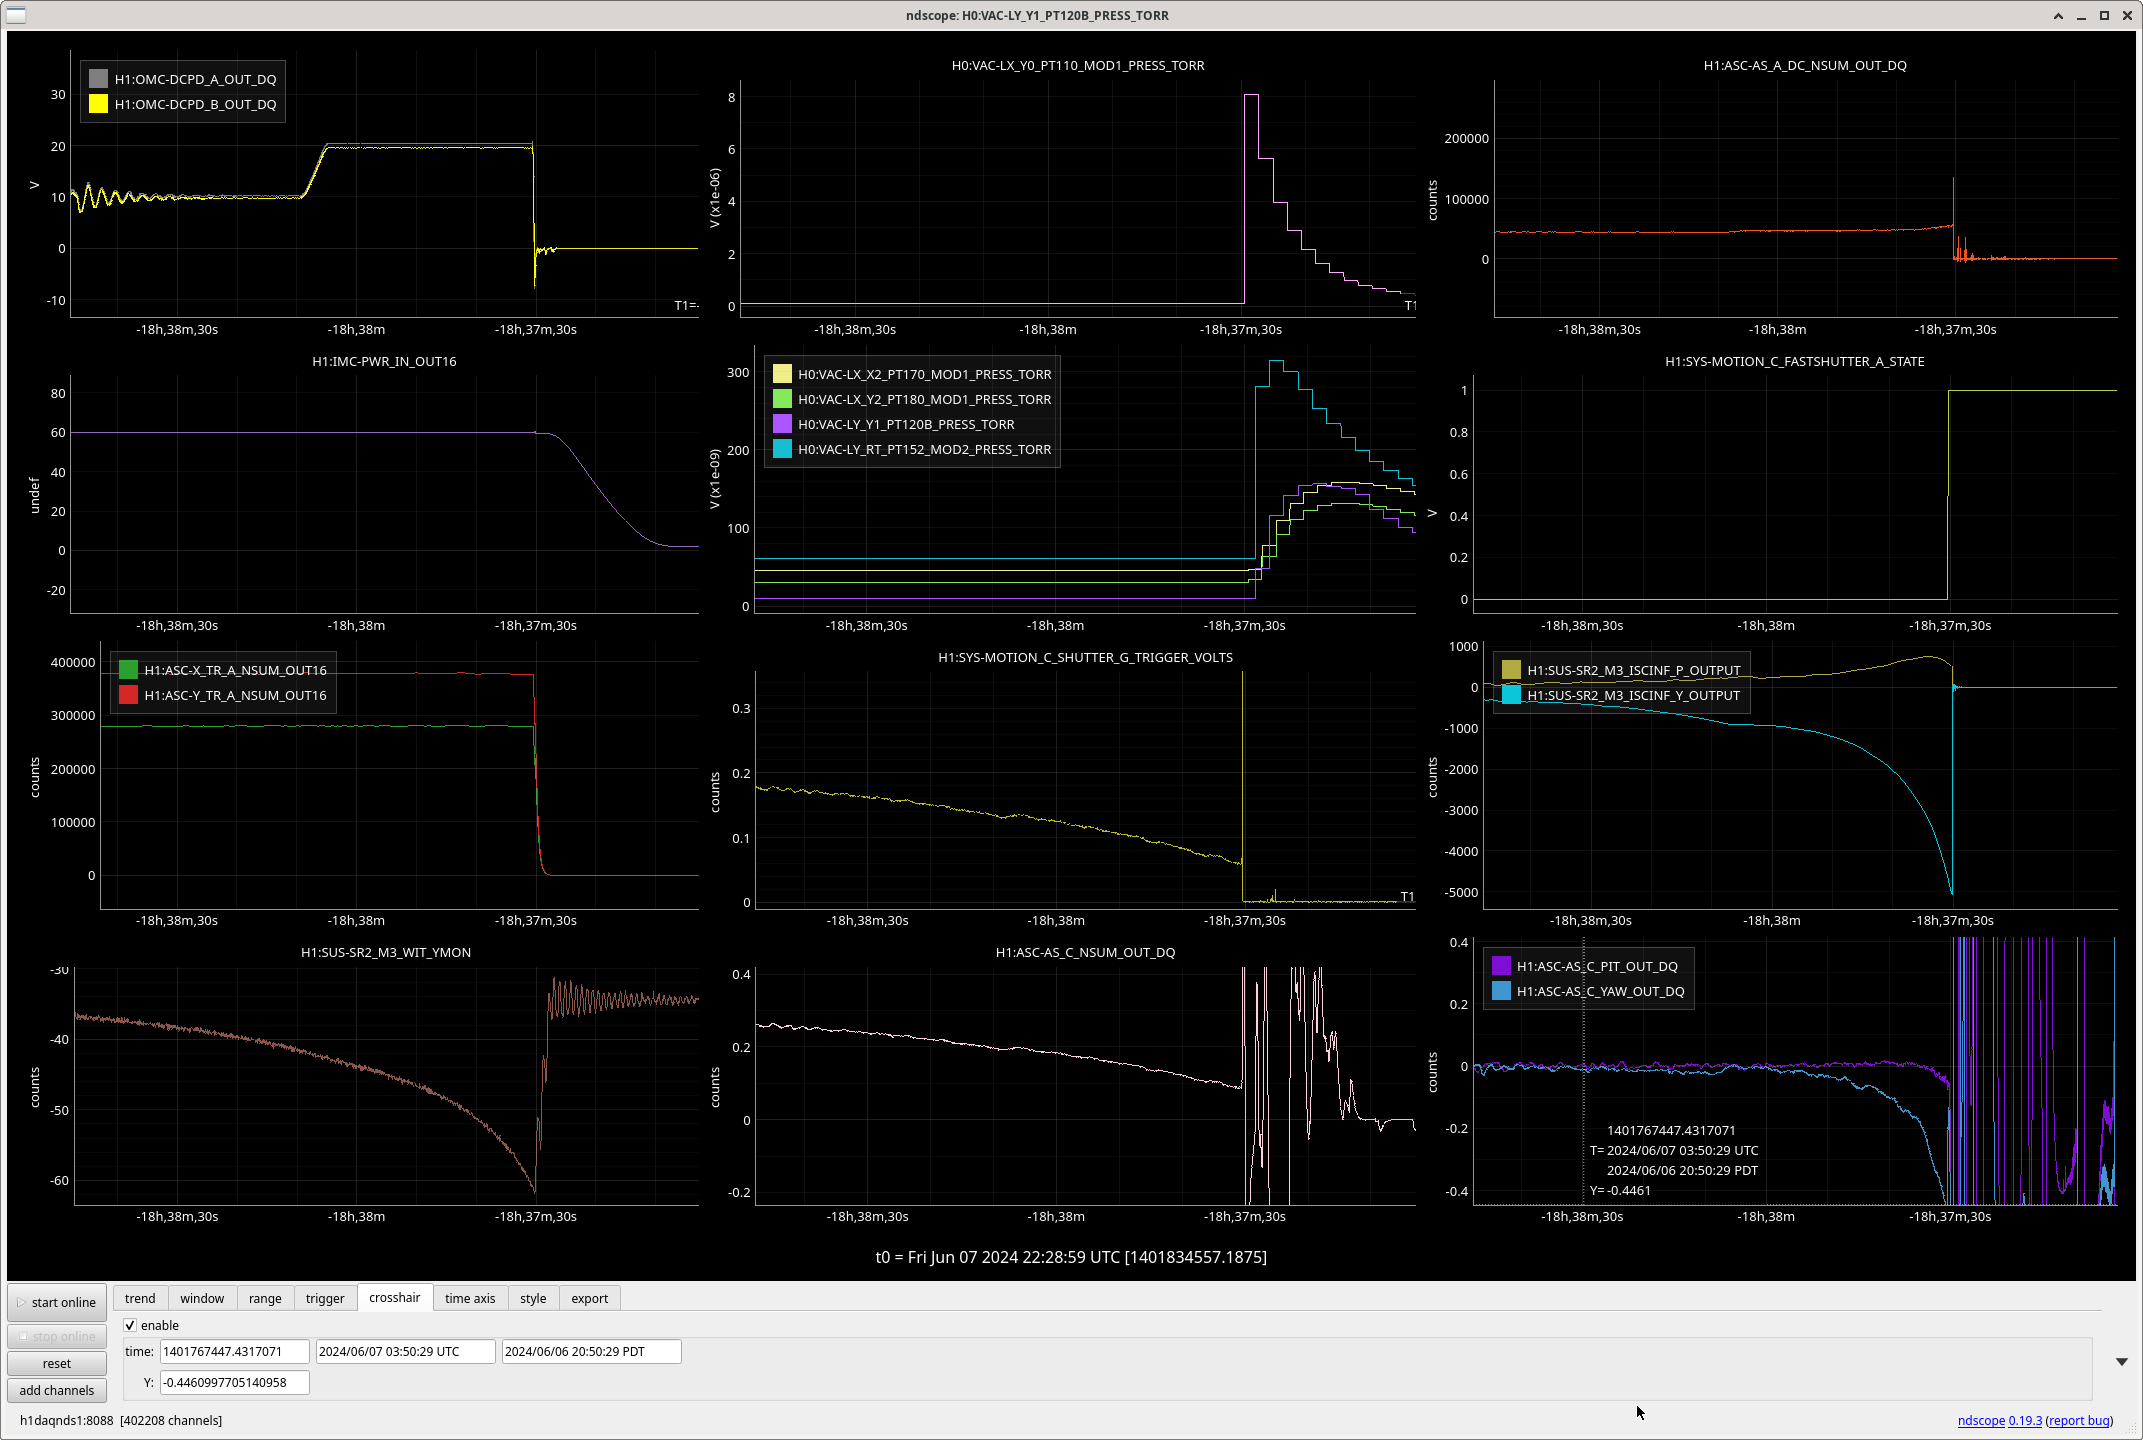
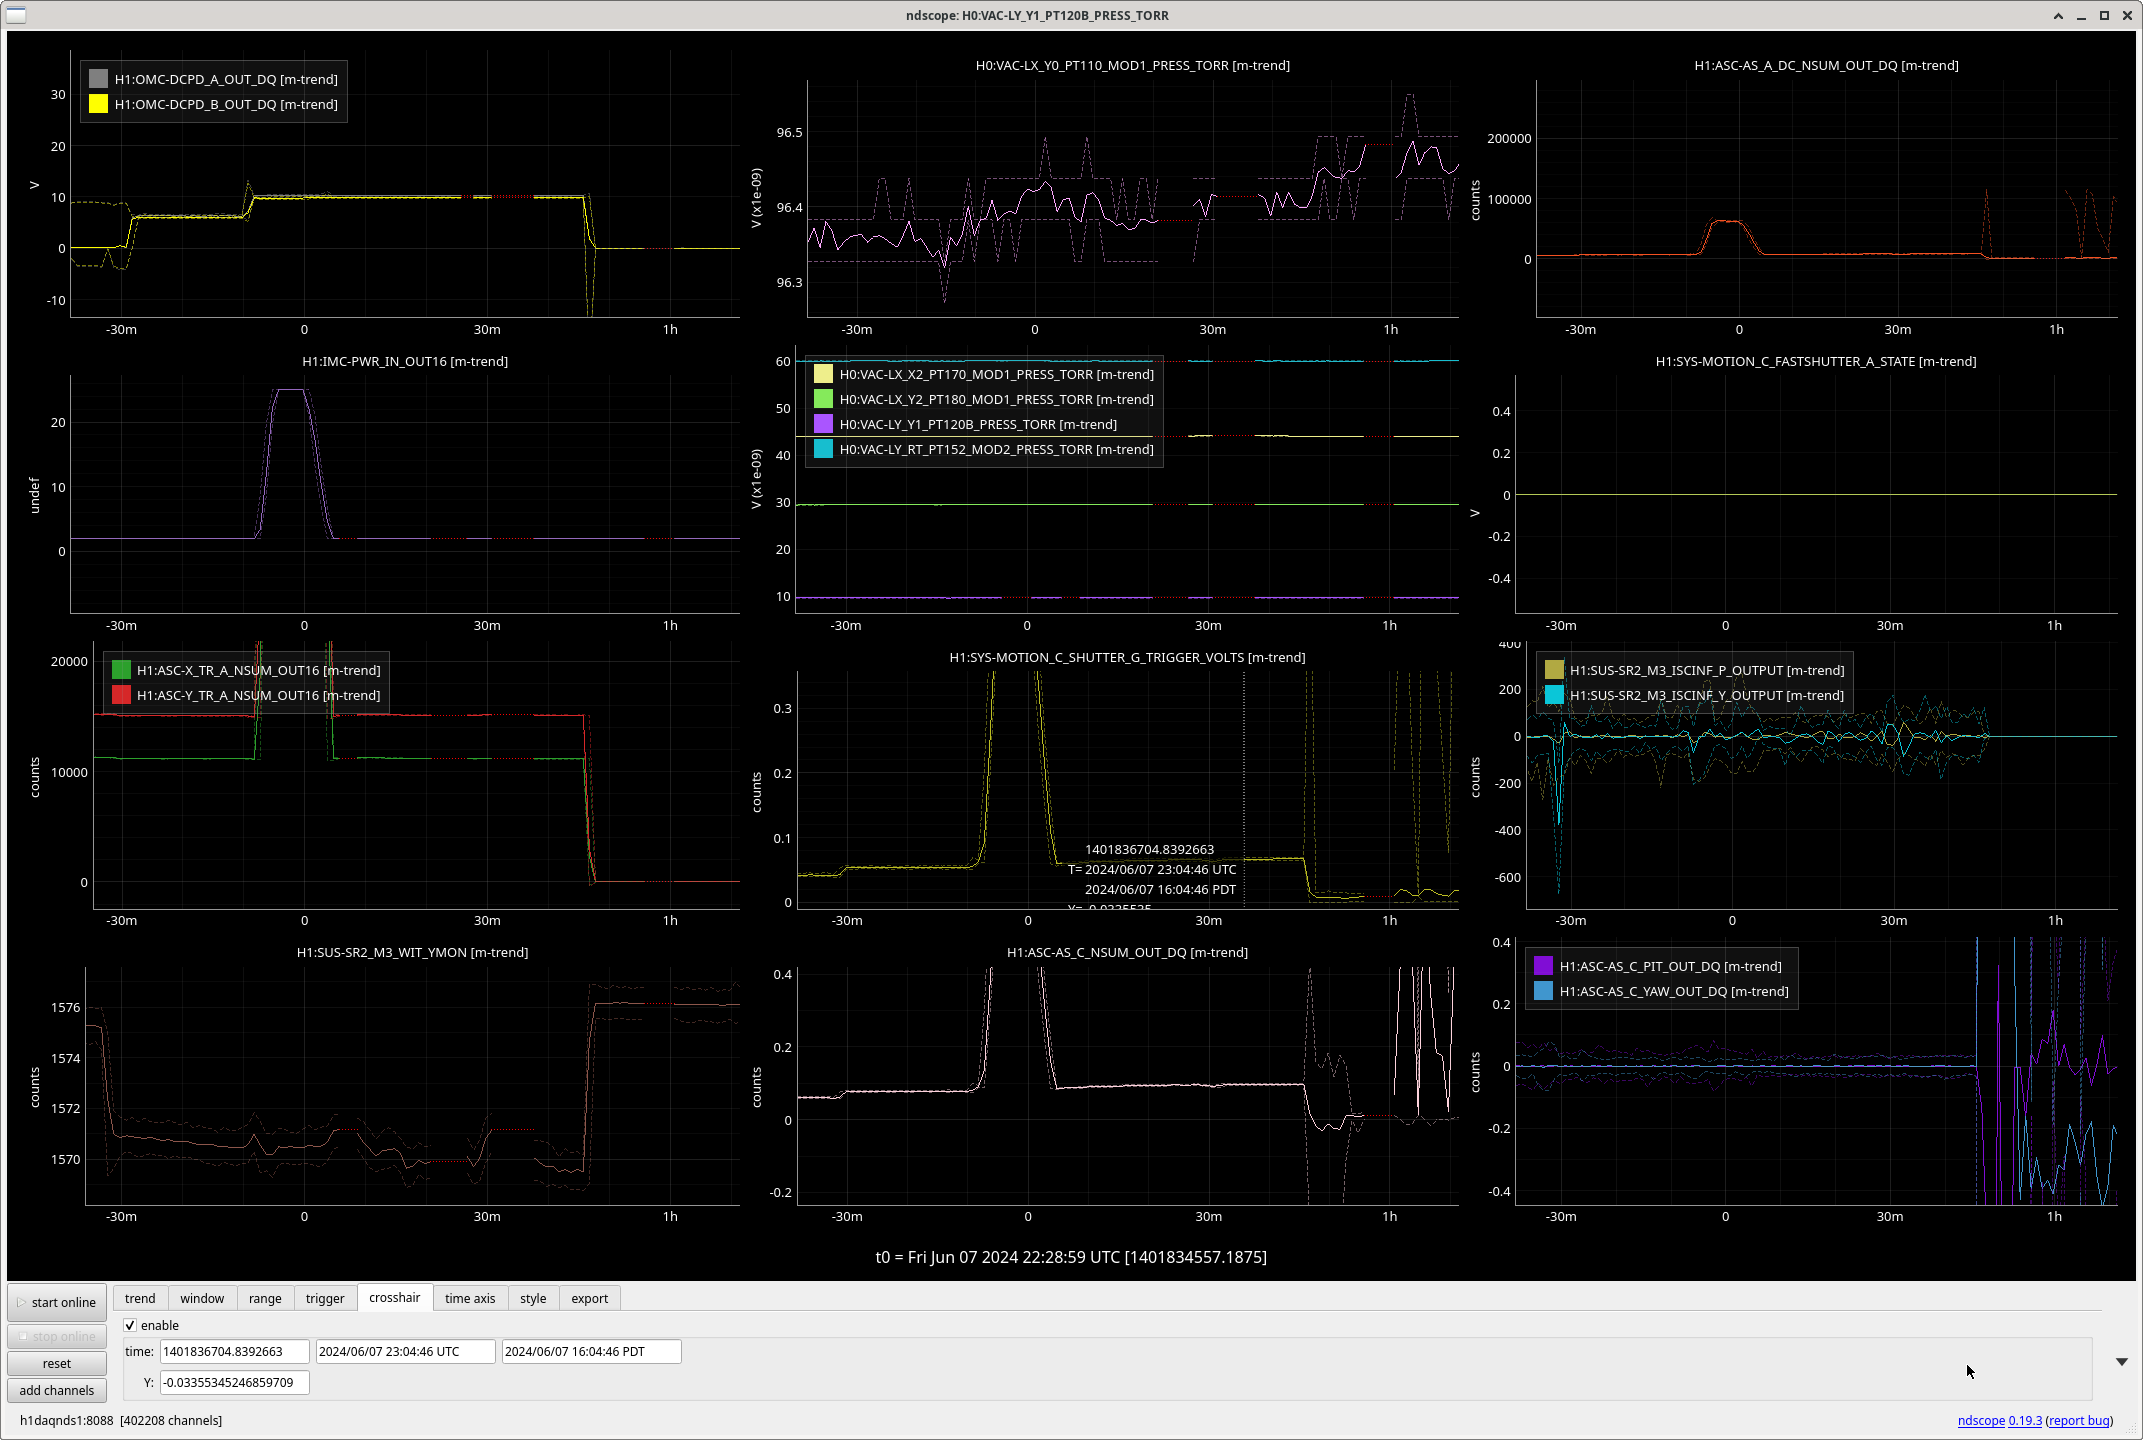
The attached figure shows the ringdown measurement. The decay time of FC TRANS and REFL are quite different and both of them are much larger than the expected 4 ms decay time. Also the decay start timing is different for TRANS and REFL. The decay of FC TRANS is not going to 0, which means there would be residual seed. The requesting OPO guardian to DOWN might not block the seed enough and this might be related to the dither locking, which is not working well.
EDIT: There is an elliptic low pass filter LP100 in FC trans IR PD, which would explain the different behavior of TRANS and REFL. We should turn off LP100 for ringdown measurement.
Bees are again nesting in a wire spool on the outdoor shelf by the corner station.
I took the script that we have been using to run our A2L and converted it to run the measurements for all quads and degrees of freedom at the same time, or less, as desired. The new script is (userapps)/isc/h1/scripts/a2l/a2l_min_multi.py. Today Sheila and I tested it for all quads with just Y with the results below. These values were accepted in SDF, updated in lscparams.py, and ISC_LOCK reloaded. More details about the script at the bottom of this log.
Results for ETMX Y
Initial: 4.99
Final: 4.94
Diff: -0.04999999999999982
Results for ETMY Y
Initial: 0.86
Final: 0.94
Diff: 0.07999999999999996
Results for ITMX Y
Initial: 2.93
Final: 2.89
Diff: -0.040000000000000036
Results for ITMY Y
Initial: -2.59
Final: -2.51
Diff: 0.08000000000000007
The script we used to use was (userapps)/isc/common/scripts/decoup/a2l_min_generic_LHO.py which was, I think, originally written by Vlad B. and then Jenne changed it up to work for us at LHO. I took this and changed a few things around to then call the optimiseDOF function for each desired quad and dof under a ThreadPool class from multiprocess to run all of the measurements simultaneously. We had to move or change filters in the H1:ASC-ADS_{PIT,YAW}{bank#}_DEMOD_{SIG, I, Q} banks so that each optic and dof is associated with a particular frequency and used the ADS banks 6-9. These frequencies needed to be spaced apart enought but still within our area of interest. We also had to engage notches for all of these potential lines in the H1:SUS-{QUAD}_L3_ISCINF_{P,Y} banks (FM6&7). We also accepted the ADS output matrix values in SDF for these new banks with a gain of 1.
This hasn't been tested for all quads and both P&Y, so far only Y.
ETMX sees an odd move ~100ms before the lock loss just like yesterday. The lock loss tool also has a DCPD tag.
Back to Observing at 2107UTC
Observing at 1932UTC. A bit of a delay wrapping up commissioning today, but we're back to observing and locked for 20 hours.
Jennie W, Keita, Sheila
Sheila suggested we move SRM to increase the coupled cavity pole as this got worse in the previous week.
Keita and I opened the SRC1_P and SRC1_Y loops (and turned off the offsets) then walked SRM in yaw and looked at the coupled cavity pole.
See image of the loop medm screen.
Its hard to see but moving down in SRM yaw on the sliders made the f_cc higher. We stopped due to the end of the commissioning period so maybe we could do more optimisation of this.
See the attached trend.
I set the offsets in the two loops to cancel out the INMON values at this new alignment, before closing them again.
These offsets have been changed in lscparams.py on lines 551 and 552 and accepted in OBSERVE.snap by TJ.
Robet mentioned while he was here that there was coherence with the ground current clamp in the vertex and DARM, and suggested that we try having both ITM biases set to 0V. I did that today, and accepted the bias gain of 0 in OBSERVE and SAFE.snaps.
Robert also found that we need to change the bias at EX, which we haven't done yet.
I ran the DARM offset step code starting at:
2024 Jun 13 16:13:20 UTC (GPS 1402330418)
Before recording this time stamp it records the PCAL current line settings and makes sure notches for 2 PCAL frequencies are set in the DARM2 filter bank.
It then puts all the PCAL power into these lines at 410.3 and 255Hz (giving them both a height of 4000 counts), and measures the current DARM offset value.
It then steps the DARM offset and waits for 120s each time.
The script stopped at 2024 Jun 13 16:27:48 UTC (GPS 1402331286).
In the analysis the PCAL lines can be used to calculate how the optical gain changes at each offset.
See the attached traces, where you can see that H1:OMC-READOUT_X0_OFFSET is stepped and the OMC-DCPD_SUM and ASC-AS_C respond to this change.
Watch this space for analysed data.
The script sets all the PCAL settings back to nominal after the test from the record it ook at the start.
The script lives here:
/ligo/gitcommon/labutils/darm_offset_step/auto_darm_offset_step.py
The data lives here:
/ligo/gitcommon/labutils/darm_offset_step/data/darm_offset_steps_2024_Jun_13_16_13_20_UTC.txt
See the results in the attached pdf also found at
/ligo/gitcommon/labutils/darm_offset_step/figures/plot_darm_optical_gain_vs_dcpd_sum/all_plots_plot_darm_optical_gain_vs_dcpd_sum_1402330422_380kW__Post_OFI_burn_and_pressure_spikes.pdf
The contrast defect is 0.889 ± 0.019 mW and the true DASRM offset 0 is 0.30 counts.
I plotted the power at the antisymmetric port as in this entry to find out the loss term between the input to HAM6 and the DCPDs, which in this case is (1/1.652) = 0.605 with 580.3 mW of light at the AS port insensitive to DARM length changes.
From Jennie's measurement of 0.88 mW contrast defect, and dcpd_sum of 40mA/resp = 46.6mW, this implies an upper bound on the homodyne readout angle of 8 degrees.
This readout angle can be useful for the noise budget (ifo.Optics.Quadrature.dc=(-8+90)*np.pi/180)
and analyzing sqz datasets e.g. May 2024, lho:77710.
Table of readout angles "recently":
|
|
|
alog | ||
O4a | Aug 2023 | 46.6 mW | 1.63 mW | 10.7 deg | lho71913 |
ER16 | 9 March 2024 | 46.6 mW | 2.1 mW | 12.2 deg | lho76231 |
ER16 | 16 March 2024 | 46.6 mW | 1.15 mW | 9.0 deg | lho77176 |
O4b | June 2024 | 46.6 mW | 0.88 mW | 8.0 deg | lho78413 |
O4b | July 2024 | 46.6 mW | 1.0 mW | 8.4 deg | lho79045 |
##### quick python terminal script to calculate #########
# craig lho:65000
contrast_defect = 0.88 # mW # measured on 2024 June 14, lho78413, 0.88 ± 0.019 mW
total_dcpd_light = 46.6 # mW # from dcpd_sum = 40mA/(0.8582 A/W) = 46.6 mW
import numpy as np
darm_offset_power = total_dcpd_light - contrast_defect
homodyne_angle_rad = np.arctan2(np.sqrt(contrast_defect), np.sqrt(darm_offset_power))
homodyne_angle_deg = homodyne_angle_rad*180/np.pi # degrees
print(f"homodyne_angle = {homodyne_angle_deg:0.5f} deg\n")
##### To convert between dcpd amps and watts if needed #########
# using the photodetector responsivity (like R = 0.8582 A/W for 1064nm)
from scipy import constants as scc
responsivity = scc.e * (1064e-9) / (scc.c * scc.h)
total_dcpd_light = 40/responsivity # so dcpd_sum 40mA is 46.6mW
Thu Jun 13 10:10:35 2024 INFO: Fill completed in 10min 32secs
Gerardo confirmed a good fill curbside.
Ran the usual broadband and simulines sweep starting at 1538UTC.
Simulines start:
PDT: 2024-06-13 08:46:11.048813 PDT
UTC: 2024-06-13 15:46:11.048813 UTC
GPS: 1402328789.048813
Simulines end:
PDT: 2024-06-13 09:07:41.142373 PDT
UTC: 2024-06-13 16:07:41.142373 UTC
GPS: 1402330079.142373
Files:
024-06-13 16:07:41,052 | INFO | File written out to: /ligo/groups/cal/H1/measurements/DARMOLG_SS/DARMOLG_SS_20240
613T154612Z.hdf5
2024-06-13 16:07:41,060 | INFO | File written out to: /ligo/groups/cal/H1/measurements/PCALY2DARM_SS/PCALY2DARM_SS
_20240613T154612Z.hdf5
2024-06-13 16:07:41,066 | INFO | File written out to: /ligo/groups/cal/H1/measurements/SUSETMX_L1_SS/SUSETMX_L1_SS
_20240613T154612Z.hdf5
2024-06-13 16:07:41,071 | INFO | File written out to: /ligo/groups/cal/H1/measurements/SUSETMX_L2_SS/SUSETMX_L2_SS
_20240613T154612Z.hdf5
2024-06-13 16:07:41,076 | INFO | File written out to: /ligo/groups/cal/H1/measurements/SUSETMX_L3_SS/SUSETMX_L3_SS
_20240613T154612Z.hdf5
A second simulines was ran after Francisco made some changes. Below is the info of that simulines.
Start:
PDT: 2024-06-13 09:55:53.982484 PDT
UTC: 2024-06-13 16:55:53.982484 UTC
GPS: 1402332971.982484
End:
PDT: 2024-06-13 10:17:24.832414 PDT
UTC: 2024-06-13 17:17:24.832414 UTC
GPS: 1402334262.832414
Files:
2024-06-13 17:17:24,764 | INFO | File written out to: /ligo/groups/cal/H1/measurements/DARMOLG_SS/DARMOLG_SS_20240613T165554Z.hdf
5
2024-06-13 17:17:24,771 | INFO | File written out to: /ligo/groups/cal/H1/measurements/PCALY2DARM_SS/PCALY2DARM_SS_20240613T16555
4Z.hdf5
2024-06-13 17:17:24,776 | INFO | File written out to: /ligo/groups/cal/H1/measurements/SUSETMX_L1_SS/SUSETMX_L1_SS_20240613T16555
4Z.hdf5
2024-06-13 17:17:24,780 | INFO | File written out to: /ligo/groups/cal/H1/measurements/SUSETMX_L2_SS/SUSETMX_L2_SS_20240613T16555
4Z.hdf5
2024-06-13 17:17:24,785 | INFO | File written out to: /ligo/groups/cal/H1/measurements/SUSETMX_L3_SS/SUSETMX_L3_SS_20240613T16555
4Z.hdf5
TITLE: 06/13 Day Shift: 1430-2330 UTC (0730-1630 PST), all times posted in UTC
STATE of H1: Observing at 150Mpc
OUTGOING OPERATOR: Ryan C
CURRENT ENVIRONMENT:
SEI_ENV state: CALM
Wind: 5mph Gusts, 3mph 5min avg
Primary useism: 0.02 μm/s
Secondary useism: 0.12 μm/s
QUICK SUMMARY: Locked for 15 hours, calm environment. Planned calibration and commissioning today from 830-1200PT.
TITLE: 06/13 Eve Shift: 2300-0800 UTC (1600-0100 PST), all times posted in UTC
STATE of H1: Observing at 153Mpc
INCOMING OPERATOR: Ryan C
SHIFT SUMMARY: Fairly quiet shift with H1 observing most of the time. H1 has now been locked for 8.5 hours.
LOG:
No log for this shift.
I was asked what needs to be done to convert kappa c into real physical units [mA/pm]. KappaC is a dimensionless number that represents the current optical gain as a fraction of what it was at some point in the past. In O4 that time corresponds to when the front end calibration was last updated (or 'exported'). You can see a list of calibration reports that have been exported to the front end on the H1 cal page. The entries with the 'exported' tag were used to update the front end and are used as reference for KappaC afterwards until the front end is updated once again. Since the meaning of KappaC=1 changes over time, you cannot easily trend the KappaC channel over long periods of time to compare optical gain values (yet*). You have to be sure to look at the most recently exported report and look up the optical gain (shown on the first page of the report PDF and in the enclosed pydarm_H1.ini file as "coupled_cavity_optical_gain). Moreover, the optical gain is reported in [DARM_ERR counts/m], not in physical units. To convert to mA/m (or mA/pm) we need to take the transfer function OMC-DCPD_SUM_OUT/DARM_IN1 [mA/ct]. However, this TF can change from lock to lock (see LHO:76000 for some discussion of this). So, given a particular GPS time, if you want to convert KappaC to mA/m you need to get the latest exported report to figure out what KappaC is in DARM_ERR cts/m, measure the OMC-DCPD_SUM_OUT/DARM_IN1 [mA/cts] transfer function (this is pretty flat so really you can condense this to a single number instead of a frequency dependent array) and multiply them. Ultimately, you end up with the following conversion: KappaC * Opt gain [DARM_ERR cts/m] * OMC-DCPD_SUM_OUT/DARM_IN1 [mA/cts] = Opt gain [mA/m] I've written a script that does this. It takes a single argument: the time at which to evaluate the optical gain. It uses the functionality I set up for a component of the noise budget (first mentioned in LHO:76000). On gitlab the script lives at https://git.ligo.org/louis.dartez/pydarm-utils/-/blob/4018924870892f1f3ecd2fb7281e47f5df2a3f29/scripts/optical_gain.py. On the workstation, it currently lives at /ligo/home/louis.dartez/repos/pydarm-utils/scripts/optical_gain.py To run the script: 1.) activate the pydarm-utils environment:conda activate /ligo/home/louis.dartez/conda/pydarm-utils
2.) runpython /ligo/home/louis.dartez/repos/pydarm-utils/scripts/optical_gain.py TIME
, where TIME is either a GPS time or a date string (use the -h option for formatting) It will download 10 minutes of data starting at the provided time so it may take a short while. Here is what the output should look like:(/ligo/home/louis.dartez/conda/pydarm-utils) louis.dartez@cdsws22: python optical_gain.py 1397102112.6 Using reference report: 20240330T211519Z Reference optical gain [DARM_ERR cts/m]: 3438377.6611055154 ________________________________________________________________________________ [Memory] Calling pydarm_utils.io.gwpy_utils.get_data... get_data([ 'H1:OMC-DCPD_SUM_OUT_DQ', 'H1:LSC-DARM1_IN1_DQ', 'H1:CAL-CS_TDEP_KAPPA_C_OUTPUT'], 1397102112.6, 1397102712.6) Opening new connection to nds.ligo-wa.caltech.edu... connected [nds.ligo-wa.caltech.edu] set ALLOW_DATA_ON_TAPE='True' Checking channels list against NDS2 database... done Downloading data: |█████████████████████████████████████████████████████████████| 601.0/601.0 (100%) ETA 00:00 _________________________________________________________get_data - 9.4s, 0.2min KappaC: 1.0068259239196777 Optical gain [DARM_ERR cts/m]: 3461847.765427341 DARM_IN1/OMC-DCPD_SUM_OUT [DARM_ERR cts/mA]: 4.0557094393989246e-07 optical gain [mA/pm]: 8.535739103490618
State of H1: Observing at 156Mpc and locked for 4 hours.
[SQZ] SQZ dropped out at 02:07 UTC, but Guardians were able to bring everything back on their own. After that, since H1 was already out of observing, I ran SQZ_MANAGER through SCAN_SQZANG since it had been noted earlier that SQZ could be better. I saw marginal improvements in DARM and range (only about 1-2Mpc), and H1 resumed observing at 02:13 UTC.
[SEI] H1 entered earthquake mode at 03:13 UTC suddenly from a Picket Fence network peak. I noticed the US.HWUT.00.BHZ station channel was highlighted in orange and the trend was drifting around in a non-real ground motion-like way, so I expect this to be a false alarm trigger as no on-site ground motion sensors saw any sudden motion. Seismic configuration went back to CALM 10 minutes later at 03:23 UTC.
Ryan C. pointed out to me that something like this errant Picket Fence trigger has happened before (alog77554), but the peaks in the cases this evening weren't nearly as high as in that instance.
SheilaD, ThomasS, FranciscoL
Wrote a script to change
H1:SUS-ETMX_L3_DRIVEALIGN_L2L_GAIN
H1:CAL-CS_DARM_FE_ETMX_L3_DRIVEALIGN_L2L_GAIN
using the mean of the last 30 minutes of H1:CAL-CS_TDEP_KAPPA_TST_OUTPUT. This script will be tested before making calibration measurements, next Thursday (manifest a locked IFO).
The reason we are changing the gains is because we want to maintain the DARM open loop the same, and SRCL and MICH feedforward stable. We use KAPPA_TST because it is a monitor of how much the gains are changing - it should be 1, ideally.
The script filters the data where KAPPA_TST does not change for more than 20 seconds - see drivealign_kappa_tst_1401031920-1401044520.pdf - to avoid weighting the mean, and changes the gains with respect to the percentage that KAPPA_TST is from 1. The attached plots were used to test the script at different gps times. "drivealign_allchannels_*.pdf"
plots the retreived channels from gwpy. "drivealign_kappa_tst*.pdf" plots the results from the
filtering
process.
The top plot is subtracting the values of KAPPA_TST, if the difference is zero it will start filtering (after 20 seconds). The two bottom-left figures show KAPPA_TST, one (top) without filtering and the other one (bottom) filtering the data. The bottom left are histograms taking (top) all the data, and (bottom) the filtered data. The script has arguments to run without plotting, or without changing the values. The output of the script that produced the attached plots is saved on terminal.txt.
The script is currently in: /ligo/home/francisco.llamas/commissioning/KappaToDrivealign.py
Jennie W, Sheila, TJ
This is done to reduce the coupling we get to length from having off-centre spot positions on the mirrors.
The script can be found in userapps/isc/common/scripts/decoup/a2l_min_generic_LHO.py .
See the steps the script runs in the bottom two plots and the reponse of the ADS demodulated signals in the top plots.
I ran ETMX P and Y first by calling the script with
python a2l_min_generic_LHO ETMX BOTH
changed P and Y
H1:SUS-ETMX_L2_DRIVEALIGN_P2L_SPOT_GAIN => 3.22
H1:SUS-ETMX_L2_DRIVEALIGN_Y2L_SPOT_GAIN => 4.99
ETMY
both P and Y changed
H1:SUS-ETMY_L2_DRIVEALIGN_P2L_SPOT_GAIN => 4.3
H1:SUS-ETMY_L2_DRIVEALIGN_Y2L_SPOT_GAIN => 0.92
ITMX
both P and Y changed
H1:SUS-ITMX_L2_DRIVEALIGN_P2L_SPOT_GAIN => -0.99
H1:SUS-ITMX_L2_DRIVEALIGN_Y2L_SPOT_GAIN => 2.88
ITMY
H1:SUS-ITMY_L2_DRIVEALIGN_P2L_SPOT_GAIN => -0.36
H1:SUS-ITMY_L2_DRIVEALIGN_Y2L_SPOT_GAIN => -2.5
16:35:52 UTC all A2L gains set and script finished.
CHARD_Y coupling was still bad so we reran Y degree of freedom for all test masses.
ETMX
Want to change gain from 4.99 to 4.98, rounded to 2 decimal places. St.Div is 0.925. Change of 0.01
H1:SUS-ETMX_L2_DRIVEALIGN_Y2L_SPOT_GAIN => 4.98
ETMY
Want to change gain from 0.92 to 0.93, rounded to 2 decimal places. St.Div is 0.145. Change of -0.007
H1:SUS-ETMY_L2_DRIVEALIGN_Y2L_SPOT_GAIN => 0.93
ITMY
Want to change gain from -2.5 to -2.5, rounded to 2 decimal places. St.Div is 1.0. Change of -0.001
Gain did not change.
3 A2Ls changed by 17:33:32 UTC.
ITMX
Want to change gain from 2.88 to 2.87, rounded to 2 decimal places. St.Div is 0.496. Change of 0.01
H1:SUS-ITMX_L2_DRIVEALIGN_Y2L_SPOT_GAIN => 2.87
3 A2Ls changed by 17:33:32 UTC.
I don't think these values made it into lscparams' dictionary a2l_gains['FINAL'] (starting around line 451 in lscparams.py), so they were reverted for the next lock, and they were accepted as the previous values in alog 78383.
Keita, Sheila,Robert, TJ, Jennie, Corey, Tony
Dave and Gerardo alerted us that there have been vacuum spikes after locklosses in HAM6 yesterday. We are looking at what circulating powers were and what the lockloss transient was at the time of locklosses that caused and didn't cause a vacuum spike in HAM6. Here is a comparison table:
time | AS_C peak | POP A LF | which alignment | spike? |
6/7 1:12:35 | 0.938*10 = 9.378 | 5505 | bad | 3.6e-8 |
6/7 3:04:08 | 1.35*60 = 81 | 26739 | bad | 4.28e-8 |
6/7 03:51:29 | 1.05*60 = 63 | 27032 | bad | 1.5e-7 |
6/7 23:15:54 UTC | 0.342*2 =0.684 | 1109 | good | no |
6/7 20:54 UTC | 1.58*2= 3.16 | 651 | good, PRG was tanking | no |
In the bad alignment, the beam was clipped on it's way to AS_C, so that diode wasn't catching all the power it would have in the good alignment. AS_A and AS_B saturate at the time of locklosses.
The spike in vacuum pressure was higher with each successive lockloss, although the power on AS_C was largest in the second one.
One of the three pressure spikes from yesterday was the lock loss from 10W, others were from 60W.
1st plot shows the worst one in terms of the pressure spike (the last one at 6/7 1:12:35 UTC, 60W).
This doesn't tell us the cause of the pressure spike, that requires different investigations.
Anyway, the 2nd plot shows the lockloss from today after Sheila, Jennie and TJ moved to a better alignment.
SR2 doesn't move much over the power range from 2W to 25W, and ASC-AS_C_NSUM doesn't show the sign of clipping. Everything looks saner and thus better.
The only concern is if this "better" alignment will still burn things in HAM6. We haven't observed pressure spikes from 2W lock losses with this alignment today but that only happened twice.
To clarify, "bad" alignment that produced pressure spikes was only for Thursday, and the "better" alignment today is supposed to be the same as or at least quite similar to pre-Thursday. Since we haven't had any pressure spikes with pre-Thur. alignment, I doubt that we'll see any pressure spikes with this alignment either.
However, picos had to be moved by large amount to go from pre-Thur. to Thur. and then to Fri. alignment. Even though Fri. alignment should be clouse to pre-Thur., we expect some not-so-large difference in the WFS sled centering, thus in the HAM6 alignment.
Out of caution, we'd like to see that losing lock at 10W won't cause pressure spikes before proceeding further. We chose 10W, because a pressure spike was observed at that power with a loss of lock with a bad (Thu.) alignment. If we don't see any spike for many lock losses with current (Fri.) alignment it would be safe to proceed.
Since automated DC lock won't work for this "good" alignment yet (that problem existed before Thursday and it seems to persist today), Sheila and I asked Tony to lock the IFO, bring it to 10W with RF, kill lock and observe pressure. If there's a spike he will stop, otherwise he will repeat.
We'll reconvene tomorrow.
Attached is an annotated HAM6 picture.
Also, plots with more piranis showing all three pressure spikes was posted in alog 78327.
Since FS seems to have worked, potential point that could have made pressure spikes are: