WP 11914
ECR E2200401
Drawing D1301004
A PEM AA Chassis was installed in the H1-TCS-XC1 rack, slots U10/11. The AI Chassis D1101785 was moved to slots U13/14. An ADC card and adapter card were installed in the h1iscex IO chassis (third Adneco, first slot). The PEM AA chassis is part of the PEM upgrade ECR E2200401. Chassis will be used for testing of the LIGO DAC32 card.
PEM AA Chassis: Serial Number S2300112
D. Barker, F. Clara, M. Pirello E. Von Reis
Tue Jun 11 10:11:49 2024 INFO: Fill completed in 11min 45secs
Gerardo confirmed a good fill curbside.
There was a small typo on for a filter bank SUS-ITMX_L3_LOCK_L on line 55. By the time I noticed this and fixed it, it delayed it by ~7 min. The measurement completed and we lost lock about a minute afterward, but this seems more like a coincidence.
TITLE: 06/11 Day Shift: 1430-2330 UTC (0730-1630 PST), all times posted in UTC
STATE of H1: Lock Acquisition
OUTGOING OPERATOR: Ryan C
CURRENT ENVIRONMENT:
SEI_ENV state: CALM
Wind: 1mph Gusts, 0mph 5min avg
Primary useism: 0.01 μm/s
Secondary useism: 0.14 μm/s
QUICK SUMMARY:Locked for 29.5 hours! Magnetic injections currently running. We have a 6 hours maintenance window today.
Workstations were updated and rebooted. OS packages were updated. Conda packages were not updated.
TITLE: 06/11 Eve Shift: 2300-0800 UTC (1600-0100 PST), all times posted in UTC
STATE of H1: Observing at 148Mpc
INCOMING OPERATOR: Ryan C
CURRENT ENVIRONMENT:
SEI_ENV state: CALM
Wind: 3mph Gusts, 1mph 5min avg
Primary useism: 0.02 μm/s
Secondary useism: 0.13 μm/s
SHIFT SUMMARY:
H1 has been locked and observing all shift which is now 23 hours.
Everything seems to be running well.
Cosmic crew still staged in the MPR.
LOG:
Start Time | System | Name | Location | Lazer_Haz | Task | Time End |
---|---|---|---|---|---|---|
21:03 | SAF | HAZARD | LVEA | YES | LVEA is Laser HAZARD | 23:31 |
15:52 | imax | Film Crew | control room | - | COSMIC crew in Control Room | 21:18 |
20:37 | pcal | francisco.rick | pcalLab | yes | Pcal work | 01:27 |
22:48 | sqz | terry | opticsLab | yes | terry | 00:20 |
01:42 | IMAX | Cosmic Cast & Crew | Roof | N | Drone shots & interview | 04:38 |
01:44 | IMAX | Richard & Co | EX/4 | N | going half way to mid X & Tube enclosure | 03:44 |
FAMIS 26308 HVAC Vibrometer fans
The H0:VAC-MY_FAN1_270_1_ACC_INCHSEC saw a decrease in signal 3.5 days ago that also looks like it have more noise on the signal.
TITLE: 06/10 Eve Shift: 2300-0800 UTC (1600-0100 PST), all times posted in UTC
STATE of H1: Observing at 148Mpc
OUTGOING OPERATOR: Corey
CURRENT ENVIRONMENT:
SEI_ENV state: SEISMON_ALERT
Wind: 13mph Gusts, 10mph 5min avg
Primary useism: 0.04 μm/s
Secondary useism: 0.13 μm/s
QUICK SUMMARY:
H1 Has been locked for 14 hours and 20 minutes and is currently OBSERVING.
All systems seem to be functioning well.
TITLE: 06/10 Day Shift: 1430-2330 UTC (0730-1630 PST), all times posted in UTC
STATE of H1: Observing at 127Mpc
INCOMING OPERATOR: Tony
SHIFT SUMMARY:
For the morning H1 was in Observe (from Tony at 2am!) and shortly later we transitioned to Commissioning. (much of this occurring under a glow of blue light from the visiting film crew!)
The film crew completed multiple shots of Nergis, and filmed interviews with Sheila, Ibrahim, and Corey. And we had lots of extras in the Control Room as well. This work was mostly done after 1pm (they then moved to the Staging Building, LExC (early eve), and other shots?).
LOG:
J. Kissel Here're the first results of looking at the channel's whose differential inputs I'd shorted to ground the other day (LHO:78302); the inputs to the AA chassis that feed ADC2 on the SEI H23 computer (and ADC2 is used to readout all of the HAM3 ISI's sensors and monitor signals.) I'm happy to report that it's not that interesting: (1) We model all of these 16-bit, General Standards (16AI64SSA) ADC channels used in differential mode to asymptote to 3.6e-6 [V/rtHz], or ~4 [uV/rtHz] above 100 Hz, and to start getting worse than that below 10 Hz, eventually rising in noise inversely proportional to frequency ("rising with a 1/f slope below 10 Hz"). (2) First attachment shows these four channels agree with, for the most part, with the asymptotes at 3.53e-6, 4.14e-6, 3.17e-6, and 3.24e-6 [V/rtHz] at 1000 Hz, so a range of 3.66e-6 +/- 13%, and the slope of noise increase at the low-frequency end agrees the xpected rise. (3) I'm a little bit sad that the 50-400 Hz region (see second attachment for zoom) which seems to have wide 5-20 Hz wide features that get as loud as 10 to 14 [uV/rtHz] at ~[55, 72, 95, 145, 165, 190, 220, 285, 370] Hz but I don't have time to investigate (e.g. the first thing I would do would be to check if these features have coherence with the other channels on this ADC that have real ISI sensor signals). More to come on coupling to the DuoTone signals.
On Friday 06/07/2024 Dave Barker sent an email to the vacuum group noting 3 spikes on the pressure of the main vacuum envelope, I took a closer look at the 3 different events and noticed that the events correlated to the IFO losing lock. I contacted Dave, and together we contacted the operator, Corey, who made others aware of our findings.
The pressure "spikes" were noted by different components integral to the vacuum envelope. Gauges noted the sudden rise on pressure, and almost at the same time ion pumps reacted to the rise on pressure. The outgassing was noted on all stations, very noticeable a the mid stations, and with less effect at both end stations, and for both with a delay.
The largest spike for all 3 events is noted at HAM6 gauge, we do not have a gauge at HAM5 or HAM4. The one near HAM6 is the one on the relay tube that joins HAM5/7 (PT152), with the restriction of the relay tube, then the next gauge is at BSC2 (PT120), however the spike is not as "high" as the one noted on HAM6 gauge.
A list of aLOGs made by others related to the pressure anomalies and their findings:
https://alog.ligo-wa.caltech.edu/aLOG/index.php?callRep=78308
https://alog.ligo-wa.caltech.edu/aLOG/index.php?callRep=78320
https://alog.ligo-wa.caltech.edu/aLOG/index.php?callRep=78323
https://alog.ligo-wa.caltech.edu/aLOG/index.php?callRep=78343
Note: the oscillation visible on the plot of the outer stations (Mids and Ends) is the diurnal cycle, nominal behavior.
Of live working gauges, PT110 appears closest to the source based on time signature. This is on the HAM5-7 relay tube and only indirectly samples HAM6*. It registered a peak of 2e-6 8e-6 Torr with decay time of order 30 17s. Taking a HAM as sample volume (optimistic) this indicates at least 0.02 0.08 torr-liters of "something" must have been released at once. The strong visible signal at mid- and end-stations suggests it was not entirely water vapor, as this should have been trapped in CP's.
For reference, a mirror in a 2e-6 Torr environment intercepts about 1 molecular monolayer per second. Depending on sticking fraction, each of these gas pulses could deposit of order 100 monolayers of contaminant on everything.
The observation that the IFO still works is comforting; maybe we should feel lucky. However it seems critical to understand how (for example) the lock loss energy transient could possibly hit something thermally unstable, and to at least guess what material that might be. Recall we have previously noted evidence of melted glass on an OMC shroud.
Based on the above order-of-magnitude limits, similar gas pulses far too small to see on pressure gauges could be damaging the optics.
It would be instructive to compare before/after measures of arm, MC, OMC, etc. losses, to at least bound any acquired absorption
*corrected, thanks Gerardo
Corner RGA scans were collected today during maintenance, using RGA on Output tube. RGA volume has been open to main volume since last pumpdown ~March 2024, but electronics head/filament was turned off due to the small fan on the electronics head not spinning during observing. Unable to connect to HAM6 RGA, through either RGA computer in control room, or locally at unit with laptop. Only Output tube RGA available at this time.
Small aux cart and turbo was connected to RGA volume on output tube, then RGA Volume isolated from main volume and the filament turned on. The filament had warmed for ~2 hours prior to RGA scans being collected.
RGA Model: Pfeiffer PrismaPlus
AMU Range: 0-100
Chamber Pressure: 1.24E-8 torr on PT131(BSC 3), and 9.54E-8 torr on PT110 (HAM6), NOTE: Cold Cathode gauge interlocks tripped during filming activings in LVEA today, BSC2 pressure not recorded
Pumping Conditions: 4x 2500 l/s Ion Pumps and 2x 10^5 l/s cryopumps, HAM6 IP and HAM7/Relay tube
SEM voltage: 1200V
Dwell time: 500ms
Pts/AMU: 10
RGAVolume scans collected with main volume valve closed, only pumping with 80 l/s turbo aux cart
Corner scans collected with main volume valve open, and aux cart valve closed
Comparison to March 2024 scan provided as well.
Richard posting from Robert S.
I had a work permit to remove viewports so I opened the two viewports on the -Y side of HAM6. I used one of the bright LED arrays at one viewport and looked through the other viewport so everything was well lit. I looked for any evidence of burned spots, most specifically on the fast shutter or in the area where the fast shutter directs the beam to the cylindrical dump. I did not see a damaged spot but there are a lot of blocking components, so not surprising. I also looked at OM1 which is right in front of the viewports. I looked for burned spots on the cables etc but didnt see any. I tried to see if there were any spots on the OMC shroud, or around OM2 and OM3, the portions that I could see. I didnt see anything, but I think its pretty unlikely that I could have seen something.
Repeated 0-100AMU scans of the corner today, after filament had full 24 hours to warm up. Same scan parameters as above June 11th scans. Corner pressure 9.36e-9 Torr, PT 120.
Dwell time 500 ms
Attached is comparison to yesterday's scan, and compared to the March 4th 2024 scan after corner pumpdown.
There is a significant decrease in AMU 41, 43 and 64 compared to yesterday's scan.
Raw RGA text files stored on DCC at T2400198
Andrei, Sheila, Naoki
We've tried to link the observable whistles with working VCOs. We've manually checked the correlation between channel H1:SQZ-FC_LSC_DOF2_OUT_DQ and channels that record the frequency of squeezer related VCOs: H1:SQZ-CLF_VCXO_FREQUENCY, H1:SQZ-FC_VCO_FREQUENCY, and H1:SQZ-LASER_VCO_FREQUENCY.
Upon quick inspection Figure 1, we observed visible dependance of H1:SQZ-FC_LSC_DOF2_OUT_DQ channel excess noise with frequency noise of H1:SQZ-FC_VCO_FREQUENCY. However, the H1:SQZ-FC_VCO_FREQUENCY frequency deviates on far less scale than whistles of the channel H1:SQZ-FC_LSC_DOF2_OUT_DQ, therefore we believe it is safe to conclude that this frequency noise is the consequence of these whistels rather its cause.
Figure_2 shows the step-like frequency drift of the whistle-signal.
UPD: We've also disabled this VCO and checked whether its noise is the cause of our problems. However, since in the observation was only for a few hours, it was hard to say whether that solved the problem (see Figure 3). We will continue to make observation with turned off VCO.
UPD2: We've added channel H1:TCS-ITMX_CO2_ISS_CTRL2_OUT_DQ for analysis (Figure 1 and Figure 3). It didn't show any dependance on whistles.
Jennie W, TJ
See attached images for the SDFs I reverted which were just used for our A2L measurements (mostly TRAMPS or filter settings in ADS YAW7 and PIT7 banks which were used for injecting our A2L tuning lines but are not used normally).
The only ones I accepted were the updated DRIVEALIGN gains used to minimise the A2L coupling.
After the commissioning period this morning where I tuned A2L gains, Naoki tuned the squeezer, and Sheila updated the MICH FF we gained noticeably at frequencies above 60 Hz and between 18 Hz to 23 Hz.
We are noticeably worse below 12 Hz.
See attached plot.
The template is stored in /jennifer.wright/Documents/ASC/20240610_DARM_pre_post_A2L_tuning.xml
Closes FAMIS 25995, everything looks good at high frequency.
ITMY_ST2_CPSINF_H1 looks elevated below 10 Hz
ETMY_{ST1,ST2}s overall noise looks reduced below 10 Hz
Jennie W, Sheila
Sheila wanted me to look at how good our optical gain is doing since the burn on the OFI that roughly happened (we think) on the 22nd April.
Before this happened we made a measurement of the OMC alignment using dithers on the OMC ASC degrees of freedom. We got a set of new alignment offsets for the OMC QPDs that would have increased our optical gain but did not implement these at the time.
After the OFI burn we remeasured these alignment dithers and found a similar set of offsets that would imrpove our optical gain. Thus I have assumed that we would have achieved this optical gain increase before the OFI burn if we had implemented the offset changes then.
Below is the sequence of events then a table stating our actual or inferred optical gain and the date on which it was measured.
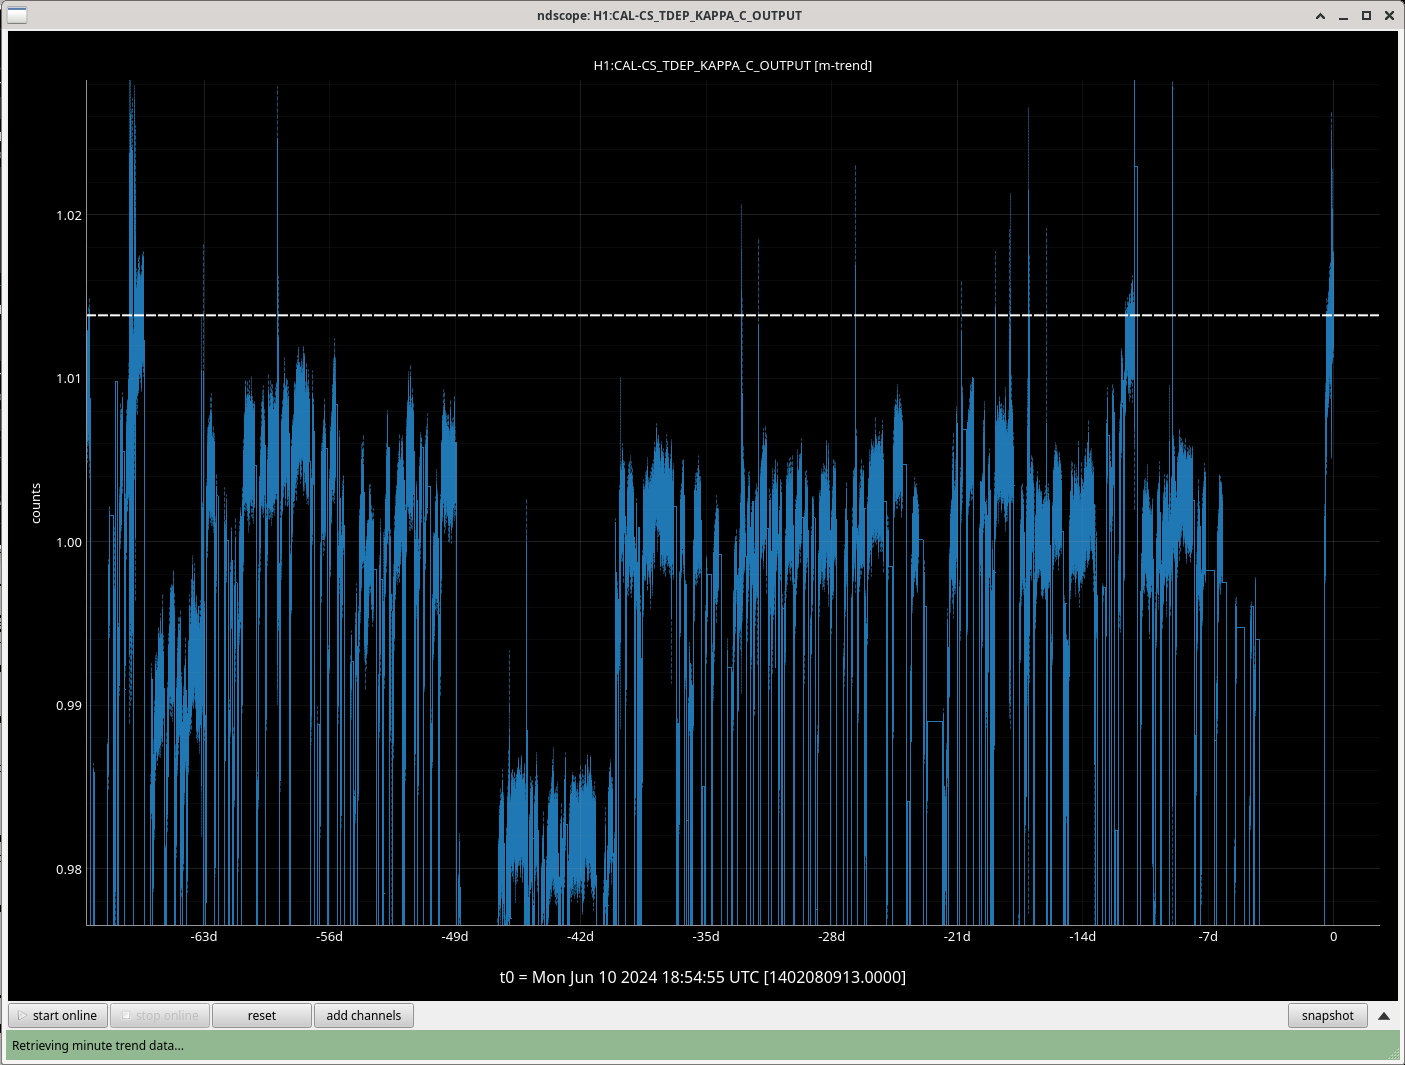
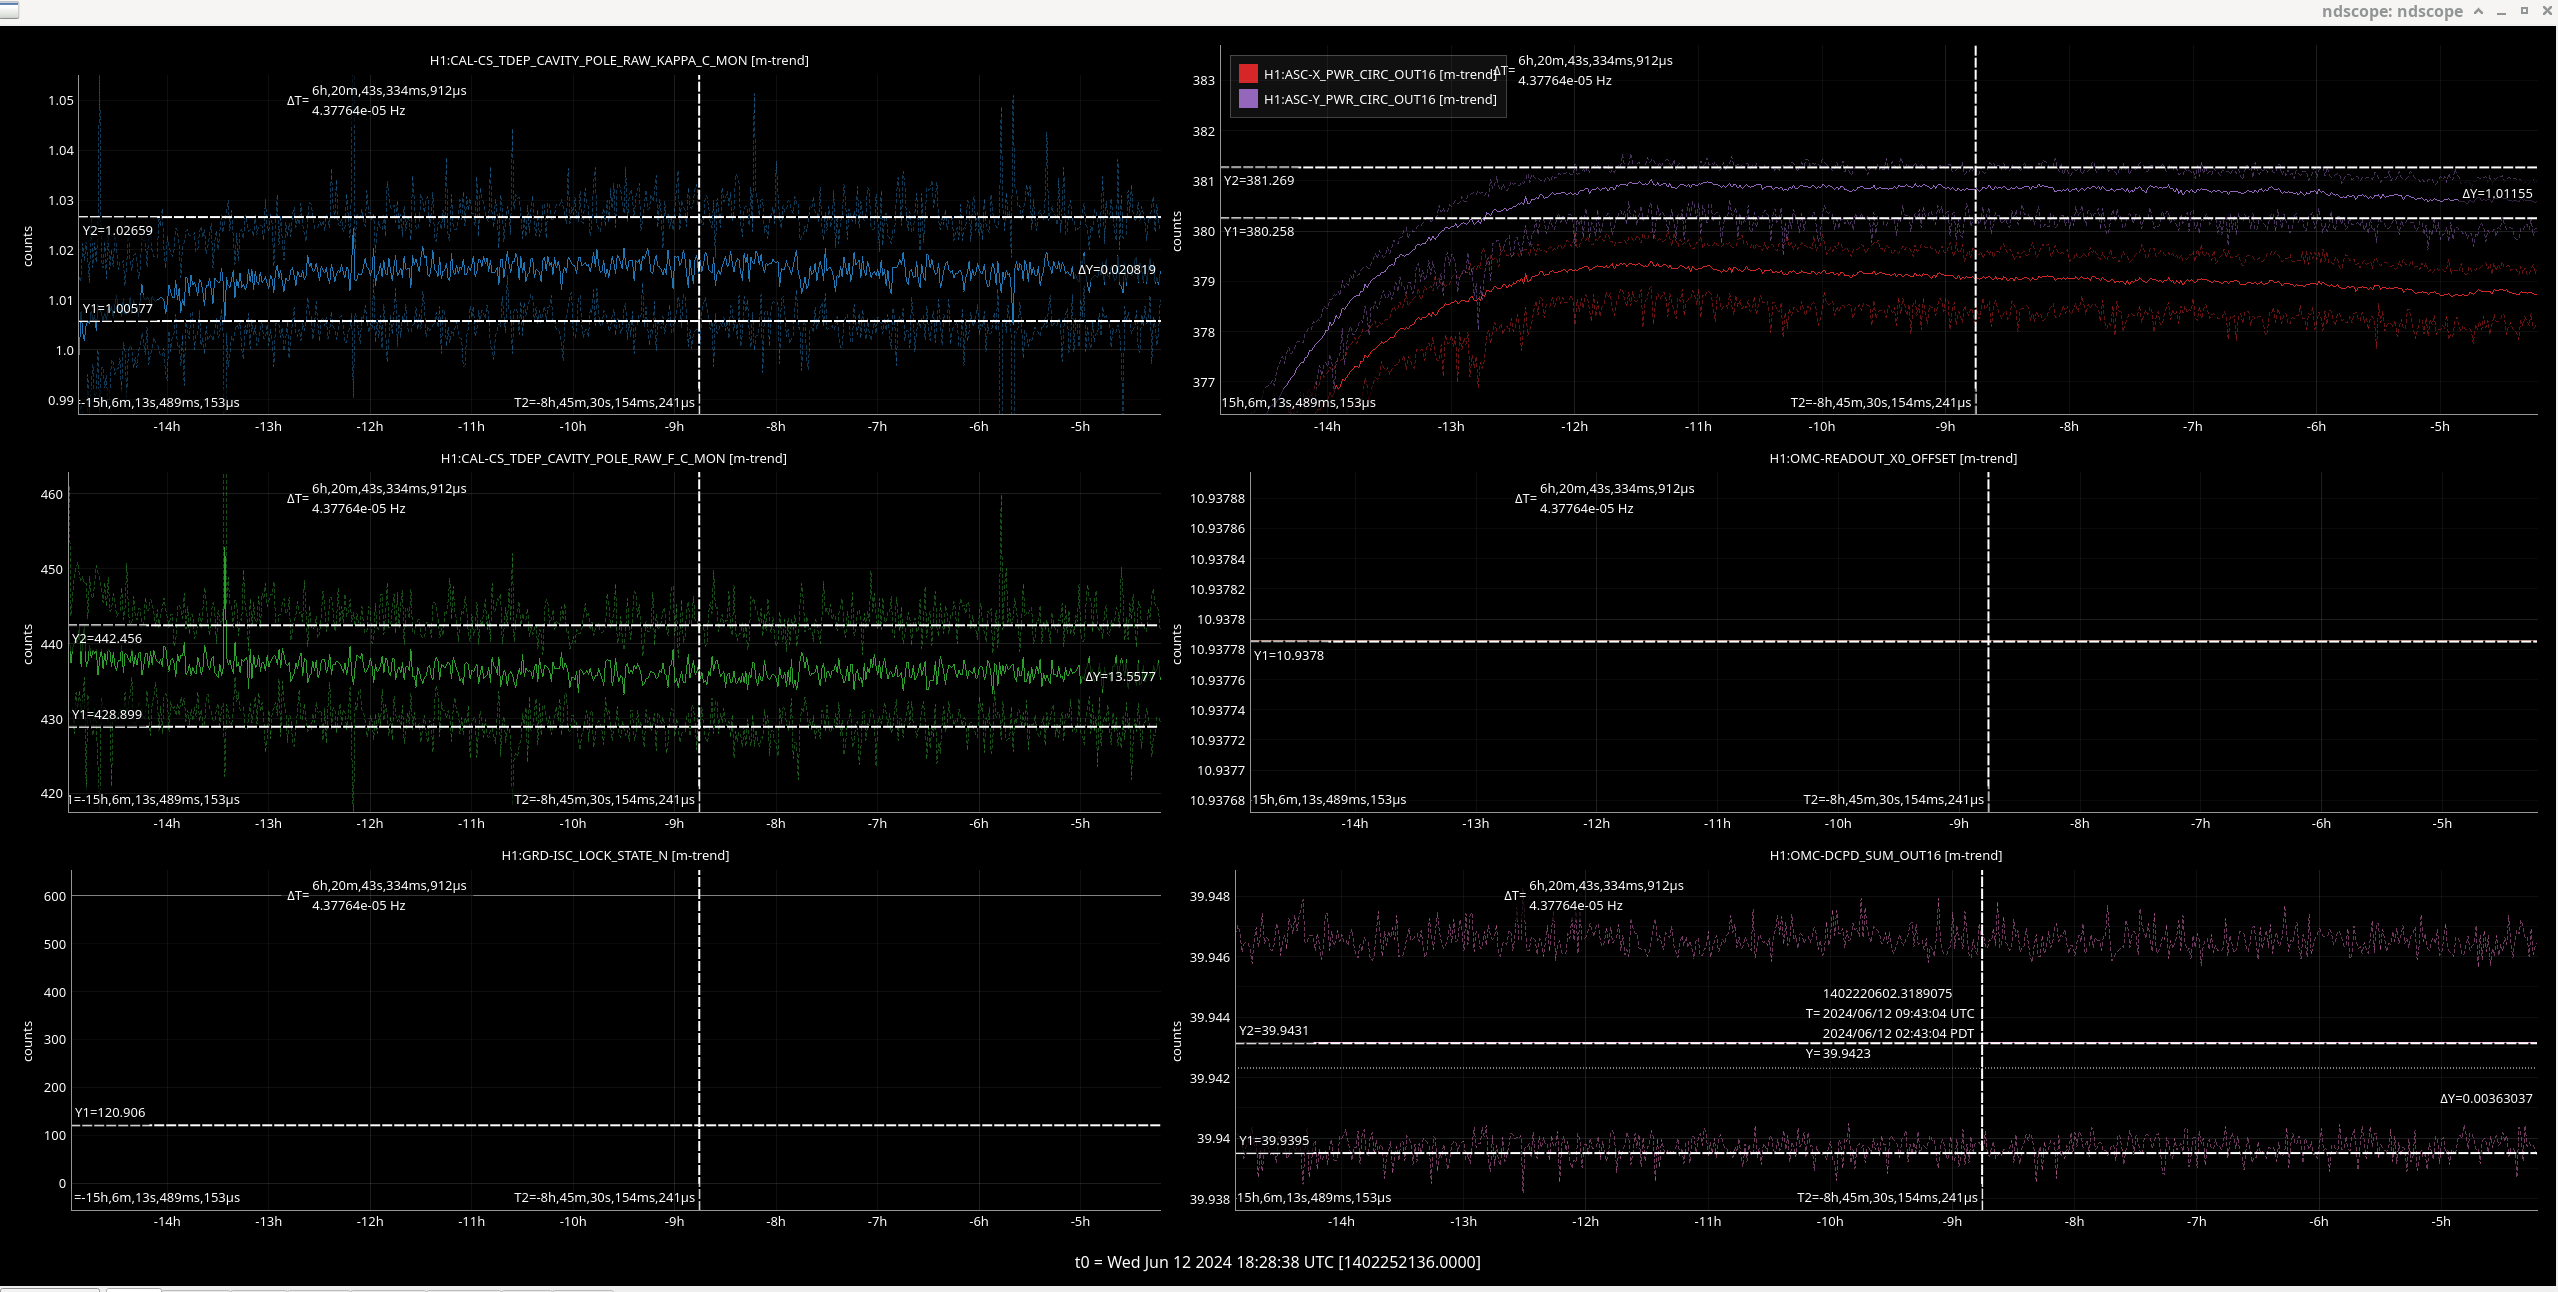
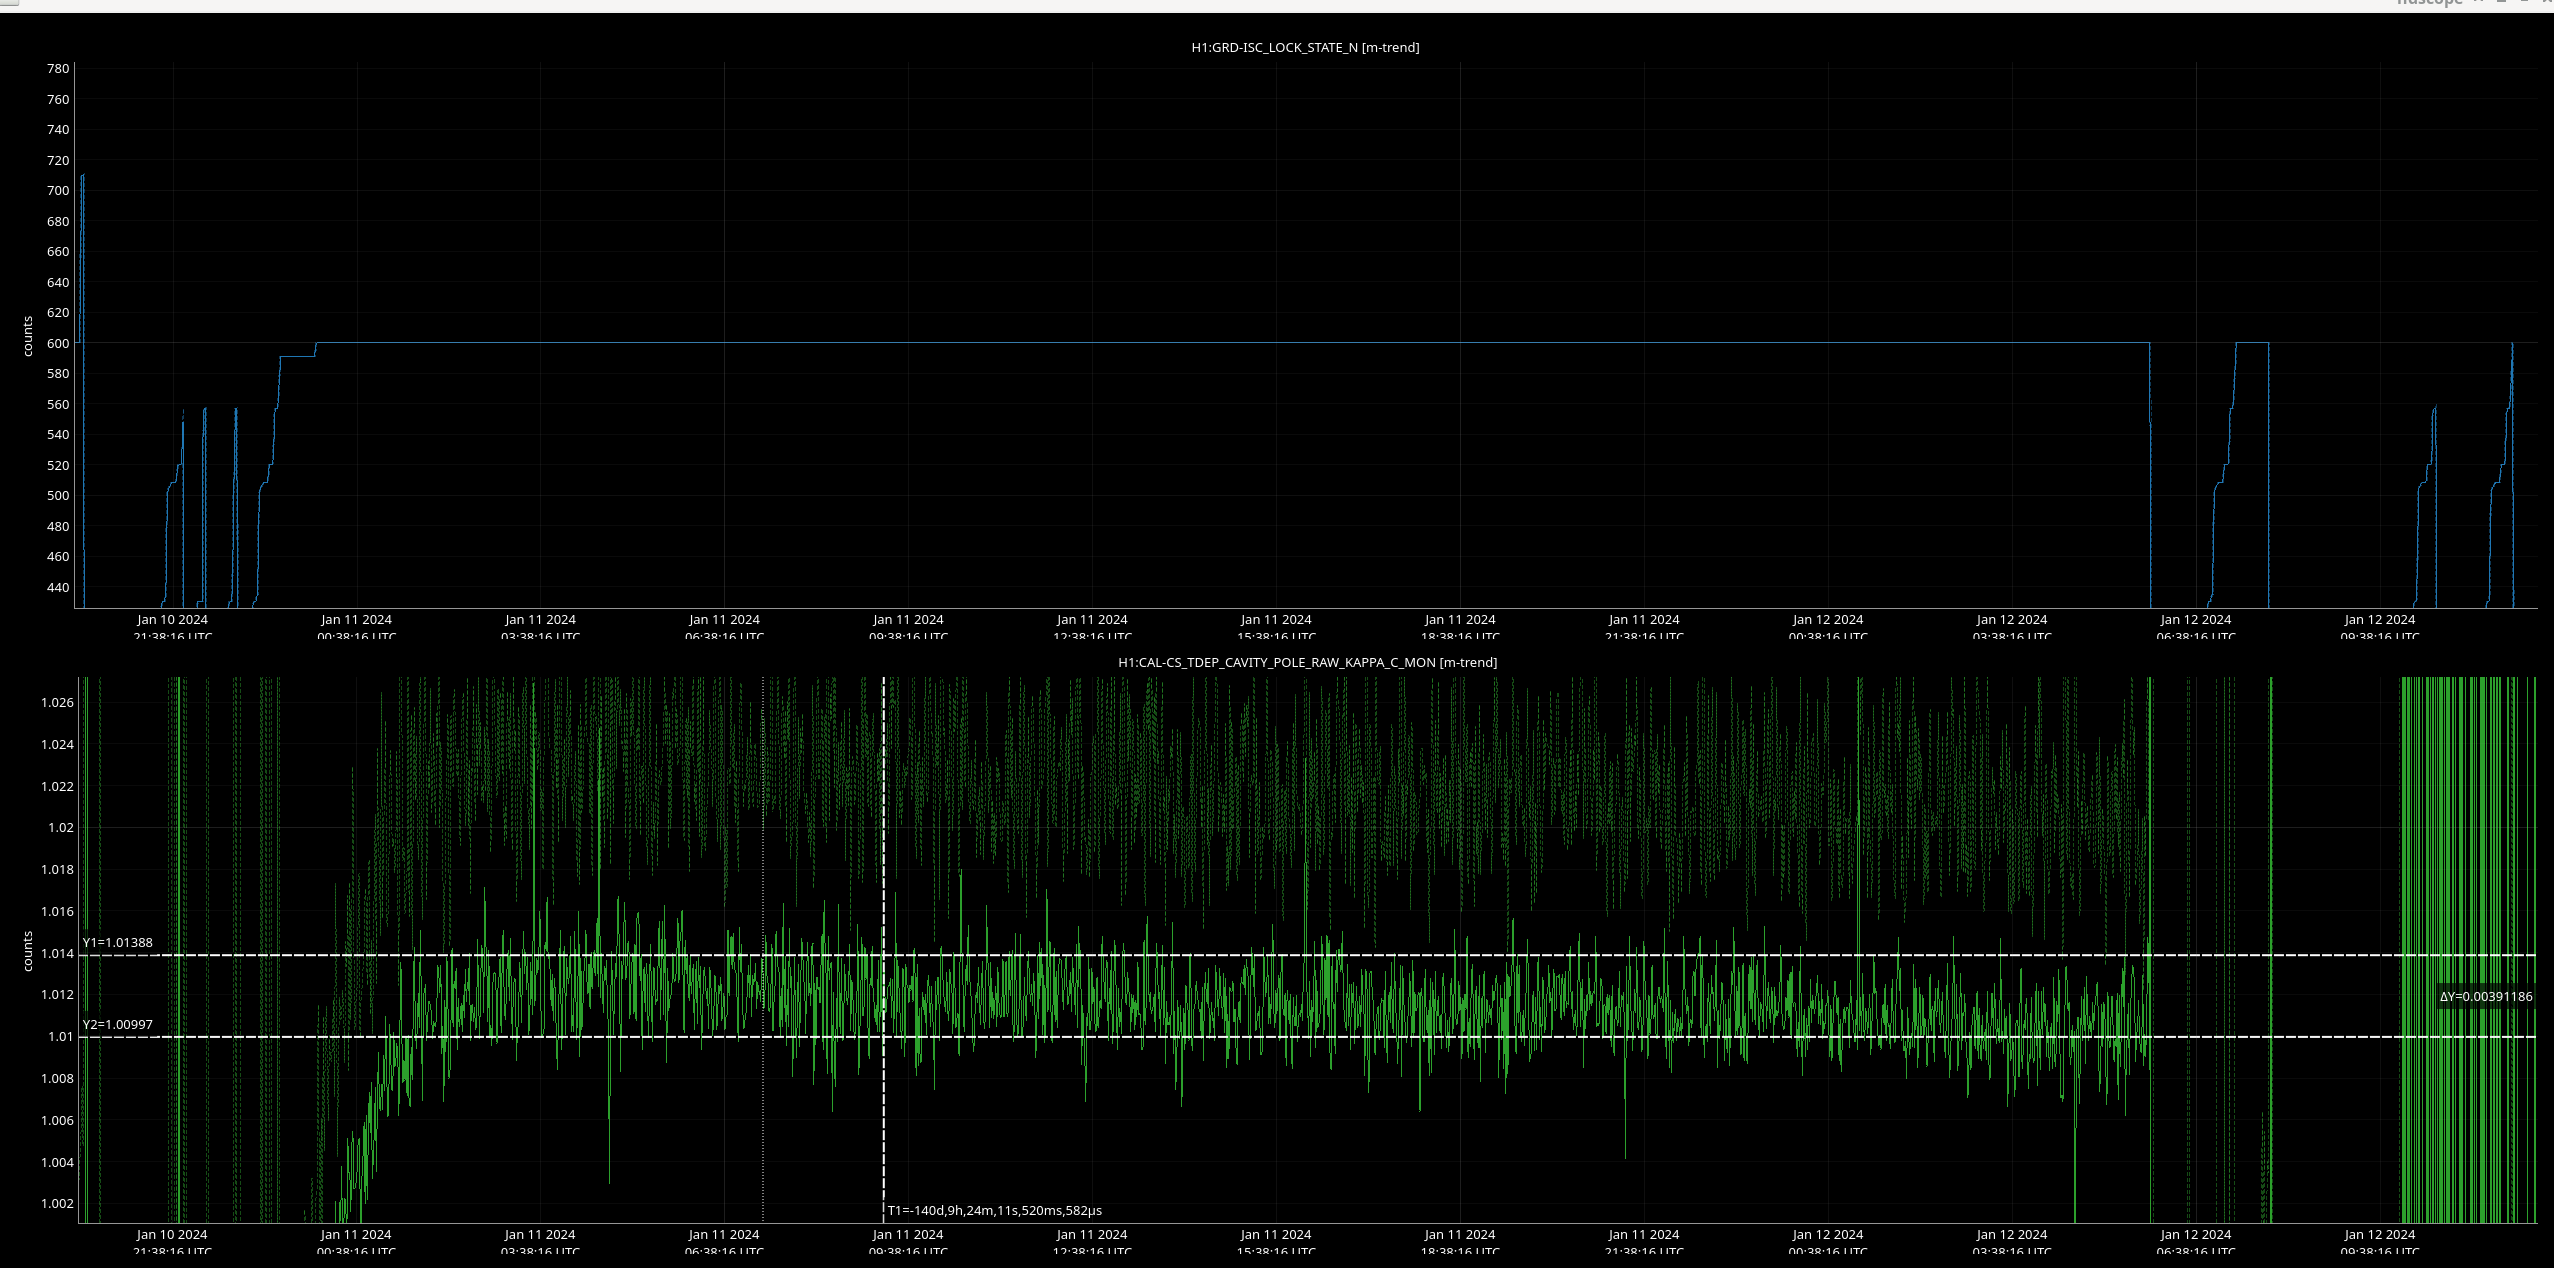
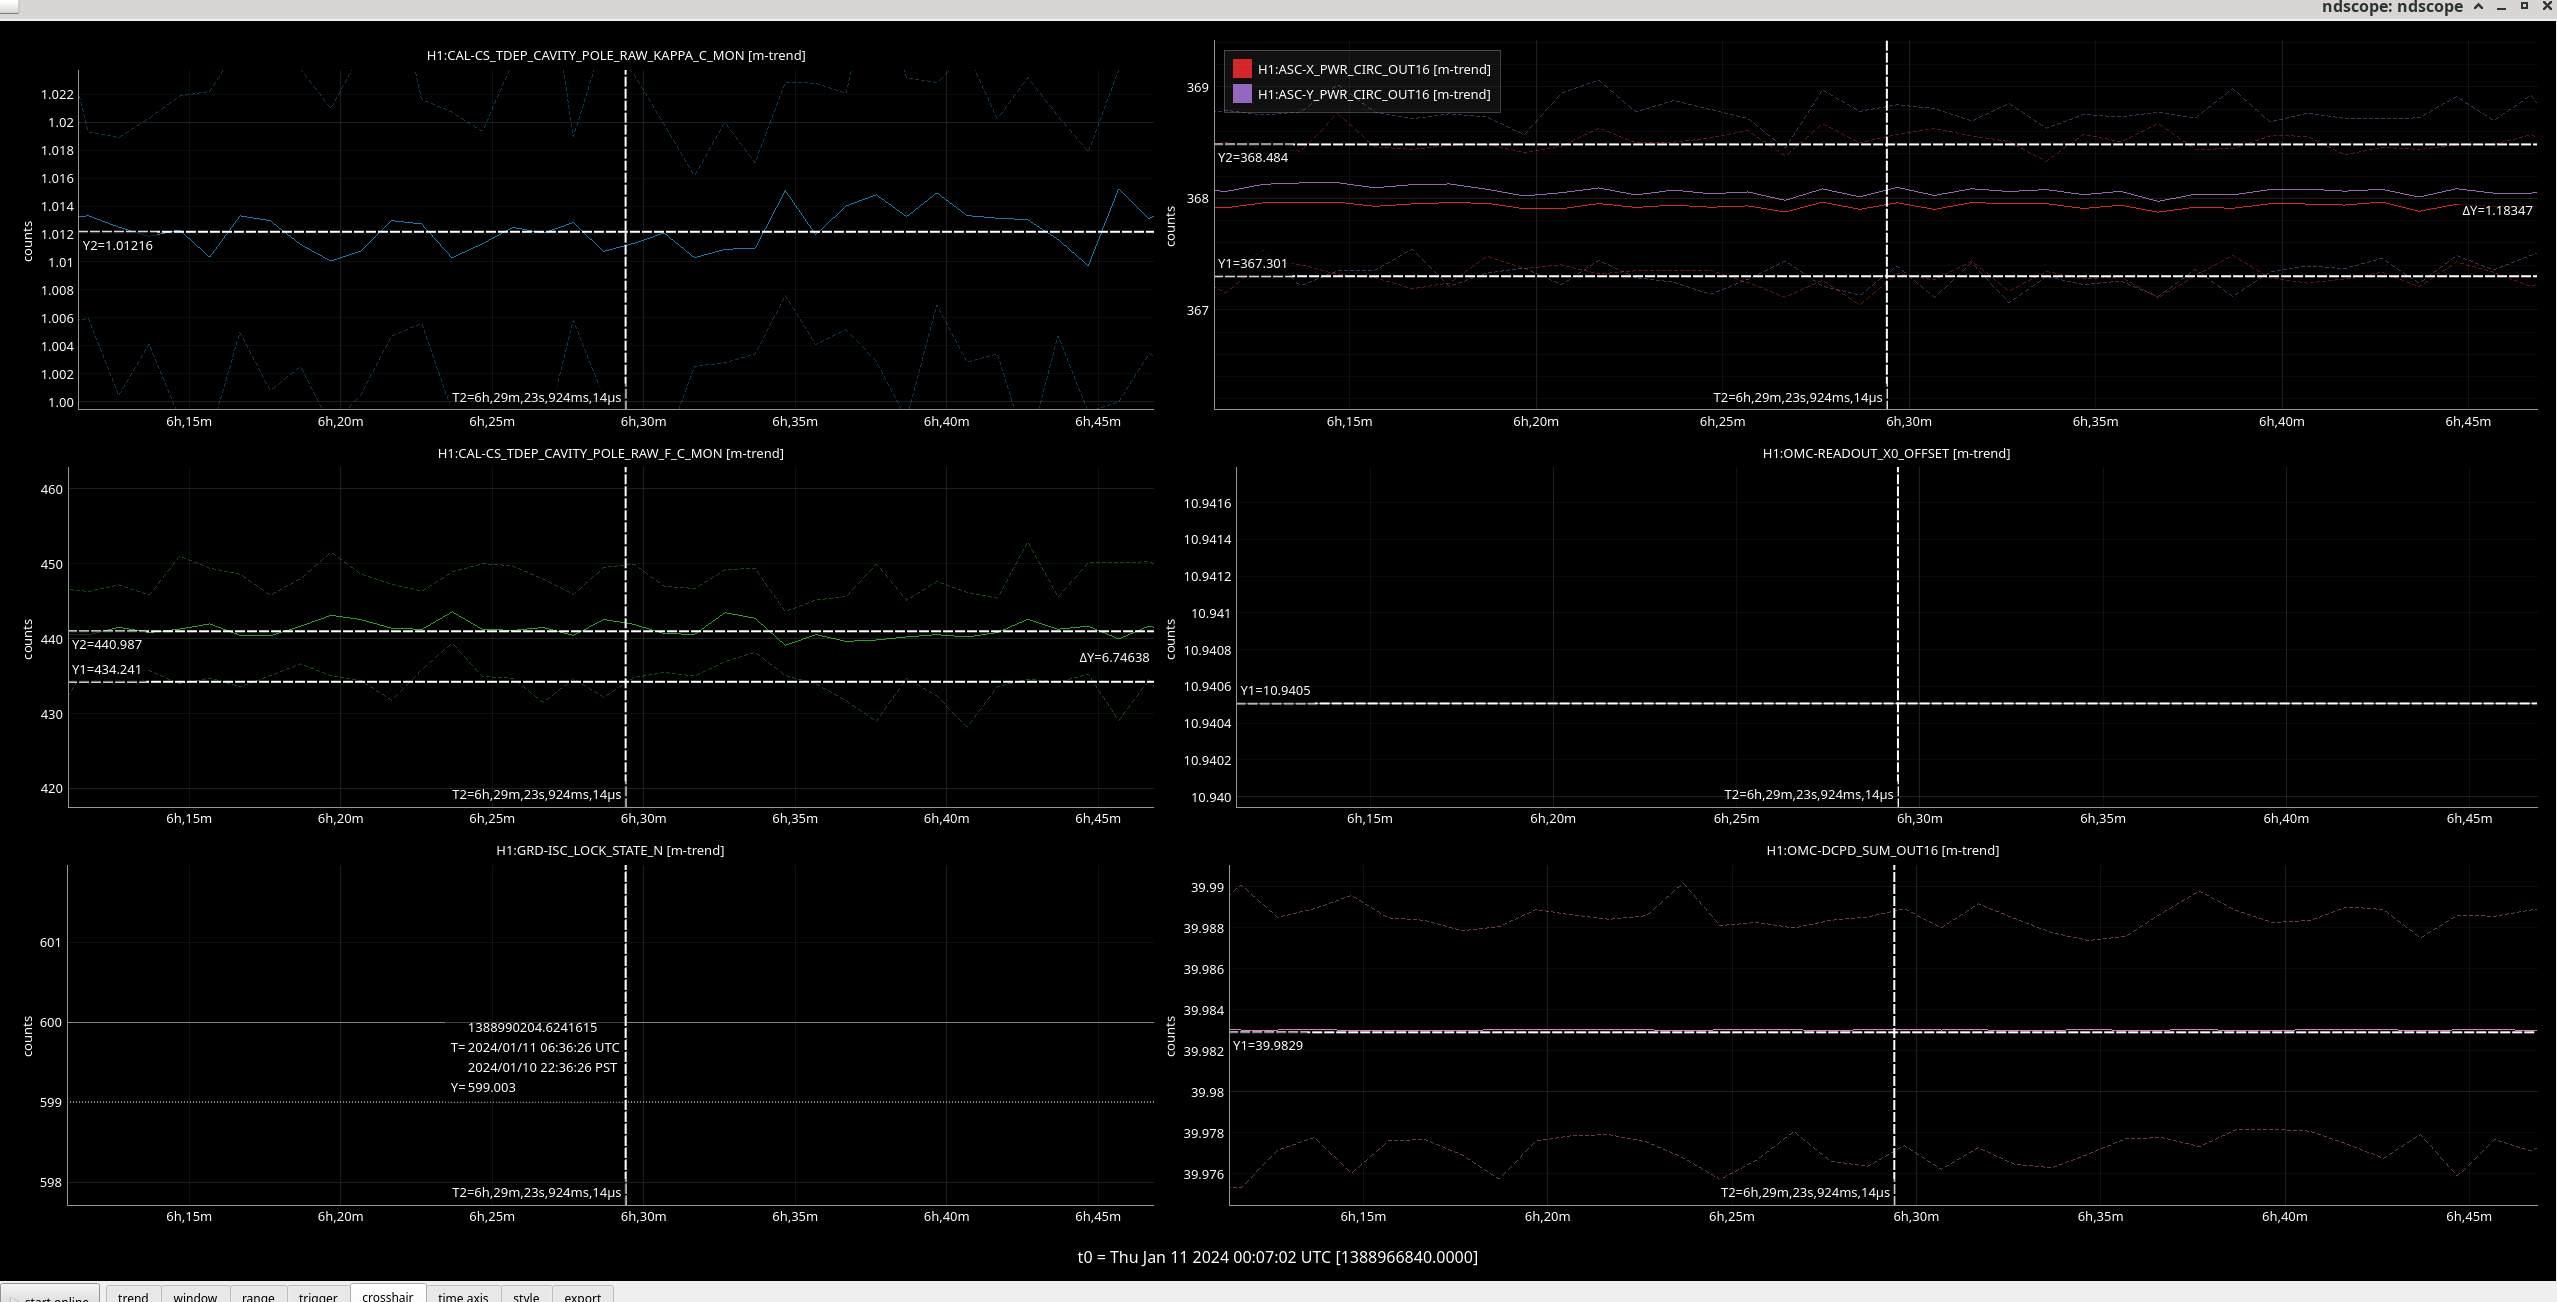
Optical gain before vent as tracked by kappa C: 2024/01/10 22:36:26 UTC is 1.0117 +/- 0.0039
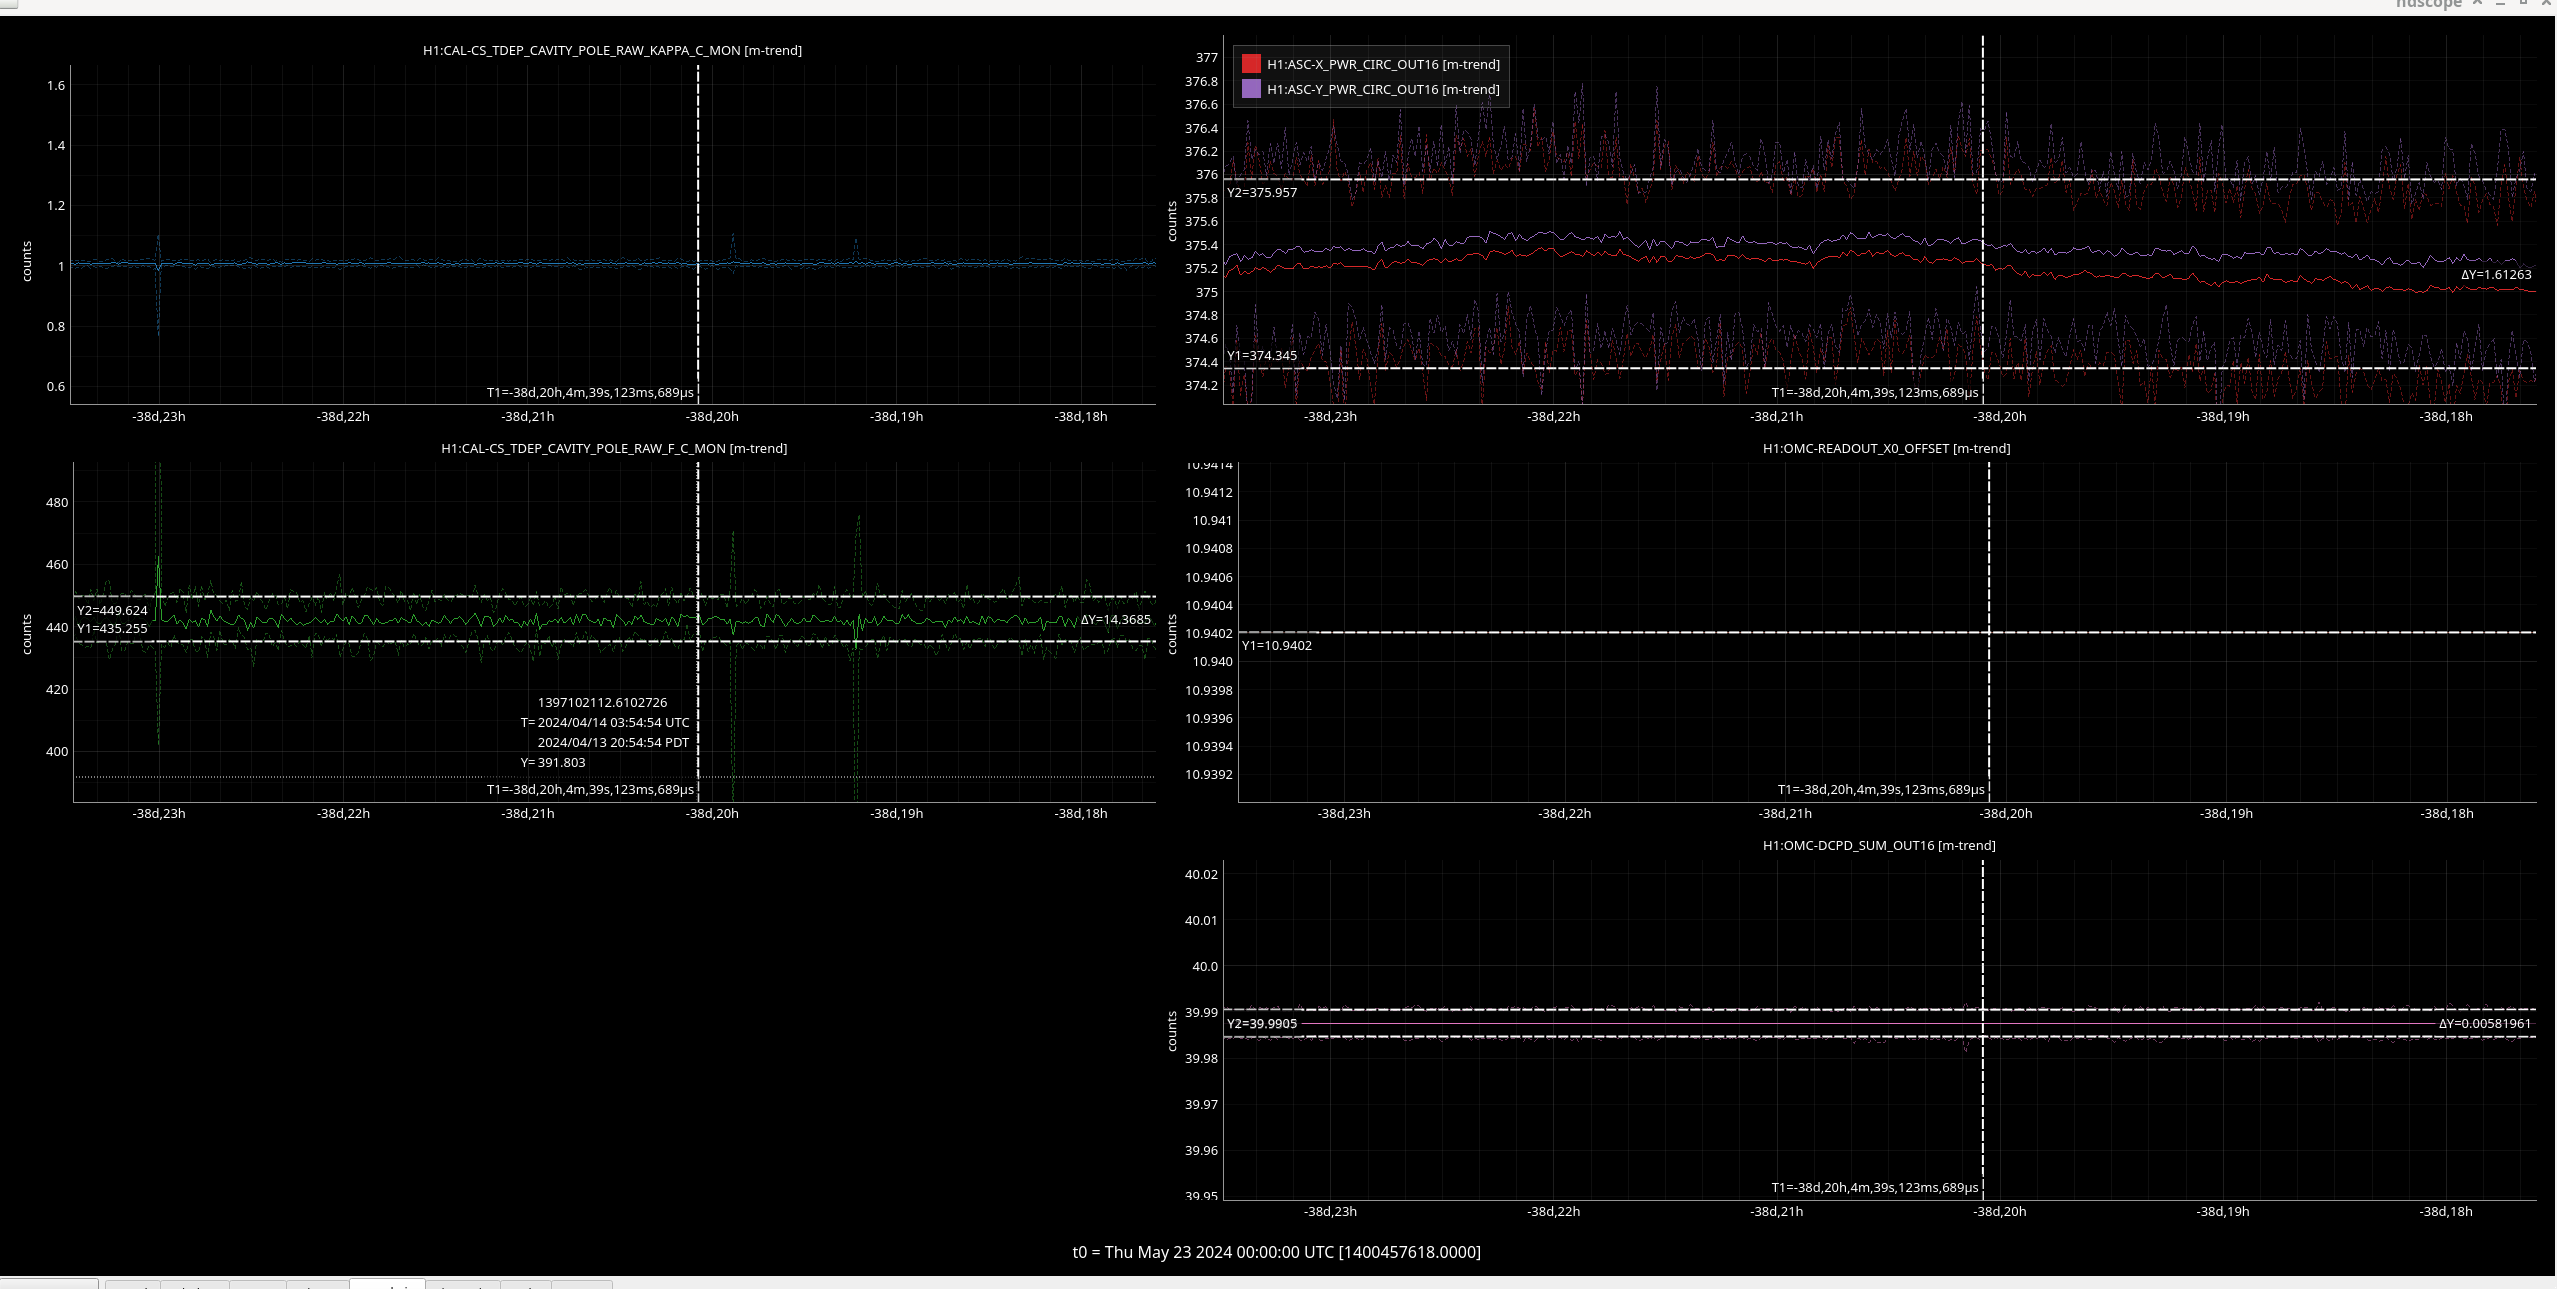
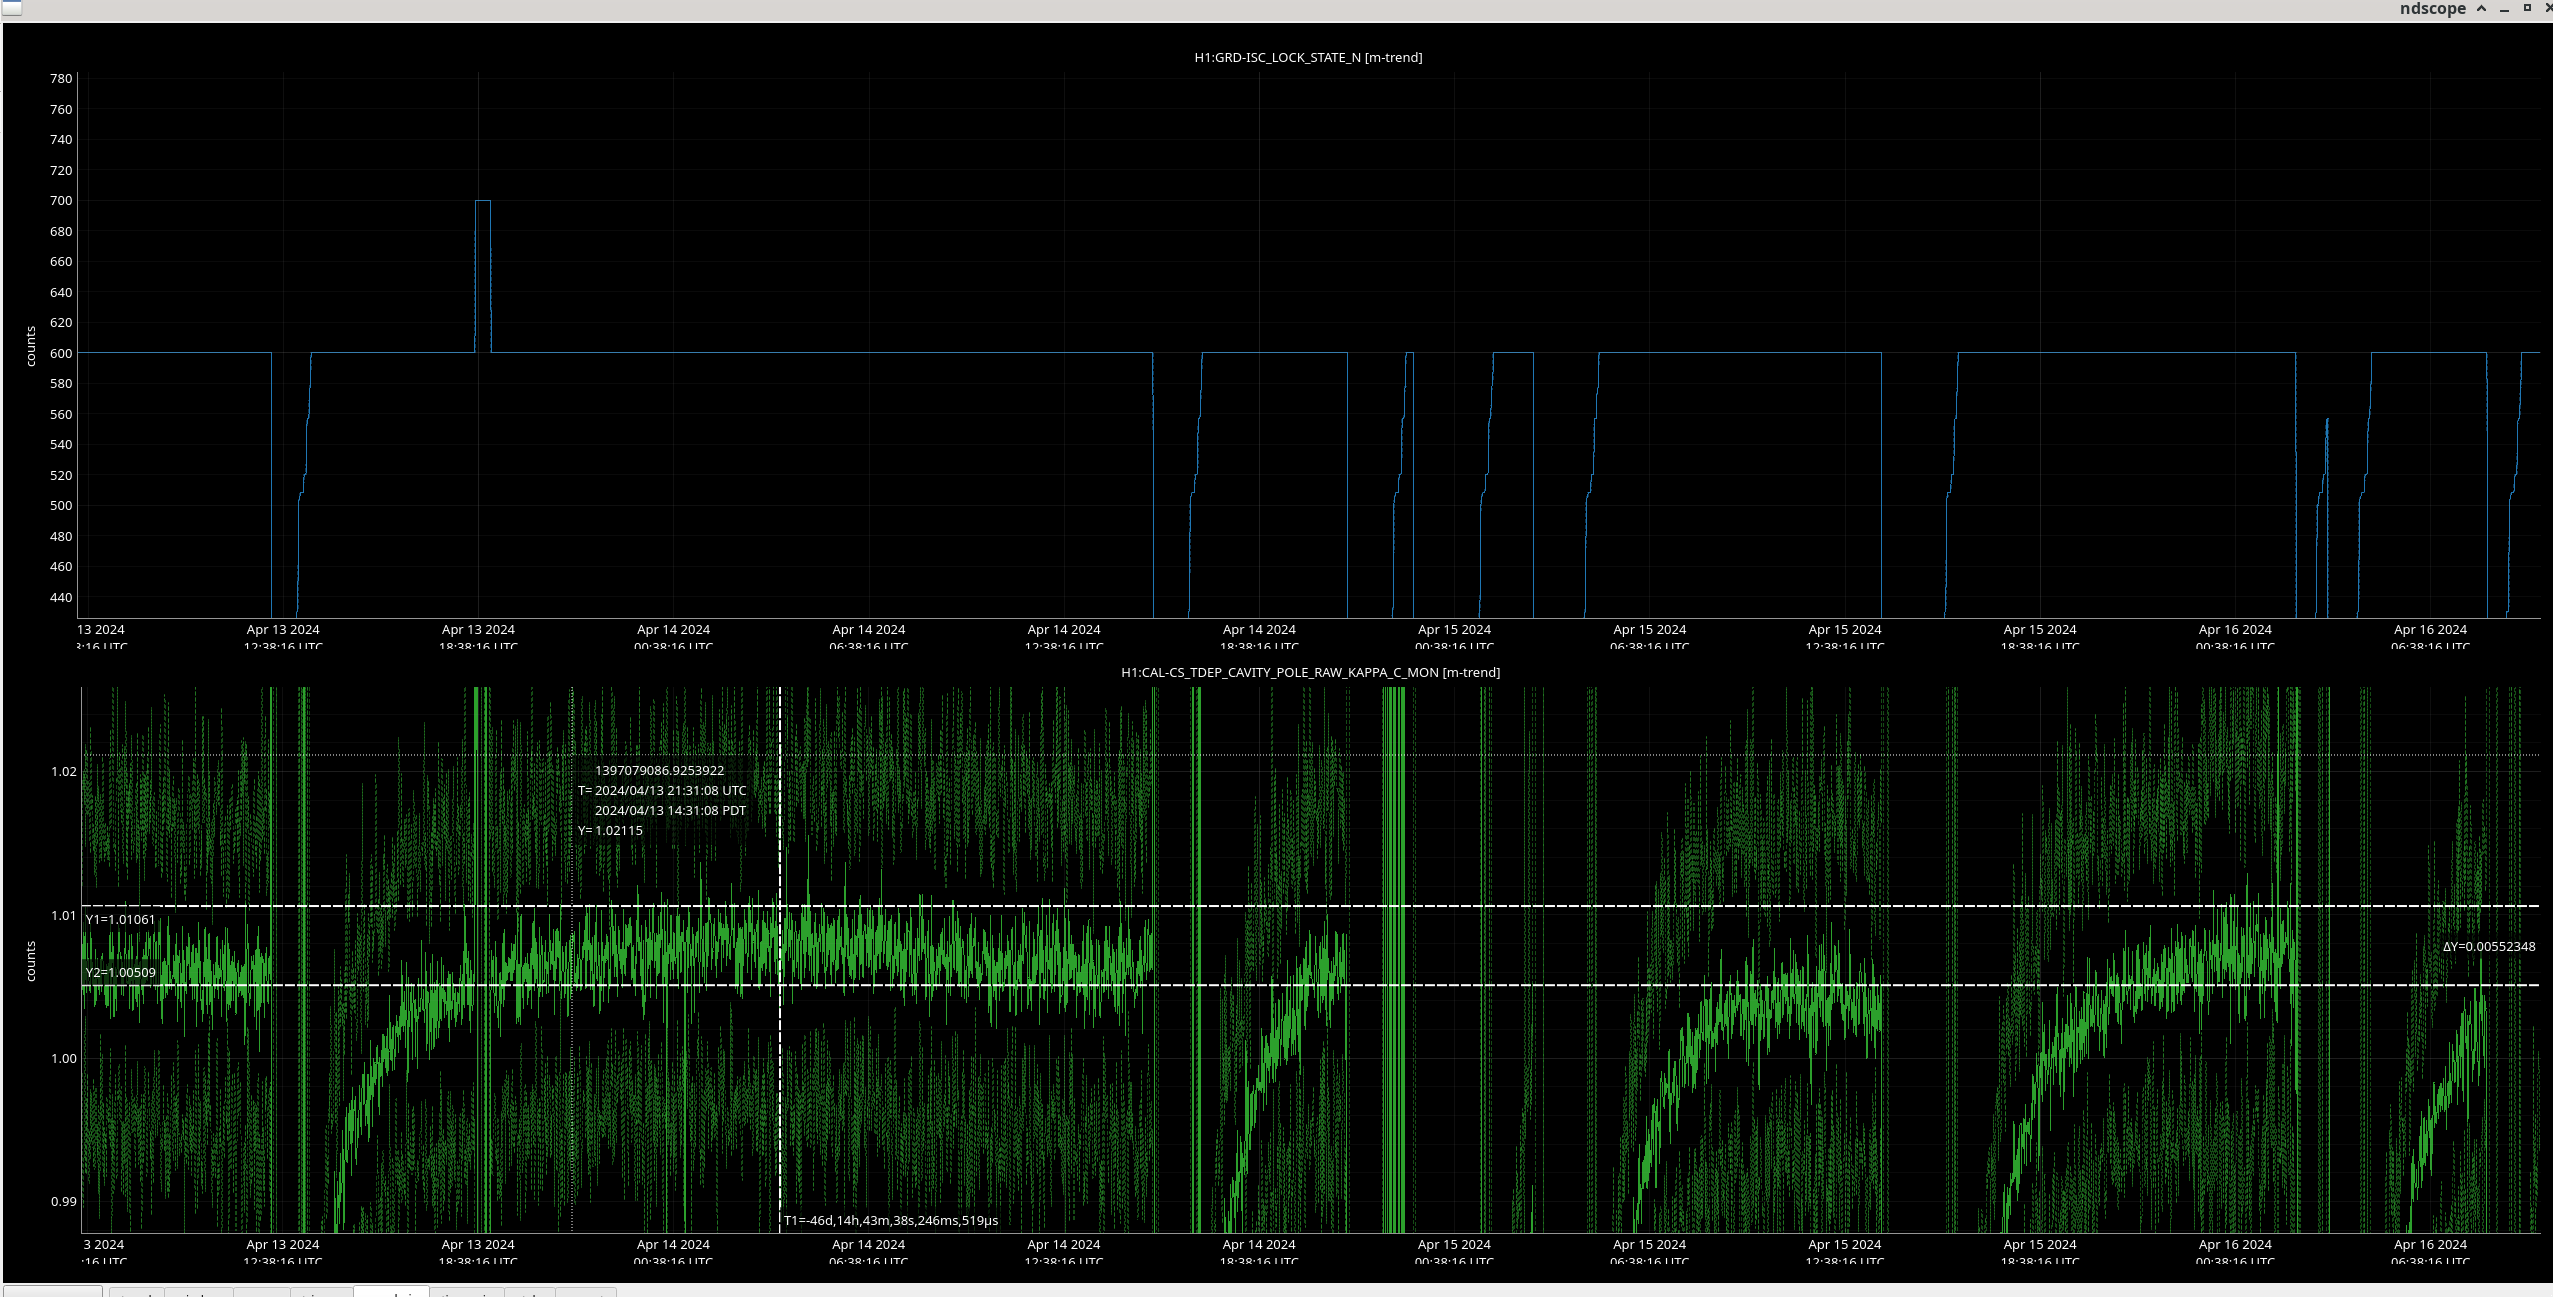
Optical gain after vent: 2024/04/14 03:54:38 UTC is 1.0158 +/- 0.0028, optical gain if we had improved OMC alignment = 1.0158 + 0.0189 = 1.0347
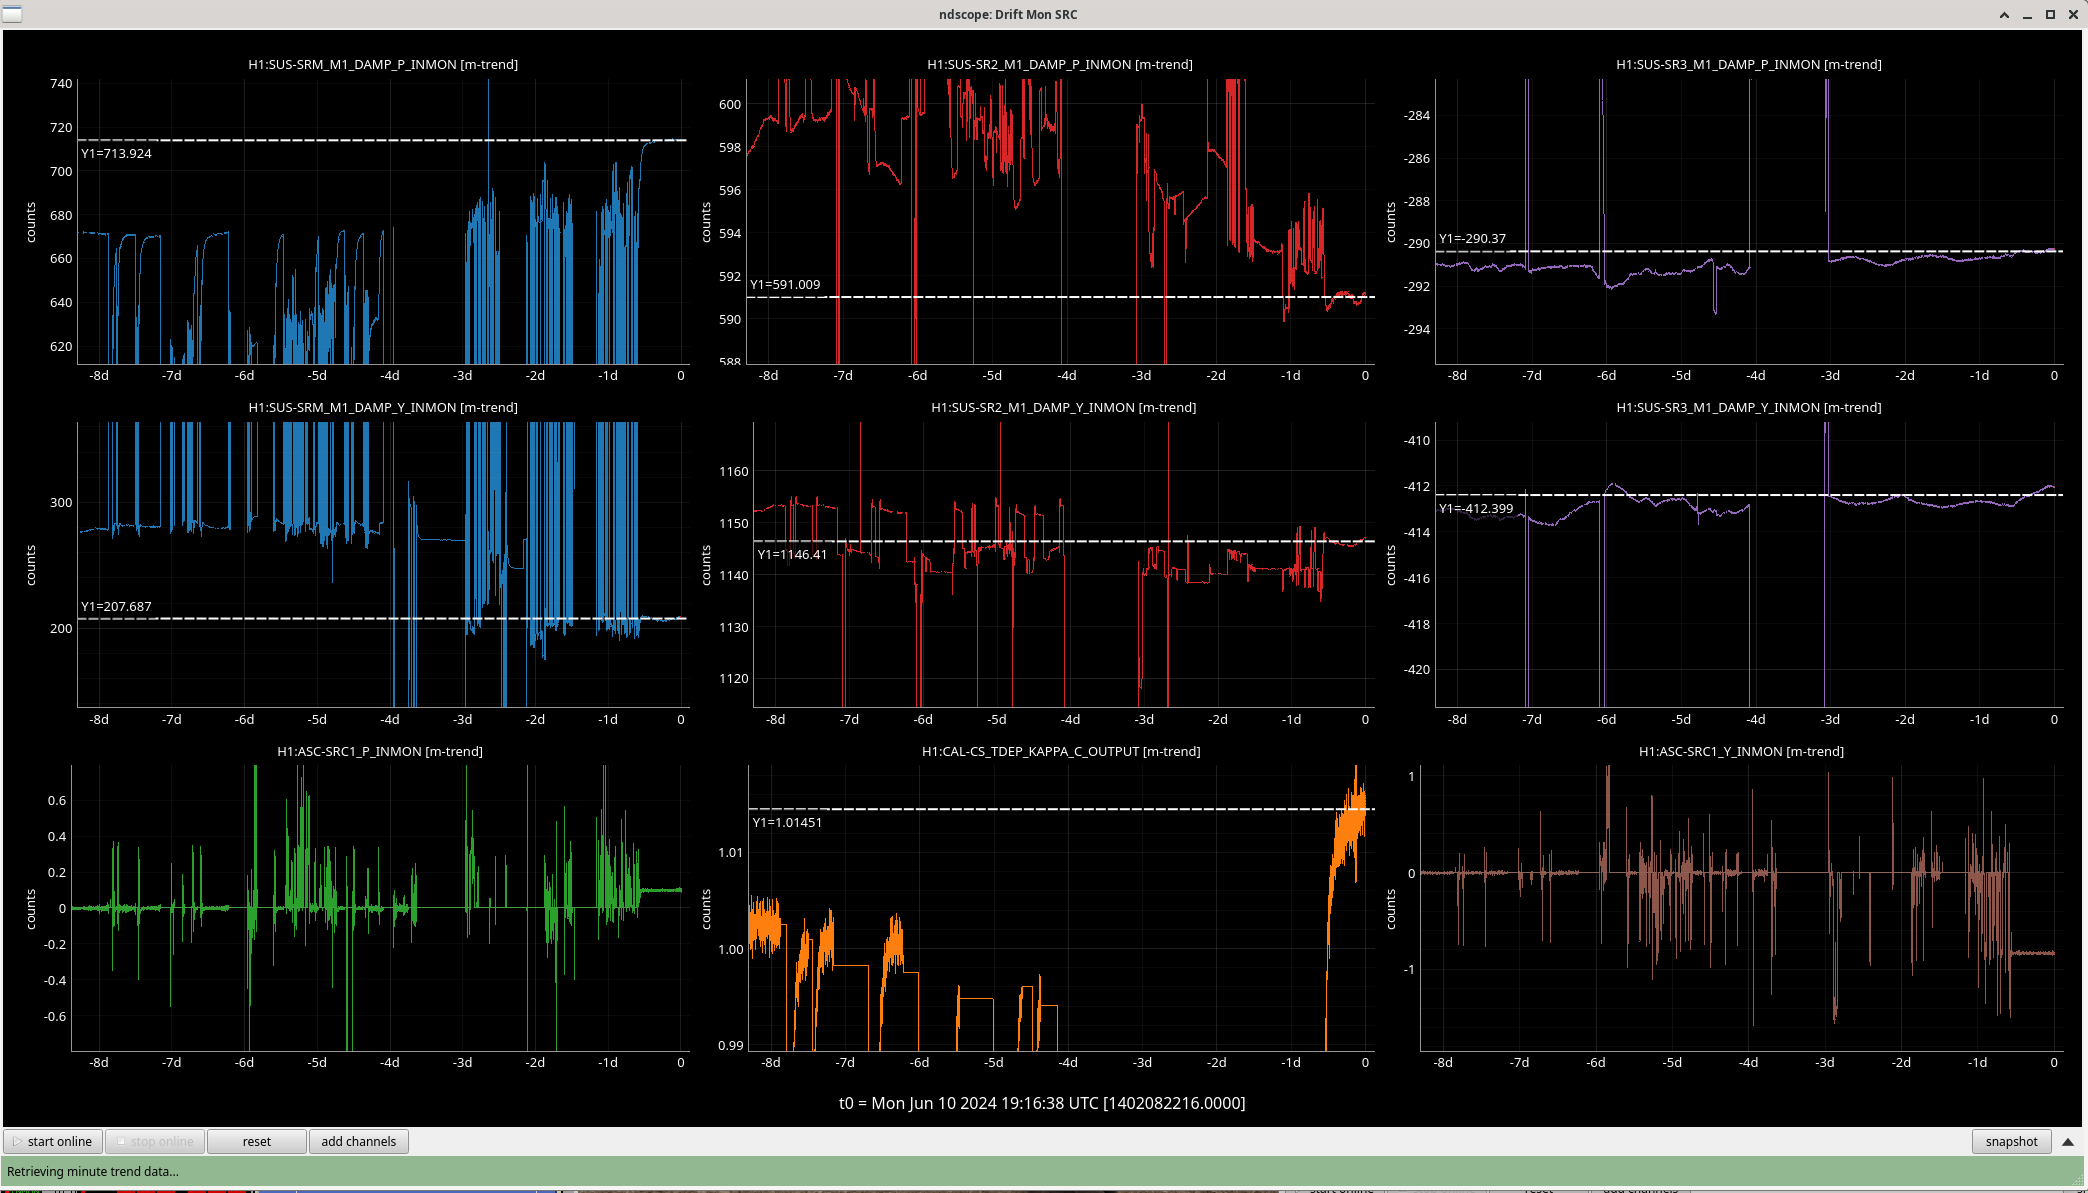
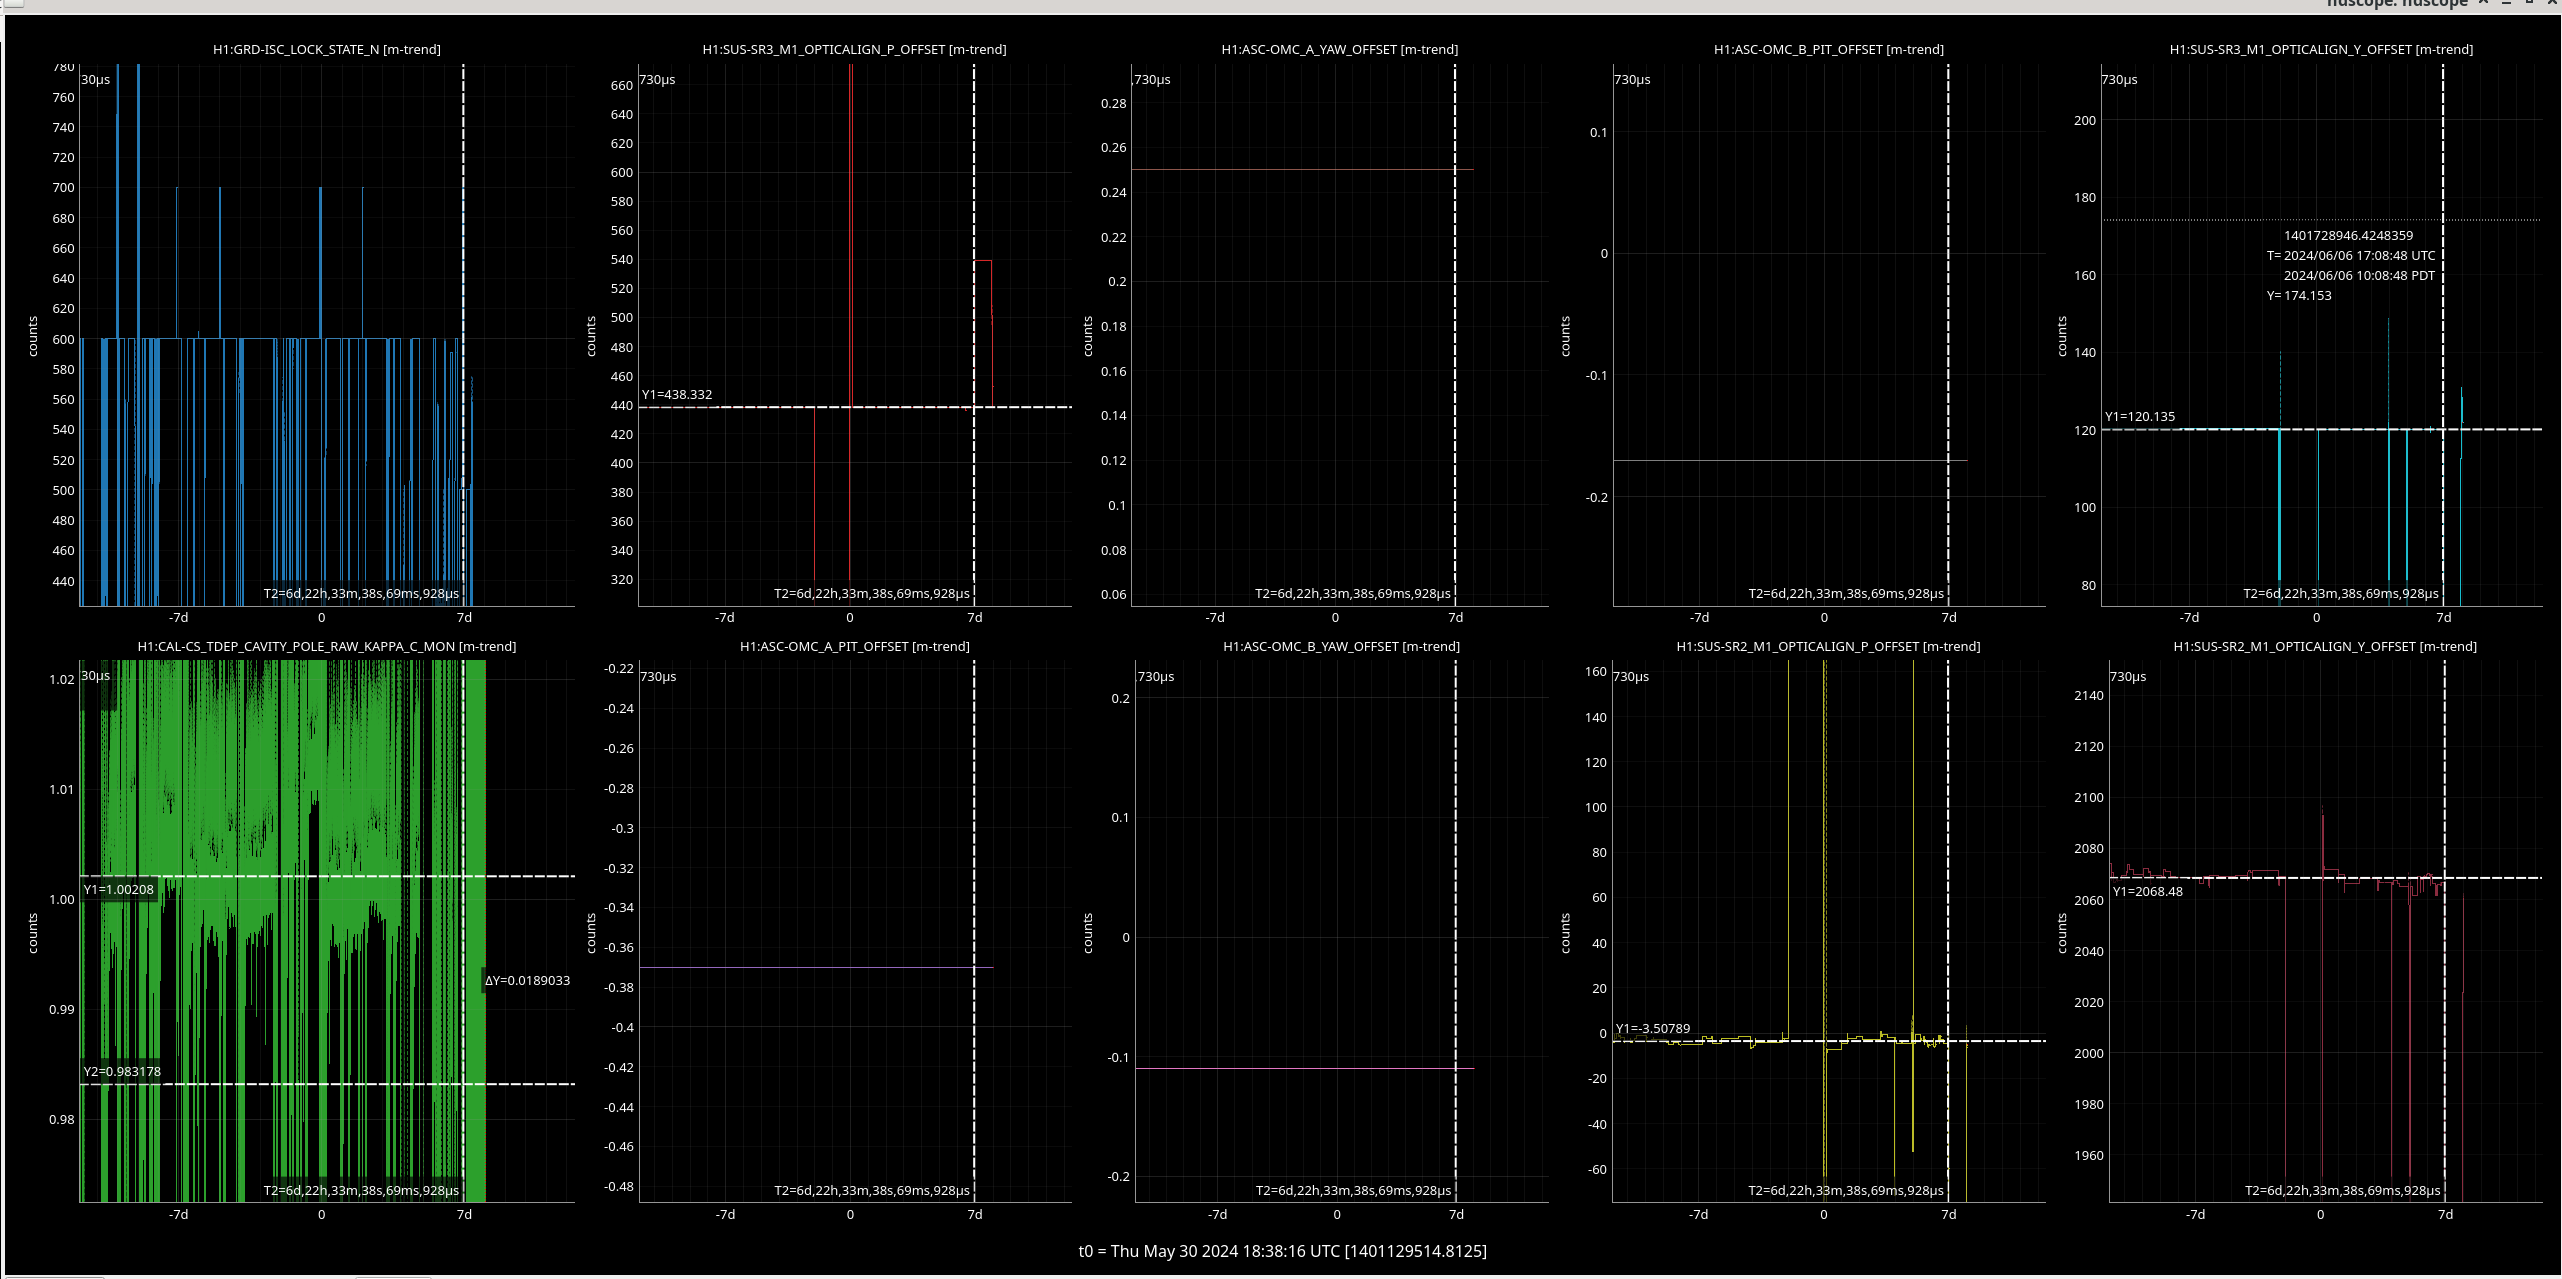
SR3 yaw position and SR2 yaw and pitch positions were changed on the 24th April ( starting 17:18:15 UTC time) to gain some of our throughput back.
The OMC QPD offsets were changed on 1st May (18:26:26 UTC time) to improve our optical gain - this improved kappa c by 0.0189.
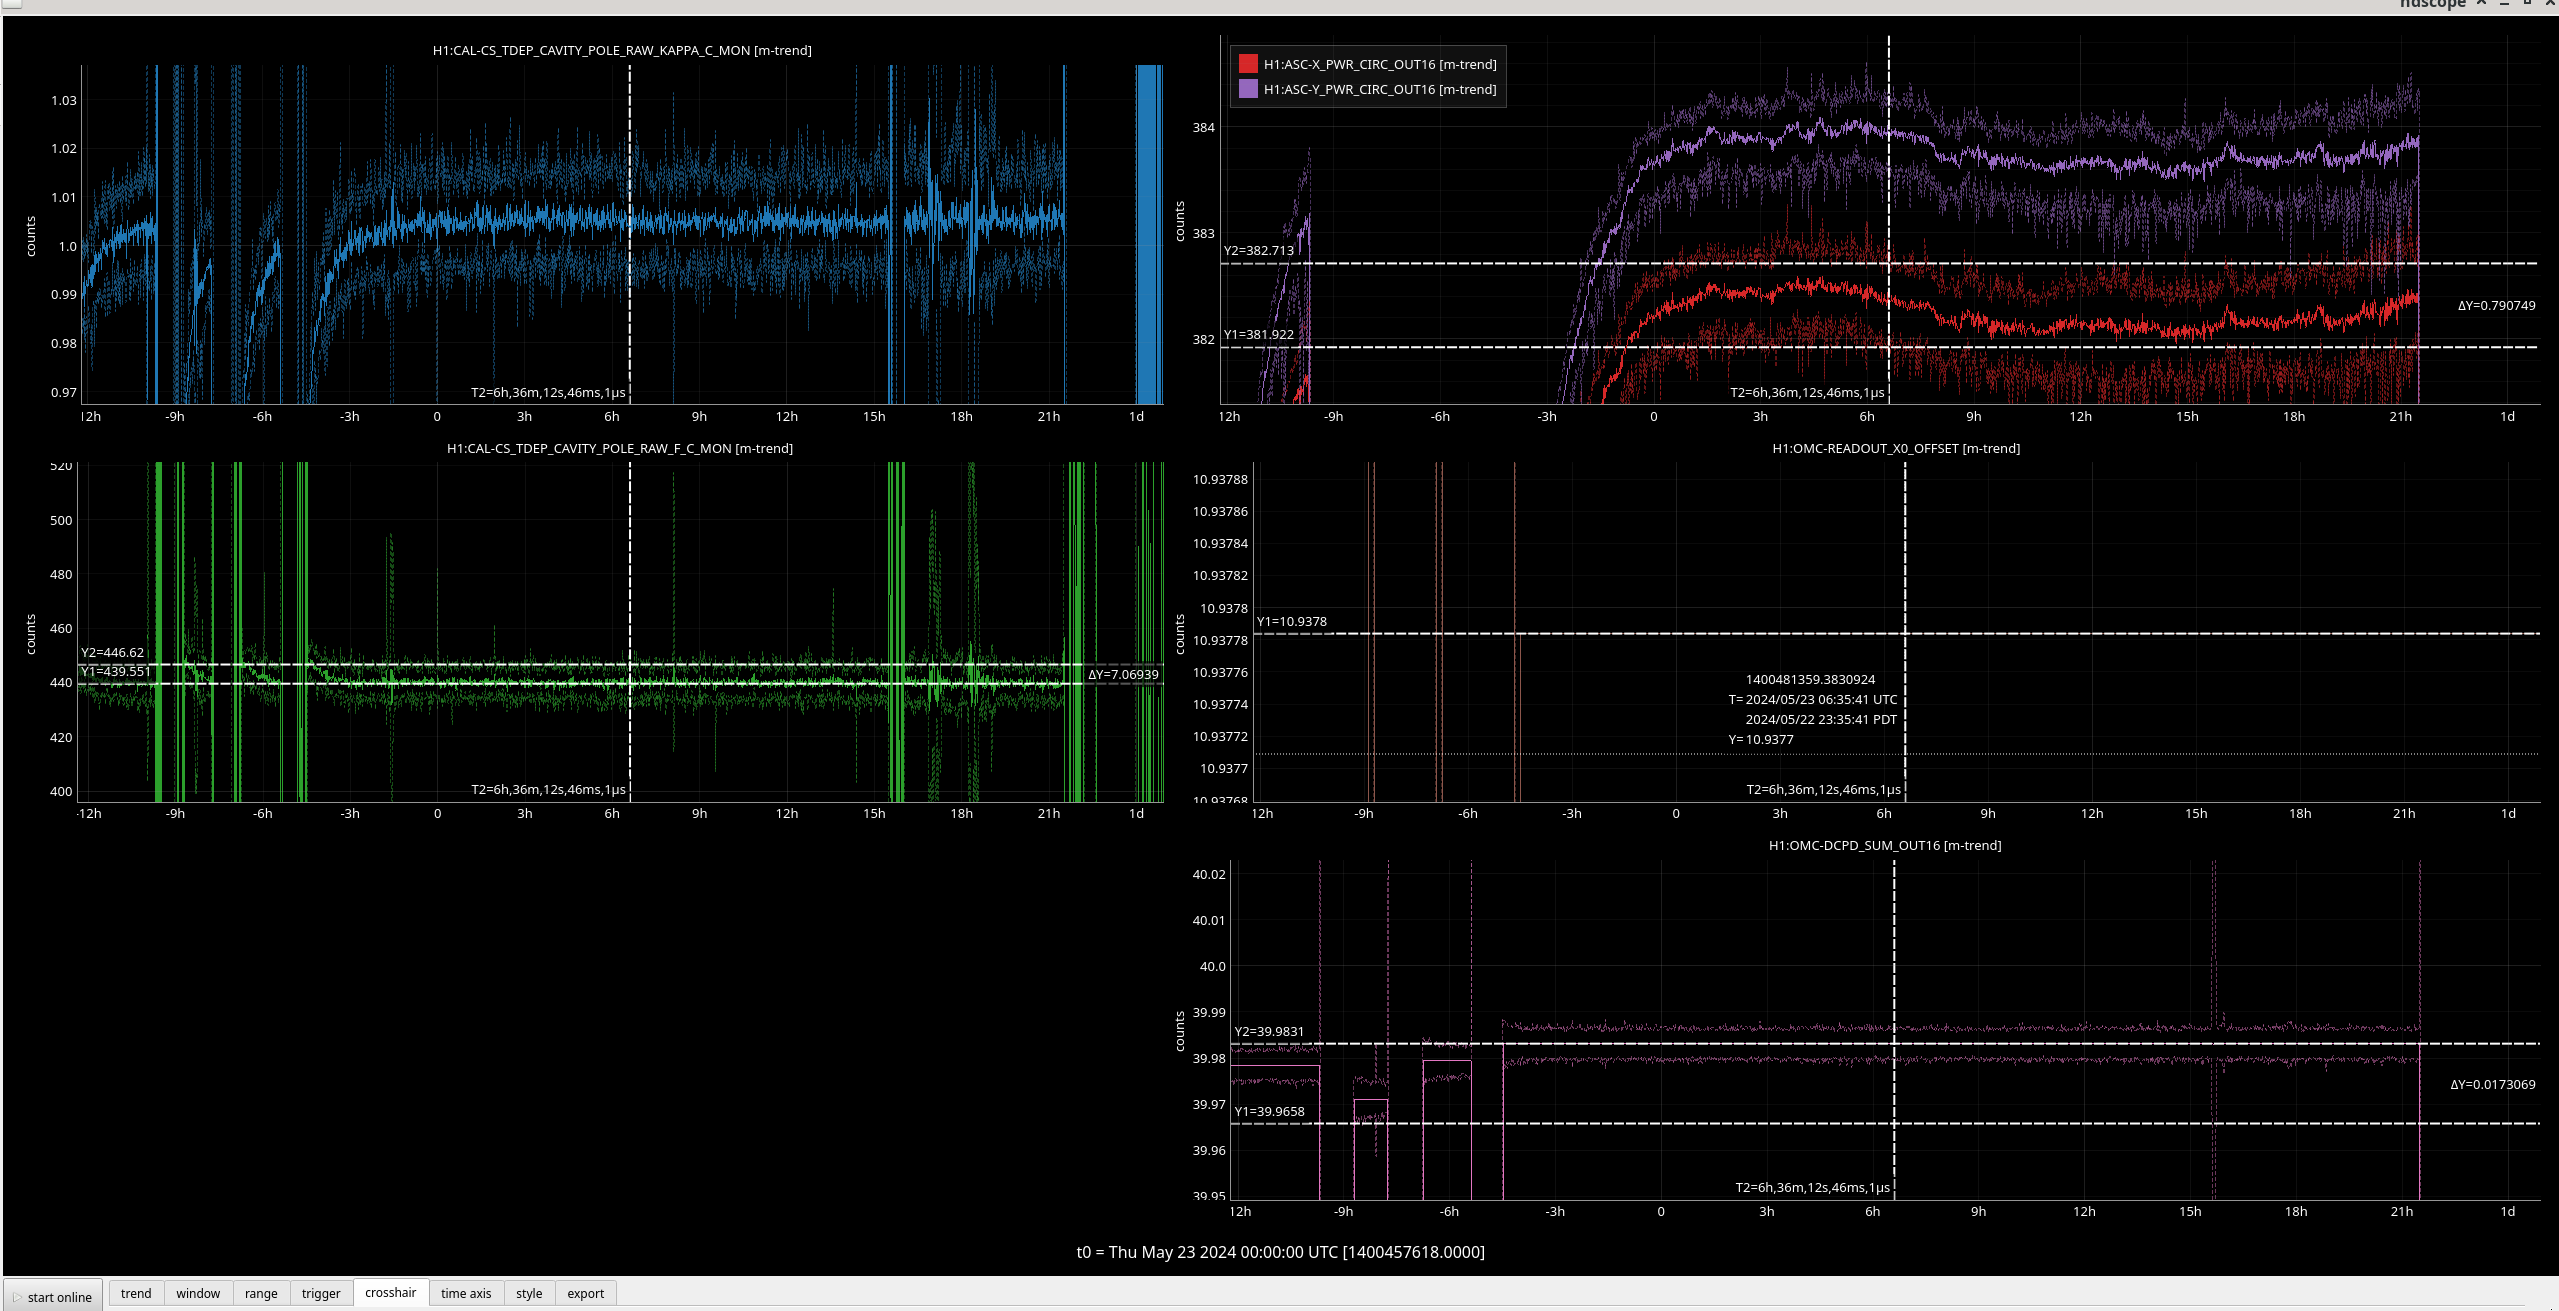
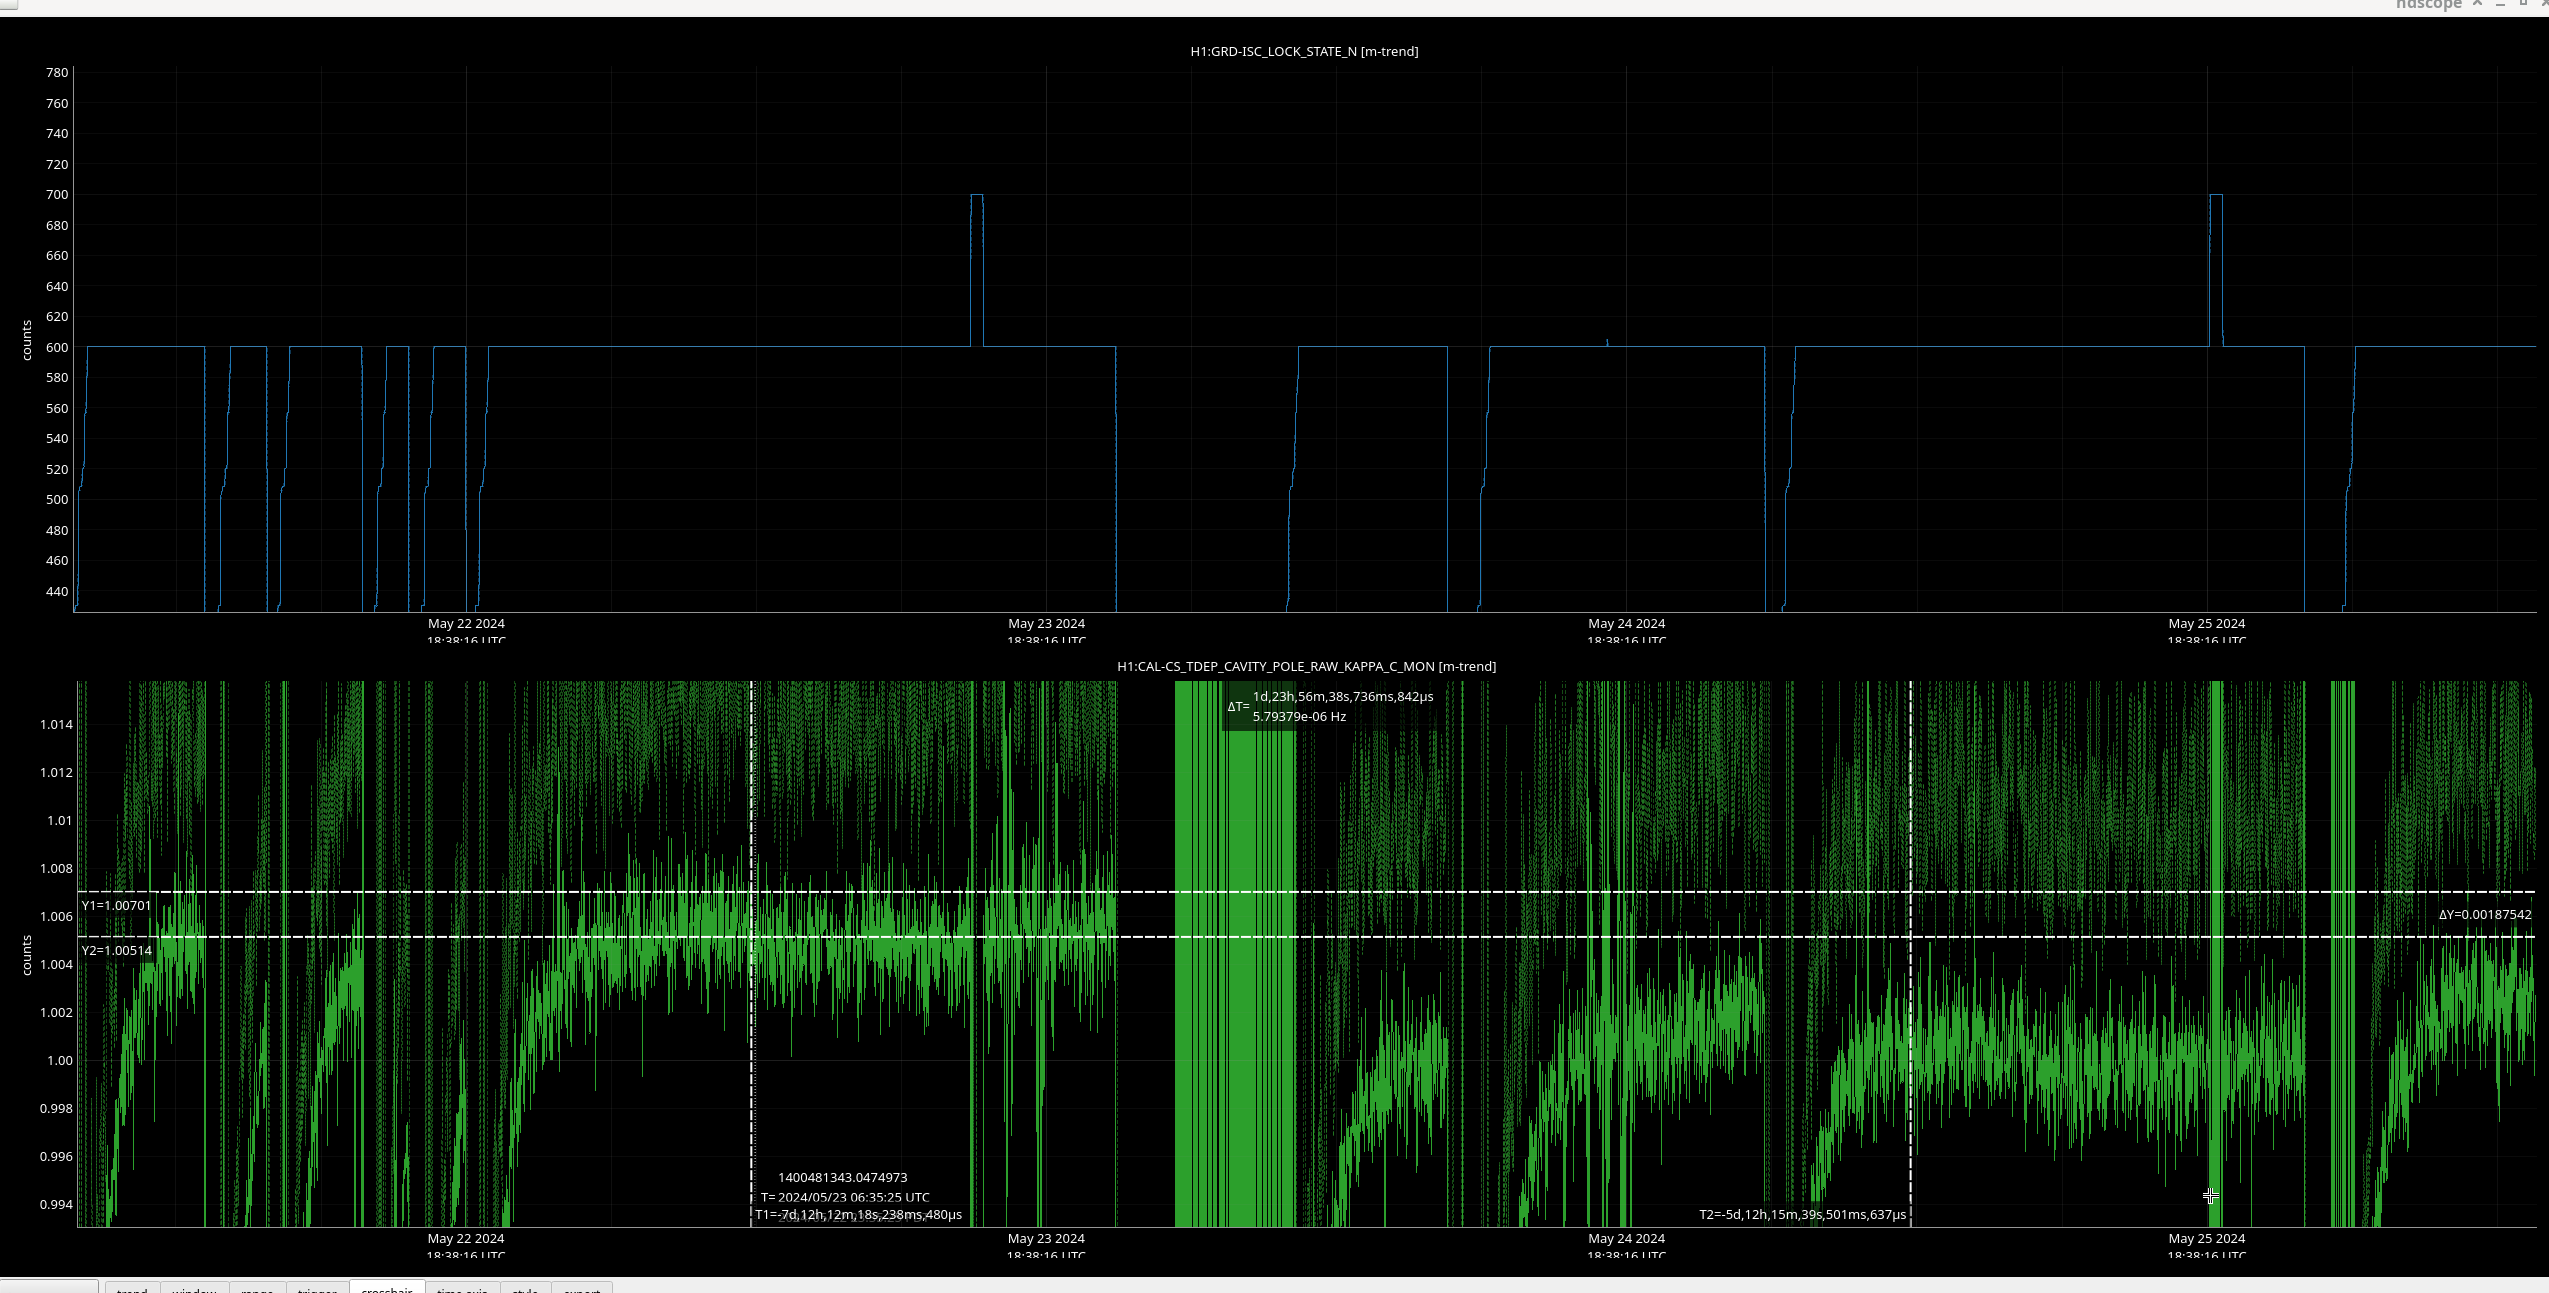
Optical gain after spot on OFI moved due to OFI damage: 2024-05-23 06:35:25 UTC 1.0051 +/- 0.0035
SR3 pitch and yaw positions and the SR2 pitch and yaw positions were changed on 28th May (starting at 19:14:34 UTC time).
SR3 and SR2 positions moved back to pre-28th values on 30th May (20:51:03 UTC time).
So we still should be able to gain around 0.0296 ~ 3% optical gain increase, provided we stay at the spot on the OFI we had post 24th April:
SR2 Yaw slider = 2068 uradians
SR2 Pitch slider = -3 uradians
SR3 Yaw slider = 120 uradians
SR3 Pitch slider = 438 uradians
Date | kappa_C | Optical Gain [mA/pm] | Comments |
---|---|---|---|
10th January | 1.0117 | 8.46 | O4a |
14th April | 1.0347 | 8.66 | Post vent |
23rd May | 1.0051 | 8.41 | Post OFI 'burn' |
I'm not really sure why, but our optical gain is particularly good right now. And, it's still increasing even though we've been locked for 12+ hours.
The other times in this plot where the optical gain is this high is about April 5th (well before the OFI incident), and May 30th.
Actually, this *might* be related to the AS72 offsets we've got in the guardian now. Next time we're commissioning, we should re-measure the SR2 and SRM spot positions.
Jennie W, Sheila, Louis
I recalculated the optical gain for pre-vent as I had mixed up the time in PDT with the UTC time for this measurement, it was actually from on the 11th January 2024.
Also the value I was using for OMC-DCPD_SUM_OUT/LSC-DARM_IN1 in mA/counts changes over time, and the optical gain reference value in counts/m also changes between before the vent, April, and now.
Louis wrote a script that grabs the correct front-end calibration (when this is updated the kappa C reference is updated) and the measured OMC-DCPD_SUM_OUTPUT to the DARM loop error point.
Instructions for running the code can be found here.
The code calculates current optical gain = kappa C * reference optical gain * 1e-12 / (DARM_IN1 divided by OMC-DCPD_SUM)
[mA/pm] = [counts/m] * [m/pm] / [counts/mA]
All the kappa Cs in the table below and all the optical gains were calculated by Louis's script except for the 14th April.
I calculated the optical gain on the 14th April assuming as in the entry above that we would have got a (~0.0189) increase in kappa C if we had previously (before the 14th April) implemented the OMC alignment offsets we in fact implemented post OFI burn, on 1st May.
I went to these reference times and measured coupled cavity pole, f_cc and P_circ the arm cavity power.
I also checked the OMC Offset and OMC-DCPD_SUM for these times (which shouldn't change).
Date | kappa_C | f_c | Optical Gain [mA/pm] | P_Circ X/Y | OMC Offset | OMC-DCPD_SUM | Comments |
---|---|---|---|---|---|---|---|
06:36:26 UTC |
1.0122 | 441 +/- 7 | 8.33 | 368 kW +/- 0.6kW | 10.9405 +/- 0.0002 | 40mA -/+ 0.005 | O4a, time actually 11/01/2024 06:36:26 UTC |
03:54:54 UTC |
1.0257 | 391 +/- 7 | 8.70 | 375 +/- 0.8 kW | 10.9402 +/ - 0.0002 | 40mA -/+ 0.003mA | Post vent |
06:35:41 UTC |
1.0044 | 440 +/- 6 | 8.52 | 382 kW +/-0.4 kW/ 384 kW +/- 0.4 kW | 10.9378 +/- 0.00002 | 40mA +/- 0.006 mA | Post OFI 'burn' |
09:43:04 UTC |
1.0171 | 436 +/- 7 kW | 8.62 | 379 kW +/- 0.6 kW/ 380 kW +/- 0.5 kW | 10.9378 +/- 0.00002 | 40mA +/- 0.004 mA | Post HAM6 pressure spike |
In summary we have (8.62/8.70) *100 = 99.1% of the optical gain that we could have achieved before the OFI burn, and our current optical gain is (8.62/8.33)*100 = 103.5 % of that before the vent.
We do not appear to be doing worse in optical gain since the vacuum spikes last week.
LLO noted a 10 Hz comb that was attributed to the IRIG B monitor channel at the end station connected to the PEM chassis. (https://alog.ligo-la.caltech.edu/aLOG/index.php?callRep=71217)
LHO has agreed to remove this signal for a week to see how it impacts our DARM signal.
EX and EY cables have been disconnected.
Disconnection times
EX | GPS 1400946722 | 15:51:44 Tue 28 May 2024 UTC |
EY | GPS 1400947702 | 16:08:04 Tue 28 May 2024 UTC |
I checked H1:CAL-PCALX_IRIGB_DQ at gps=1400946722 and H1:CAL-PCALY_IRIGB_DQ at gps=1400947702. From 10 seconds prior to the cable disconnection to 1 sec before the cable disconnection, IRIG-B code in these channels agreed with the time stamp after taking into account the leap second offset (18 sec currently).
Note that the offset is there because the IRIG-B output from the CNS-II witness GPS clock ignores leap seconds.
I fixed things in https://svn.ligo.caltech.edu/svn/aligocalibration/trunk/Common/Scripts/Timing/ so that they run in the control room with modern gpstime package and also the offset is not hard coded. I committed the changes.
Please reconnect the cable soon so we have independent witness signals of the time stamp. There could be a better implementation but we need the current ones until a proper fix is proposed, approved and implemented.
I have checked the weekly Fscans to look for similar 1 Hz and 10 Hz combs in the H1 data (which we haven't see in the H1 O4 data thus far), or any obvious changes in the H1 spectral artifacts occurring due to the configuration change May 28. I do not see any changes due to this configuration change. This may be because the coupling from the timing IRIG-B signal may be lower at LHO than it is at LLO. I do notice that there is some change around the beginning of May 2024 that the number of line artifacts seems to increase; this should be investigated further. Attached are two figures showing the trend of 1 Hz and 10 Hz comb, where the black points are the average comb power and colored points are the individual comb frequency power values; color of the individual points indicates the frequency. Note that there is no change in the last black data point (the only full-1-week Fscan so far).
The IRIGB cables at EX and EY have been reconnected (PEM AA Chassis CH31).