
kyle.ryan@LIGO.ORG - posted 09:37, Sunday 20 November 2011 (1767)
CP1 and CP2 alarms
Level control valves frozen -> I'll be in around noon and will turn on trace heat
Level control valves frozen -> I'll be in around noon and will turn on trace heat
Level control valves frozen -> I'll be in around noon and will turn on trace heat
This morning, we reapplied First Contact to the ITMyAR in order to pick off a smudge left behind from the sheet of FC pulled yesterday.  In fact, this smudge was apparently removed via this second application and removal, but 2 new ones were left behind.  These were further from the center than the first, closer to 2-3 inches in from the edge.  Since we had not pulled the sheet completely, we just pulled it back up and spot treated over the problem areas with more FC.  Then we waited for these to dry before pulling the sheet completely.  There was still a bit of residue left in a line at the edge of the sheet in numerous places along the circle.  It took numerous acetone swipes to remove them.

After watching the paint dry for most of the day we finally got the ITMy AR clean enough to proceed with mounting the reaction chain.  By COB, we had it mounted, lower cables laced and clamped, and a first round of suspending complete.  Because the main chain was clamped in likely a subpar alignment during this, we noted that a bump stop was touching between the chains.  We will hang the main and the reaction together tomorrow to diagnose the reason to for the touch and continue with reaction chain pitch alignment.
Attached are plots of dust counts > .5 microns.
Anamaria and Dave.
I copied Anamaria's L1 PEM EX model to create the H2 PEM EY model. This model was then built and installed on h2pemey.
Cyrus, Jim, Filiberto, Dave
We powered up the IO Chassis for TCS at EY, connected the timing fiber optics, connected the OneStop fiber optics, built and loaded the IOP and TCS ETMY models.
h2tcsey front end system (cpu and IO Chassis) is now complete.
The Corner Station ion pumps were switched from automatic "step" voltage outputs to a fixed output of 7000V following the most recent Vertex+YBM vent. The pressure has dropped enough since then that 7000V is no longer optimal -> I reduced the output of one of six ion pumps to 5000V. The remaining ones will be adjusted soon.
A cleanroom was started today and has added sufficient heat to require adjustments. Therefore I have turned off one stage of heat to the VEA and Ski is going to drive out and dial down the chilled water setpoint.
If the suspension damping loops become instable, the ISI watchdogs must trip. Consequently, one of the ISI watchdog inputs is the state of the suspension watchdogs (for instance ITMY & FMY for BSC8). The connection between the ISI and the SUS model is realized using EPICS channels.
Seismic was concerned by the reliability of the EPICS connection between the two models that could trip the ISI watchdog in case of connection loss.
During two weeks, we exclusively fed the SUS-ITMY watchdog state variable into the ISI watchdog (making sure SUS-ITMY watchdogs could not trip). During this period, the state of the ISI watchdogs did not change. It confirms that we can use the EPICS channels for SUS-ISI watchdogs interactions.
B. Willke, P. Schwinberg, R. Savage

Yesterday, after cabling issues were sorted out, we gave the TTFSS (Table-top Frequency Stabilization Servo) a try.

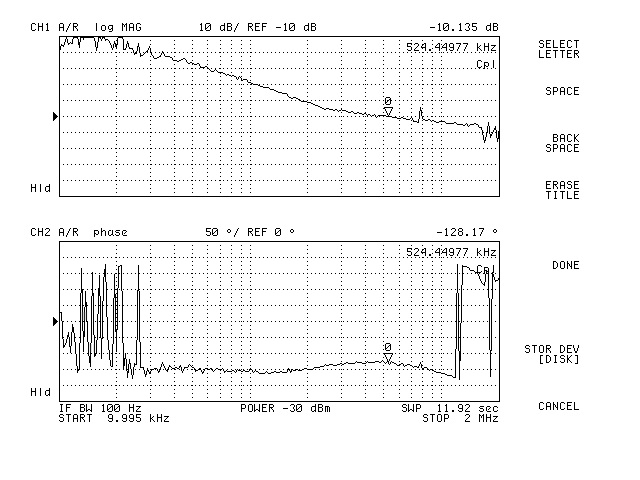
Once we got the FAST/PC signs adjusted, we were able to lock the loop and turn the gain up such that we achieved the desired UGF of about 525 kHz with about 52 deg of phase margin and more than 20 dB of gain at 100 kHz (see attached plots).  Note that the UGF is at -10 dB.

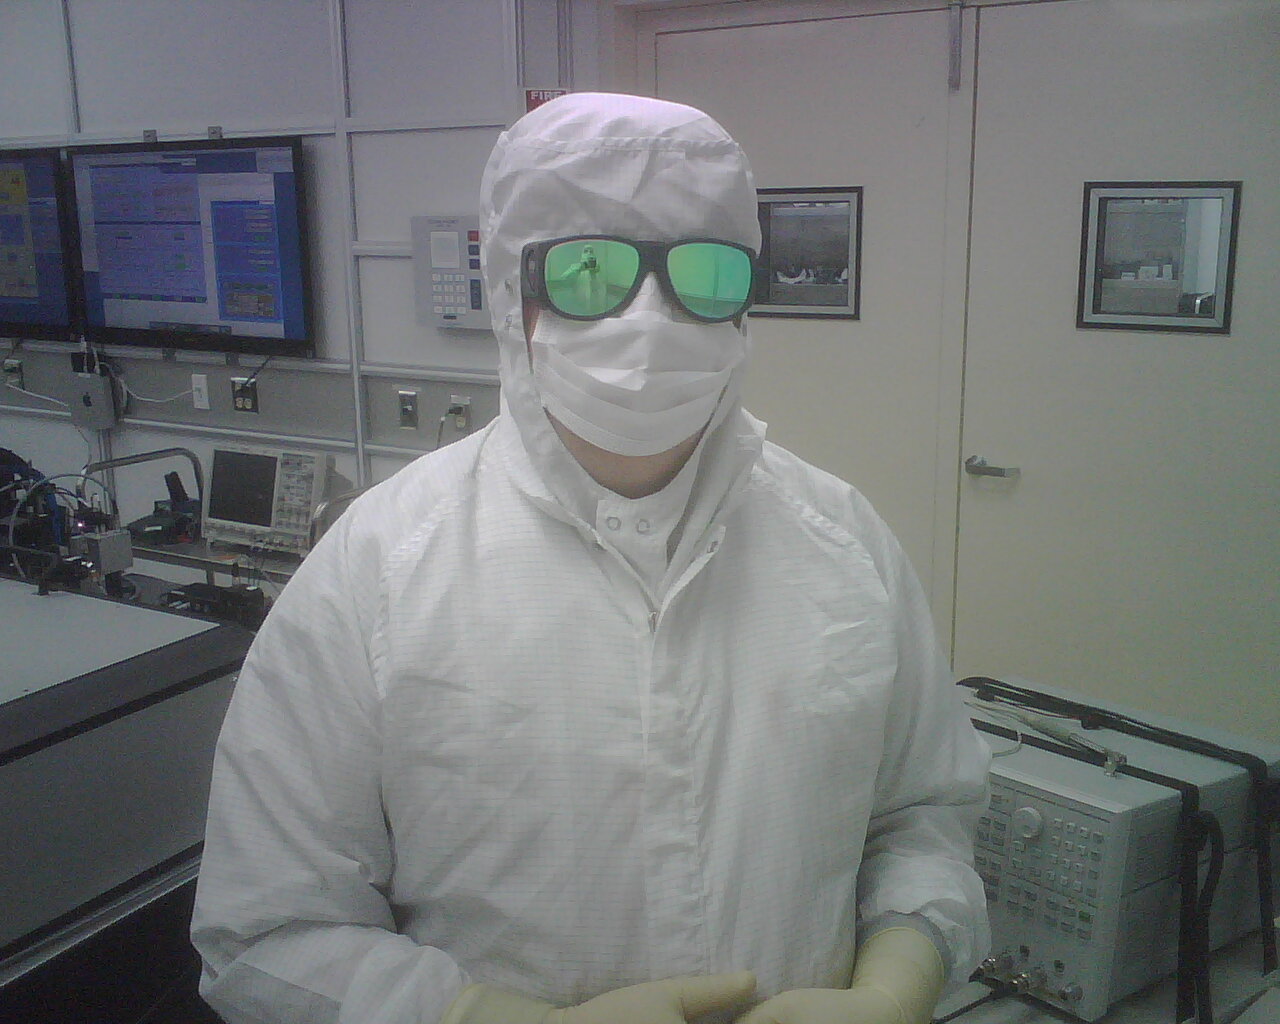
This servo had been fabricated and tested in 2004, and with Paul there (yes, suited up in the Laser Room - see attached photo), it was more than a bit of deja vu).

This was a milestone Benno had hoped to achieved before he leaves.  Now that we know this part works, he might even get some sleep on his flight back to Germany today.
J. Kissel, R. Quitzo-James

In all suspension TOP to TOP transfer functions that we've taken to high frequency (i.e. > 10 Hz), we have found a confusing turn up to a slope of ~f^(1), where we expect the slope to continue to drop off as f^(-2). At the advise of one P. Fritschel, we've taken M1 to M1, OSEM basis, transfer functions of H2SUSFMY both locked and unlocked to try and explain, if not at least identify, the source of this turn up. As Peter suspected, the locked spectra show the same turn up at high frequency. Aside from the mechanical resonances left in the transfer function, this implies that there is some fundamental coupling between the OSEM Coil drive and PD sensor. It has been suggested that this coupling may arise from coil current drive mixing the PD sensing current, either at the OSEM head, or some where along the electronics chain, as these signals are on the same cable.

Note, this is not necessarily of great concern, given that we use these TOP BOSEMs for local damping between ~0.1 and 10 Hz, and perhaps for low frequency ISC offloading; all control authority will be rolled off aggressively by 10 Hz. These transfer functions are taken with basically the maximum amount of current going through the coils (to get the best SNR for the measurement), so with the fast roll off of control authority above 10 Hz, I expect this noise source will be negligible.

Attached are two sets of plots:
2011-11-15_H2SUSFMY_hfturnup_M1TFs.pdf -- The collection of M1 to M1, OSEM basis, H2SUSFMY transfer functions comparing the measured, suspended transfer function (GREEN) against a model of that transfer function (CYAN) composed of the production, suspended model transfer function (RED) plus the locked transfer function (BLUE). The model agrees very well with measurement, aside from some scaling factors in the F1, F2, and F3 sensors. (Details below -- **).

2011-11-15_H2SUSFMY_hfturnup_currentcoupling.pdf -- IF the mechanism is sensing current mixing with drive current, this plot shows the locked transfer functions for each degree of freedom calibrated into PD Sensing Current per Coil Drive Current. The calibration assumes the same [m/N] calibration that is always used to scale measurements (a factor of 60 for aLIGO production electronics), and then converted to current assuming a force coefficient of a 10x10mm magnet with a BOSEM coil -- 1.694 [N/A] (see T1000164), and displacement sensitivity of 62.5e-2 [A/m] (see T1100479, or T0900496).


---------------------
Details **
---------------------
The production matlab models of the aLIGO suspensions are in the EULER basis, so it took a little bit of math to get the model suspended transfer function into the OSEM basis. The math is as follows:

Assume the model, euler basis, mechanical transfer function is a 6 x 6 matrix, Pe. Hence, the 6x1, euler basis, response vector VRe, is related to the 6x1, euler basis, drive vector VDe, by
     VRe = Pe VDe                       (1)

However, we can decompose the euler basis drive and response vectors into their respective OSEM basis, using the known OSEM2EUL, oMe, and EUL2OSEM, eMo matrices:
     VRe = oMe VRo                 (2)
     VDo = eMo VDe
     => VDe = (eMo)-1 VDo         (3)

which means, that we can solve Eq. (1) for the OSEM basis transfer function,
     VRe = Pe VDe
     oMe VRo = Pe (eMo)-1 VDo
     VRo = (oMe)-1 Pe (eMo)-1 VDo  (4)

Now, this would be easy to do in matlab, IF the Pe matrix was a 2D matrix, like the OSEM2 EUL and EUL2OSEM matrices, but because Pe is a 3D matrix, response x drive x frequency, I had to do the matrix multiplication "by hand," i.e.

[ Pe (eMo)-1 ](i,j,f) = Σn  Pe(i,n,f) (eMo)-1(n,j)

[(oMe)-1 Pe (eMo)-1](i,j,f) = Σm (oMe)-1(i,m) [ Pe (eMo)-1 ](m,j,f)


This conversion of the model, i.e. exercise of brute-force math, seems have done awesomely at predicting the < 10 Hz frequency response and DC scaling of the transfer function for LF, RT, and SD, especially after including the normalization factors that are present for each OSEMINF gain to account for the OSEMs sensitivity variations. However, I'm still missing a factor of ~1.5 for the three FACE sensors that I can't figure out from where it comes. I'm not gunna bang my head against the wall about it -- the point of the measurements has been made!

--------------
Data / Analysis
--------------

Raw Data:
${SusSVN}/sus/trunk/BSFM/H2/FMY/SAGM1/Data/111115_H2SUSFMY_WhiteNoise_??_0p1to900Hz_bsfm*locked.xml
Exported Data:
${SusSVN}/sus/trunk/BSFM/H2/FMY/SAGM1/Data/111115_H2SUSFMY_WhiteNoise_??_0p1to900Hz_bsfm*locked_tf.txt

Analysis:
${SusSVN}/sus/trunk/BSFM/H2/FMY/SAGM1/Scripts/analyze_111115_H2SUSFMY_M1_lockedvsunlocked.m
I'll provide visual evidence some time in the future, but we've now seen after installing FMY in chamber, where production electronics and properly shielded, twisted pair cabling is used, we no longer see this high-frequency turn up.
Today, the course pitch adjusters on the top stage of the main chain were adjusted (very iterative). After a few rounds of fine adjustments, the pitch of the ITMy was set to under 1 mRAD.

We proceeded to bring the lower reaction chain in to mate.  We pulled the FirstContact from the CP HR and cleaned off leftover particulate with swaps and the N2 gun.  I had to do an acetone wipe around the entire edge of where the FC was, in 1" from the ID of the gold coating.  I also had to do a spot acetone cleaning on a smudge at 6 o'clock about 2" in from the hold coating.not sure why the apparent FC smudge didn't come off with the sheet.

Then, we pulled the FC off of the ITMy AR. We observed a streak almost centered on the AR surface likely from the FC.  Maybe the FC was too thin here, although the sheet did not break in this location. This streak is too central on the mass, so unfortunately we will have to reapply another sheeyt,  let it dry, and pull it in hopes it picks up the smudge. We had to abort mating the reaction chain until this is finished and the AR surface is clean.  Note, we still observe particulate on the masses, even after N2 blowing.
Some details and numbers regarding the pitch adjustments done yesterday.
Before the fine adjustments the quad hang pitch was measured:
The resultant pitch change for one CCW turn on each pitch adjuster was approximately 436 urad down.
Attached are plots of dust counts > .5 microns for approximately 1 day ending around 18:00 PST.
J. Garcia, J. Kissel Thex1susquad.mdlmodel on the X1 SUS Test Stand was modified to match the H2 ITMY model. TheQUAD_MASTER.mdllibrary part from'/opt/rtcds/tst/x1/cds_user_apps/trunk/sus/common/models/'was imported and replaced the existing block in thex1susquad.mdl. Major changes were the output OSEM drive channels were changed from "*OSEMOUTF_*" to "*COILOUTF_*". The X1SUSQUAD.ini file was also edited to include the *COILOUTF_* filters. The new watchdog AC-coupled & band-limited filters were also implemented as in the H2 ITMY watchdogs. However, the Binary I/O channels and ISC input filters were terminated in the Test Stand model. The model was re-compiled and "make installed" then the frontend rebooted to confirm changes. It's location is in:'/opt/rtcds/tst/x1/cds_user_apps/trunk/sus/x1/models/x1susquad.mdl'. The build location for the X1 Test Stand model is'/opt/rtcds/tst/x1/core/release/src/epics/simLink/'. This location's "x1susquad.mdl" is linked to the actual model location above. The x1 quad overview medm -'/opt/rtcds/tst/x1/cds_user_apps/trunk/sus/common/medm/quad/SUS_CUST_QUAD_OVERVIEW.adl'- was also modified to macro-substitute the X1 Test Stand parameters. A new SITEMAP.adl was created for the X1 Test Stand. Its location is now in'/opt/rtcds/tst/x1/cds_user_apps/trunk/cds/x1/medm/X1SITEMAP.adl'. It only has links to the X1 QUAD medm, but future revisions will include the BSFM and other suspension builds.
J. Batch, J.Kissel

We discovered a sneaky epics failure mode during this upgrade:
(1) Copied known function foton file from H2SUSITMY.txt to X1SUSQUAD.txt
(2) Replaced all instances of "ITMY" with "QUAD"
(3) Loaded new coefficients on X1 SUS QUAD's GDS_TP screen.

Opened up the X1:SUS-QUAD_M0_WD_OSEMDC_BANDLIM_F1 filter bank, in order to turn on the filters, but noticed that they weren't loaded, where my "figure of merit" of a loaded filter was whether there was a name inside the epics channel above the FM button (e.g. X1:SUS-QUAD_M0_WD_OSEMDC_BANDLIM_F1_Name00). A further point of confusion was that when one middle clicked on that epics field, it appeared white instead of green. Otherwise the "name" field just looked like the usual gray, empty filter bank.

It turns out, after some good detective work by Jim, he found that the filter *was in fact loaded* --
 - foton says it was fine
 - the message field on the GDS_TP screen (X1:FEC-10_MSG) said the coefficients were loaded
 - when the filter FM button was hit, the readback bits when green-green (as opposed to when there is no filter in the bank, when only the first of the two bits goes green)

but the problem lie in that the test stand was using the epics-3.14.10 library, instead of the epics-3.14.10_long; an oversite in his upgrade to the test stand the other day. As in, the "name" variable for those filter banks that were "not loading" was too long, so it was left blank (and showed white upon middle click).

Once the epics softlink
/ligo/apps/linux-x86_64/
was changed to epics-3.14.10_long, (and we killed the x1susquad, and x1iopsustst1 processes, and restarted the frontend computer), the filter banks showed the filter just fine.

Sneaky, sneaky, sneaky.


/ligo/apps/lin
- NSF Review ongoing
- NSF group tours LVEA, Staging Building, Fiber Lab, beginning at ~2pm
- Dust levels unremarkable except when tour was adjacent to BSC8
- Welding ongoing by BSC4
- ICC by HAM11
- Setting for H2 IMC chamber
- CDS folks at EY fixing h2pemey
- Squeezers going to laser hazard tonight
Found epics version on front end computer was not linked to long name version. Linked rtapps/epics on front end to correct version, rebooted front end, restarted IOP and x1susquad. All medm data now shows up on the medm screens.
J. Batch, J. Kissel

Last night, I'd attempted to add

H2:SUS-FMY_M2_WIT_L_DQ
H2:SUS-FMY_M2_WIT_P_DQ
H2:SUS-FMY_M2_WIT_Y_DQ

to the stored frame builder channels, at 2048Hz, and managed to crash the front end in doing so.

My exact steps where
(1) Uncomment the above three channels (and each of their associated four lines below it),changed  acquire=1 and datarate=2048
(2) On the H2SUSFMY GDS_TP screen, I hit DAQ RELOAD, and the status changed to 0x2bad
(3) Waiting ~30 seconds (while I was trying to remember how to log into the frame builder), and the front end crashed.
(4) I could not log into the framebuilder, via the usual
telnet h2dc0 8087.

This morning, after consulting with Jim, he ran an inicheck on my edited .ini file, which gives it an OK.

controls@cdsws2:/opt/rtcds/lho/h2/chans/daq 0$ inicheck H2SUSFMY.ini
Opening input file H2SUSFMY.ini

Sample rate of system:                 16384
Longest channel name length used:         41
Total number of inactive channels:       463
Total number of active channels:         157
Total channels acquired:                 156
Total testpoints allowed:                  8
Total data rate:                     1515520

controls@cdsws2:/opt/rtcds/lho/h2/chans/daq 46$


We took the following steps to bring the computer back up:
(1) We could not log into the computer via ssh, so we moved over to the cdsimac0, and opened IPMI Viewer
   (a) On the desktop toolbar, select Apple > Recent Items > Recent Items > IPMIView20.jar
   (b) Select (double click) h2susb78
   (c) Login as controls
   (d) Select IPM Device Tab
   (e) Hit "Power Cycle"
   This, after a little bit of time, brought the front end back up with frame builder status 0x2000, as should have been originally
(2) Logged into (without problems) and restarted the frame builder
   (a)
       controls@cdsws2:/opt/rtcds/lho/h2/userapps/release 0$ telnet h2dc0 8087
       Trying 10.201.0.160...
       Connected to h2dc0.h2fe.ligo-wa.caltech.edu.
       Escape character is '^]'.
       daqd> shutdown
       ....
       controls@cdsws2:/opt/rtcds/lho/h2/userapps/release 0$

   This brought the framebuilder back up, and restored the status to 0x0
(3) Burt restored h2susfmy
   (a) controls@cdsws2:/opt/rtcds/lho/h2/userapps/release/sus/h2/burtfiles 46$ burtgooey &
   (b) Restore > Snapshot Files > Double Click h2susfmy_m1transferfunctions.snap > OK > Cancel
   (c) Restore
(4) Look through filter banks to ensure filter coefficients have been restore / loaded properly
(5) Reset the watchdog.

Finally, now that the system is back up, I've
(a) Confirmed the channels are visibe in dataviewer, and
(b) Taken a quick DTT spectra in the present and in the past to be sure that they're (a) visible, (b) usable, and (c) stored.
