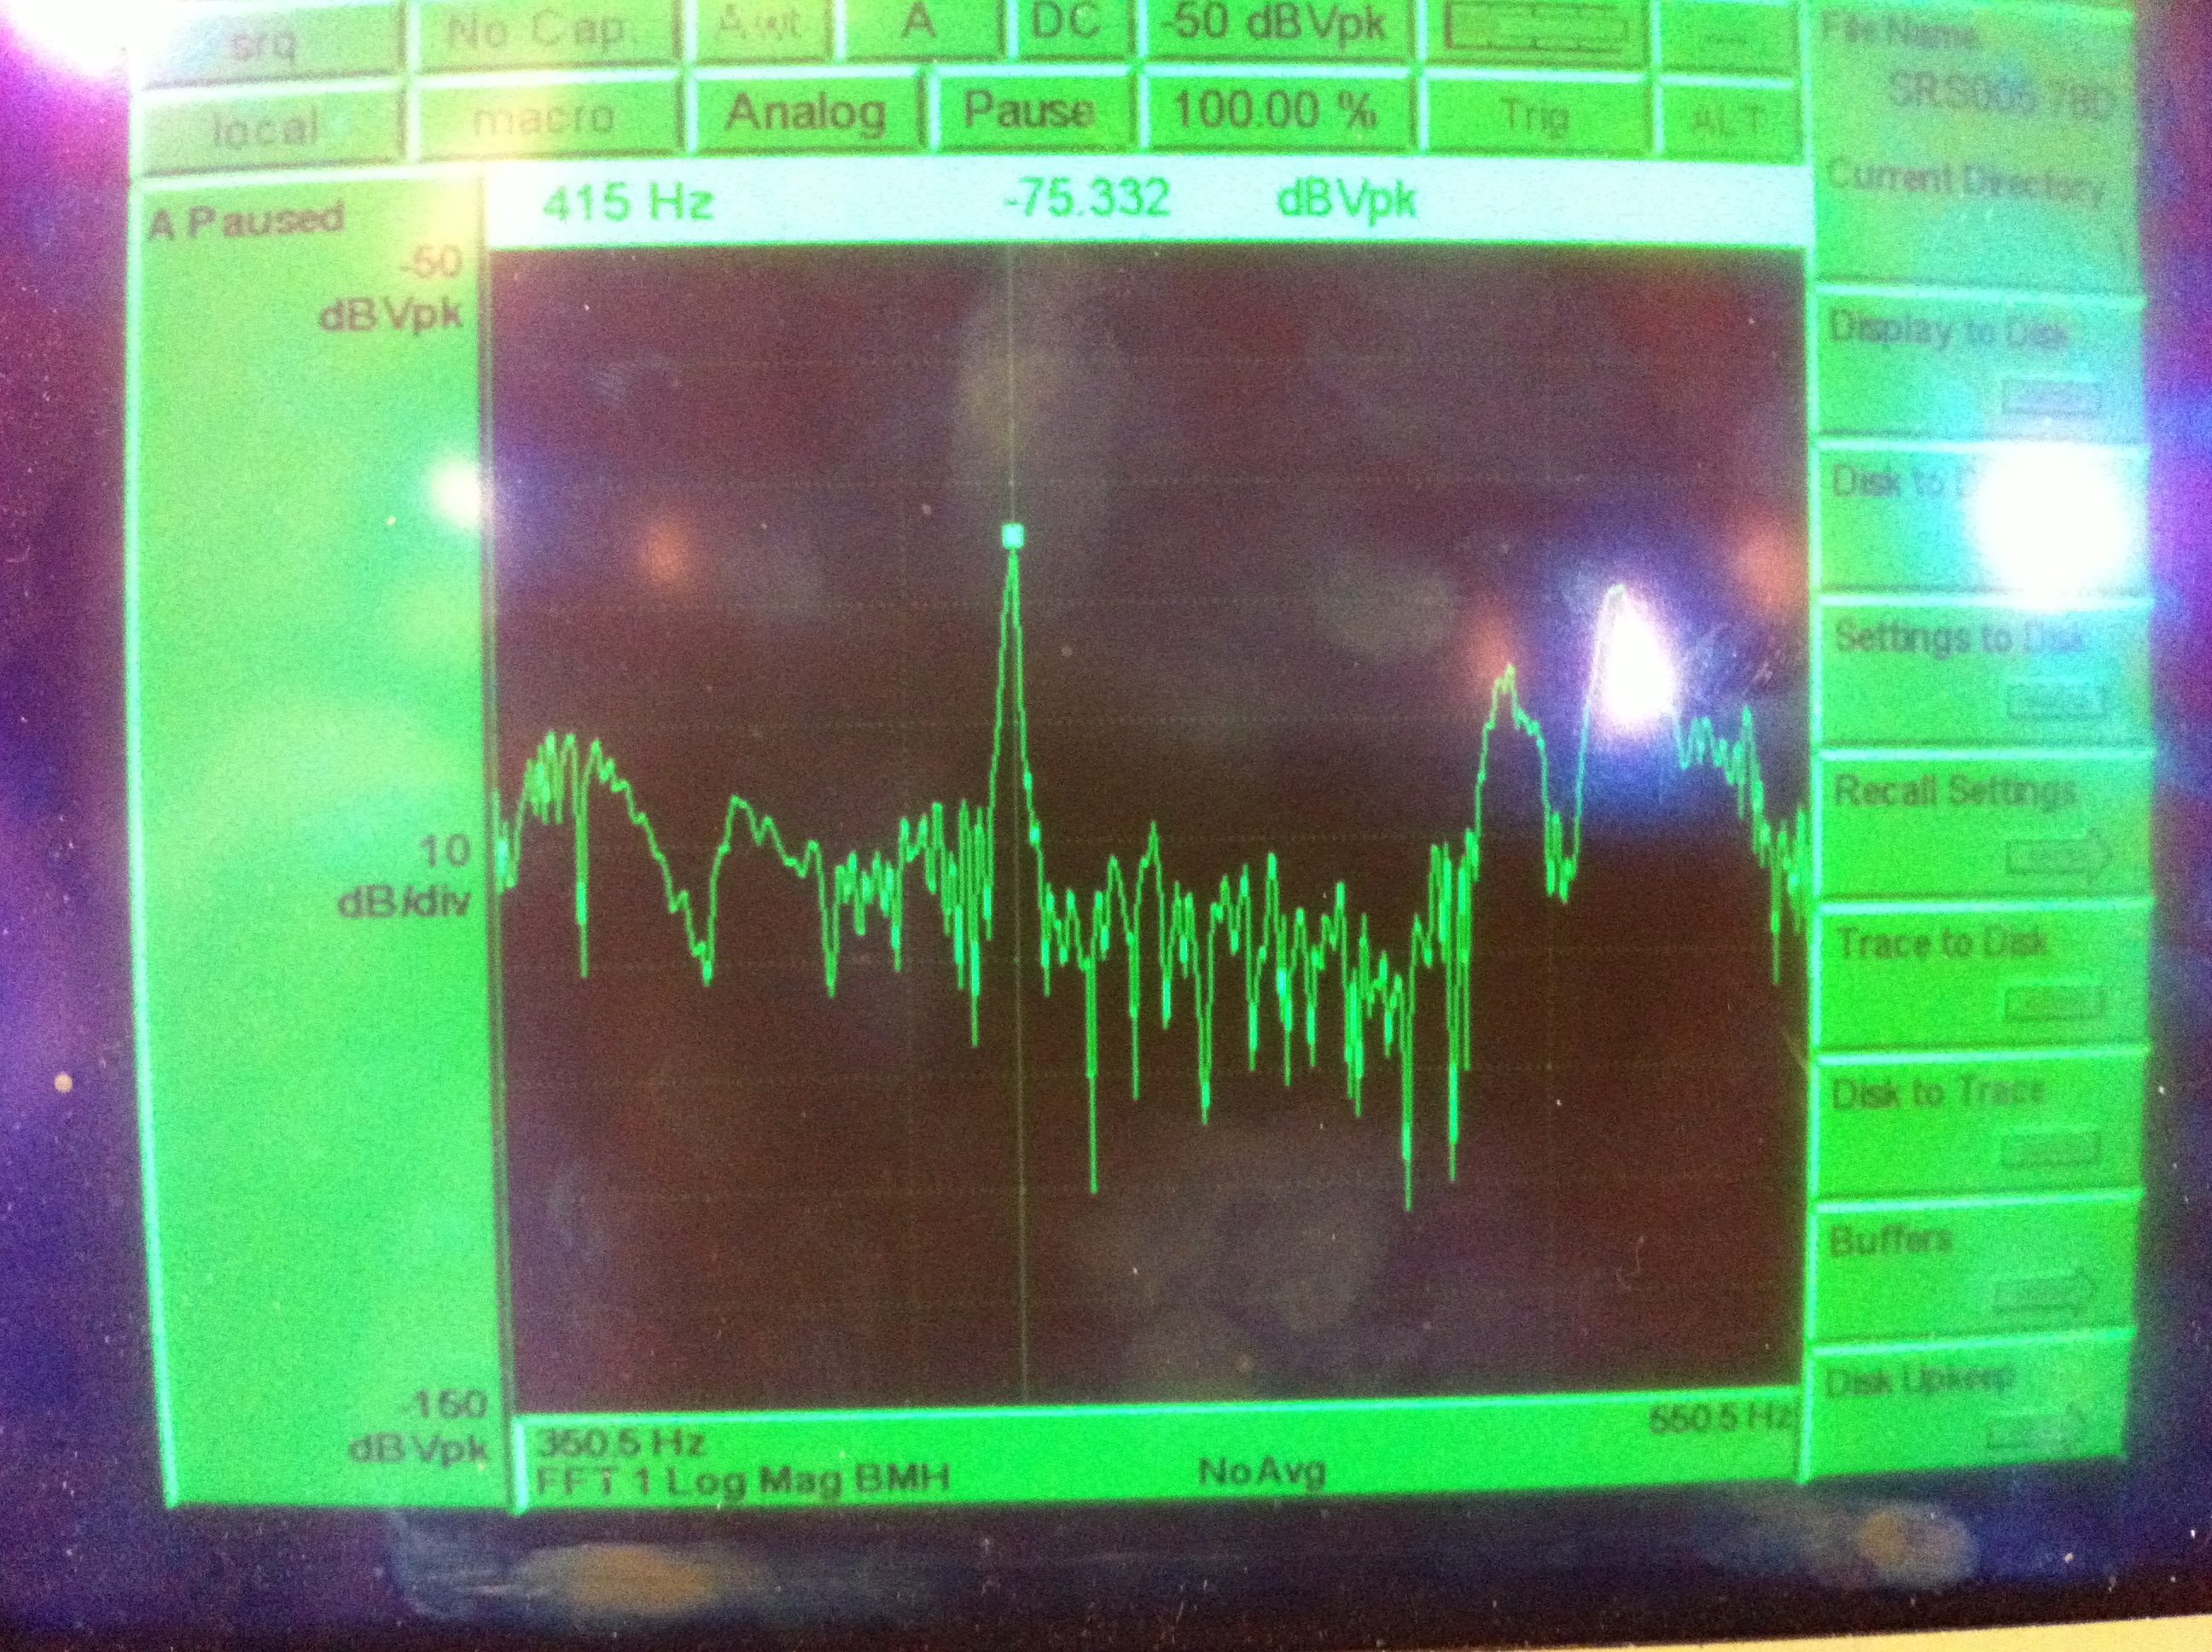
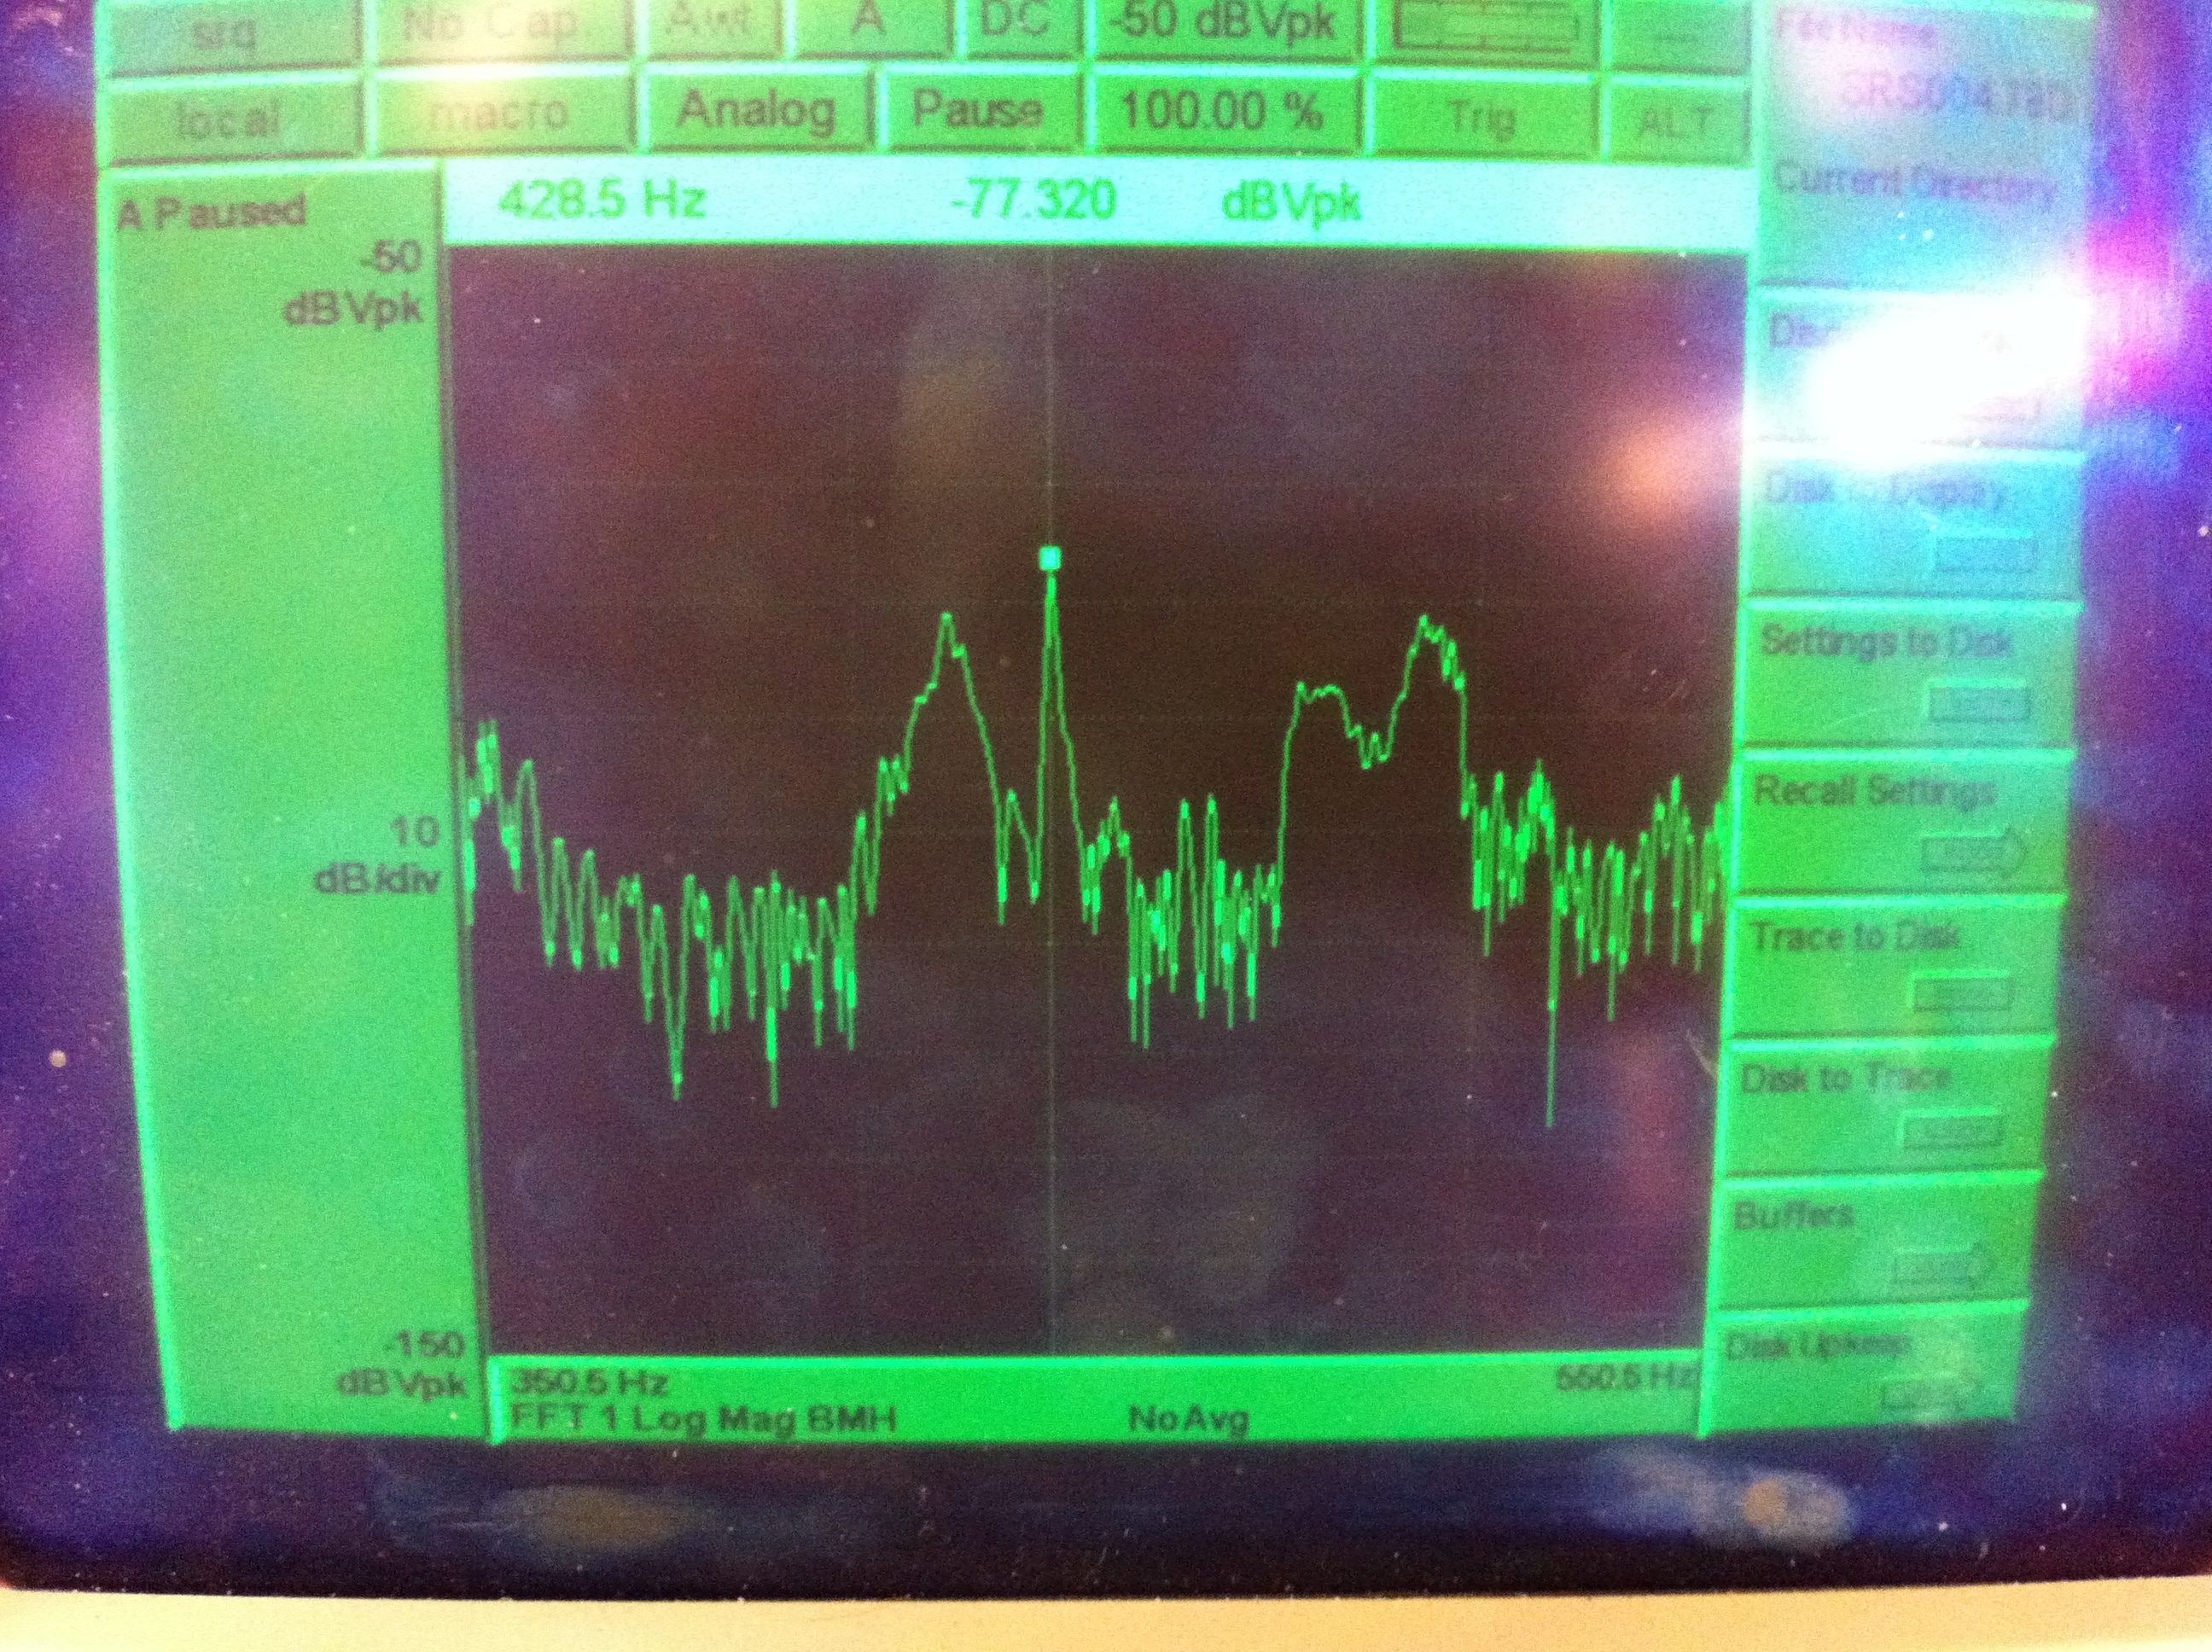
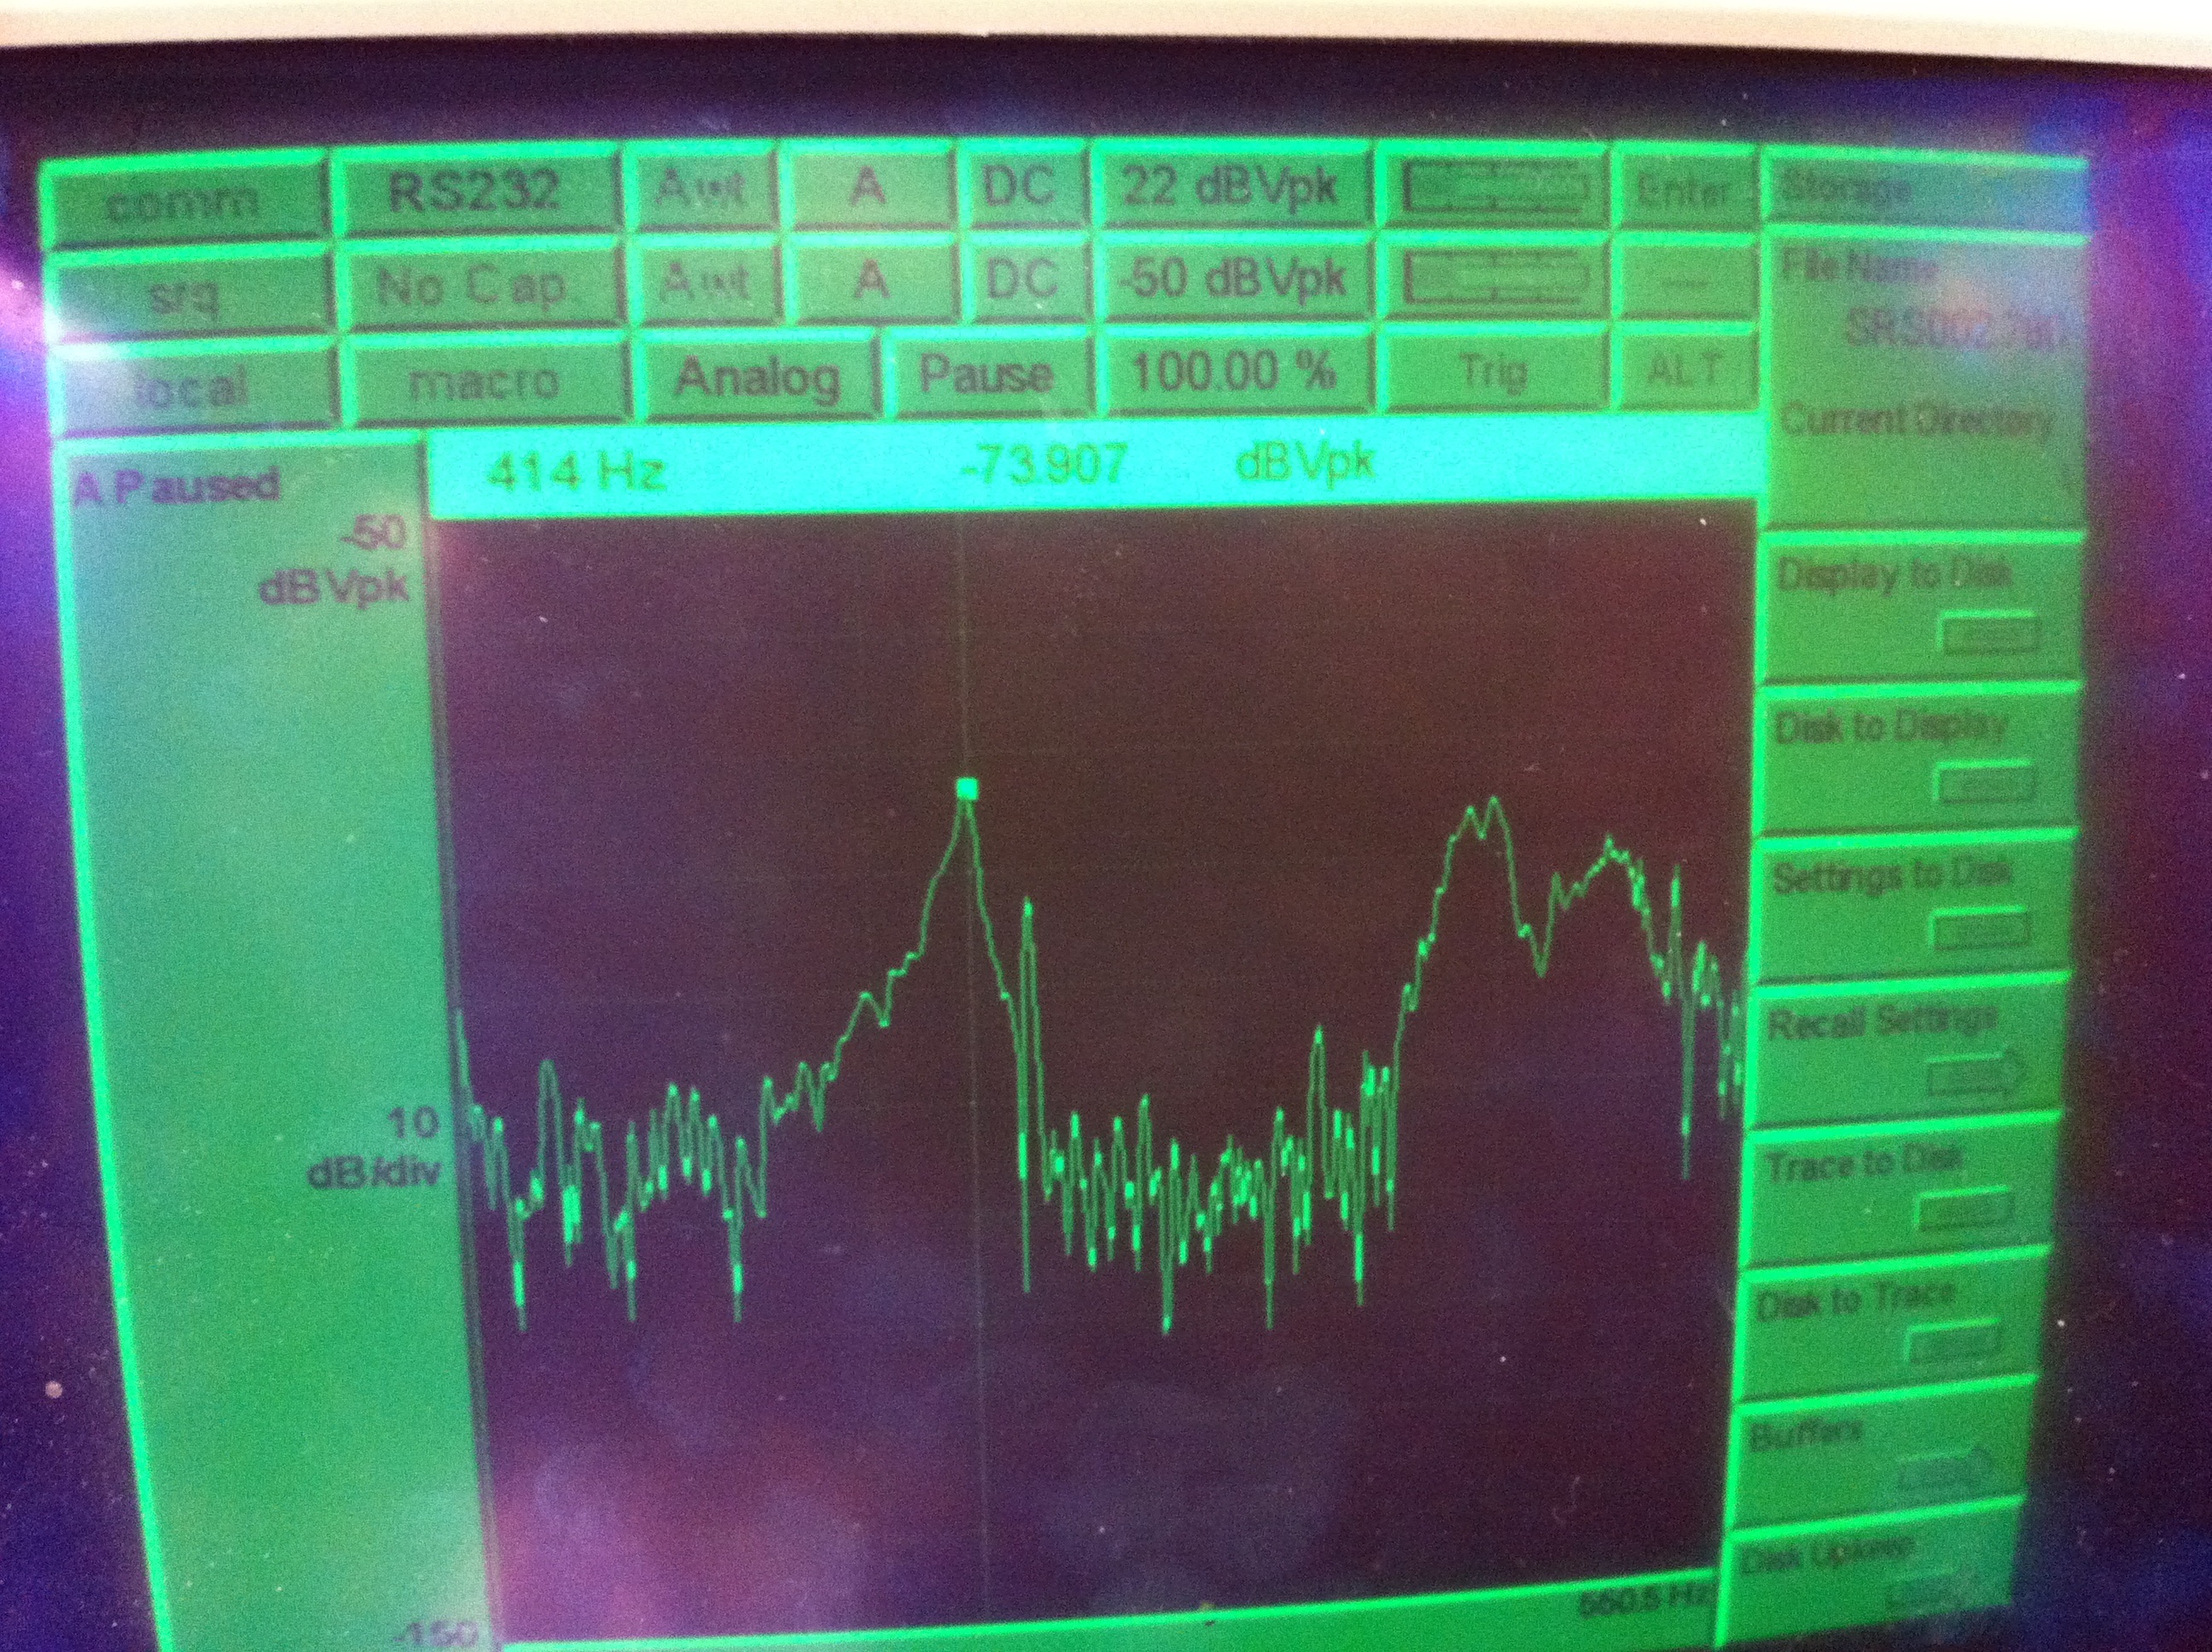
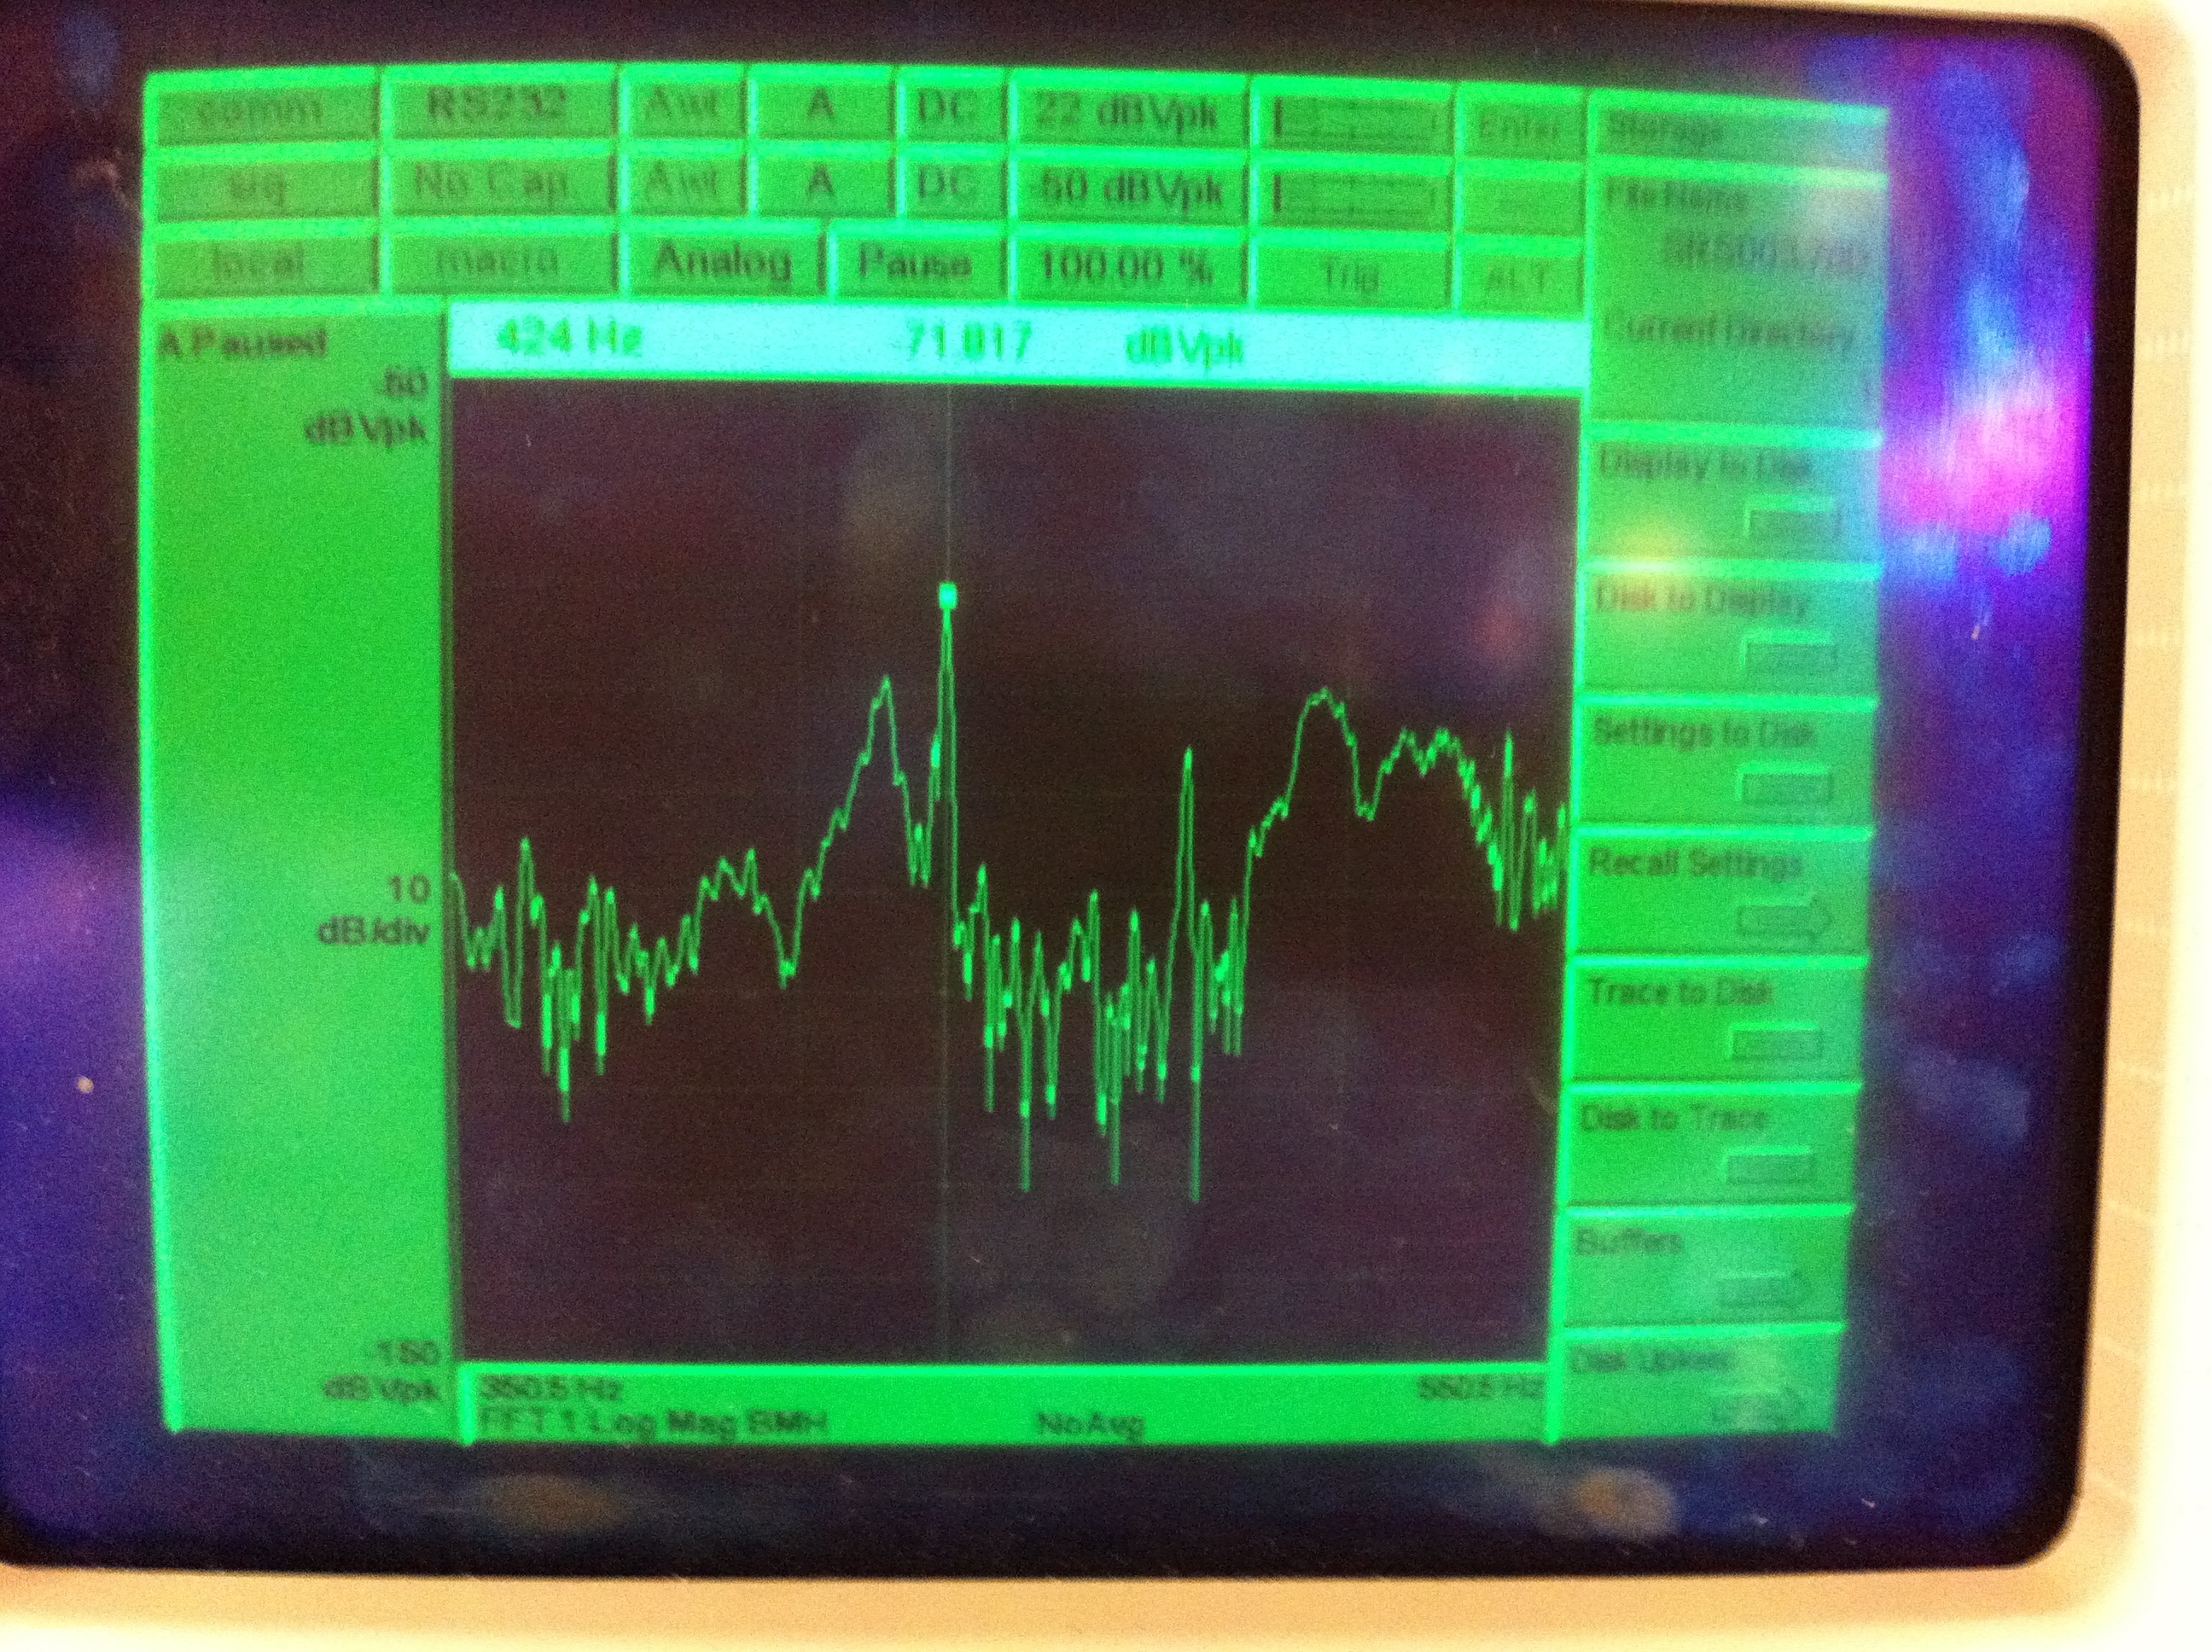
For more insight into the monolithic stage imbalance, I measured the violin modes of the wire segments supporting the PUM. The procedure was as for the fibre violin modes, except with the laser and QPD raised higher. The beam path was a few mm above the top of the mass and a few mm below the side shelves on the LSAT. The observed frequencies were left front 415 Hz left back 428.5 Hz right front 414 Hz right back 424 Hz
The .ini file "X1SUSQUAD.ini" did not have the channels needed for measurements uncommented. The file was backed up in '/opt/rtcds/tst/x1/chans/daq/archive/' and edited for data acquisition by the DAQ. The DAQ was restarted and the channels confirmed.
QUAD 04 BUILD 03 Now that the QUAD 04 has become BUILD 03, OSEM diagonalization measurements were performed this afternoon on the M0 and R0 top masses. Two degrees of freedom were used for excitations while the responses of the individual OSEMs were plotted. The first attachment is of the M0 "Vertical" DoF diagonalization measurement. The excitation was a sine wave at 2.25Hz with 100cts of amplitude. The OSEM isolation from "Vertical" is at about ~34dB. The second attachment is of the R0 "Yaw" DoF diagonalization measurement. The excitation was a sine wave at 1.3Hz with 100cts of amplitude. The "F1" OSEM isolation is at about ~24dB. All other OSEMs are more isolated from "Yaw". The third attachment is of the R0 "Vertical" DoF diagonalization measurement. The excitation was a sine wave at 2.25Hz with 100cts of amplitude. The isolation is at about ~38dB from non-"Vert" OSEMs. The M0 "Yaw" measurement was also performed with the same parameters as the R0 top mass and produced results that indicate "F1" is ~24dB isolated from "Yaw". The plot was lost during a DTT crash, but will be posted when re-measured.
M0 Yaw Diagonalization tests were performed again on the QUAD 04 BUILD 3. Results are attached. The M0 F1 OSEM is about 24dB isolated from the Yaw DoF. Excitation was a sine wave at 1.3Hz with 100cts amplitude.
The ICC crew brushed about 80% of the chamber today after completing the usual round of pre-work wipe and FTIR samples. Dust counts were rigorously monitored due to the close proximity of the chamber to the test stand/fiber-welding areas. Drills were troublesome today (5 used) and one indicator that drills are having trouble is higher than usual particle counts. We were in touch with the control room a couple of times to report particle spikes in the chamber so that the information could be correlated with the dust counts being collected in the LVEA and adjacent cleanrooms.
Attached are plots of dust counts > .5 microns.
Attached are the trend plots for the three dust cameras 3, 4, & 11. Dust Monitor 3 and 4 were located in the clean room over the ISI/Quad Test stand. Dust Monitor 11 was located between the aforementioned clean room and the clean room over HAM 12 where ICC were using drills throughout the day. The plots are intended to look for any high dust counts that could connect monitor 11 to 3 and 4. This would indicate the effectiveness of the anti-contamination mechanisms which are put in place to prevent particles from affecting the ITM, such as the HEPA filters over the ISI and the filter on the various drills which are used for ICC. Preliminary Analysis: Dust Monitor 11 is located outside of the clean rooms so it is subject to high amounts of particulates leading to its count remaining high through most of the day but there were two relatively large spikes at approximately 18:00 and 23:00. The first large spike could possibly be when the drills first started combined with a large amount of people walking past the monitor. Dust Monitor 3 is relatively low in the morning but picks up around 19:00, attributed maybe to normal activities. The largest dust counts come towards the end of the day but does not seems to be caused by the drilling as indicated by Dust Monitor 11. Dust Monitor 4 shows very high dust counts at 19:00 also as well as 20:00. To be noted, at approximately 23:15 Dust Monitor was disconnected and adjusted so readings during this time are mostly likely invalid. All in all, judging from the graphs shown, it seems like the the amount of particles that are showing up between the two clean rooms are not correlated to the high dust counts that are indicated by the monitors 3 and 4 in the ISI clean room throughout the day. On Monday, the ICC team plans to continue and it'd be a good chance to re-apply a similar analysis.
QUAD 04 BUILD 03
Today the latest Build of QUAD 04 was completed by Jeff B. and Andres R. This work signifies the transition of "QUAD 04 BUILD 02" to "QUAD 04 BUILD 03". The following is an excerpt from an email sent by Jeff Bartlett on 11/10/2011 to members of the LHO SUS group explaining the mechanical adjustments made to QUAD 04:
"We removed shims from the Reaction chain to correct optical viewed
roll and fix optical viewed and ruler measured height. There are now
zero shims on the left blade and 3mm of shims on the right side. The
test masses for both chains are sitting at 21mm. This agrees with the
optical level. I did not think the effort was worth the reward for a
0.5mm height change. The optical lever shows a slight bit of pitch
differential between the chains. However, as I will discuss later this
measurement is suspect.
There is differential yaw between the masses at L2 and L3. The
measured yaw at L3 is almost zero in relationship to the frame. I trust
this measurement because the frame gap is set by the 5mm spacing plugs
and the frame is ridged at this level. The measured yaw for L2 is all
over the map. To tune this out will result in the yaw at L3 going out of
spec. Perhaps it was the wrong decision, but I though the gap at L3 was
more important than at L2.
There is still side shift between the two chains, which has been
reduced but is not gone. The side shift, of around 1mm, is the most
egregious at L2, but is still visible at all levels. We can tune it out,
but doing so induces out of spec yaw problems at L3 and L2. We have used
almost the entire swing range of the top stage blades to get it as close
as it is. I believe this same problem was observed at LLO, although I
don't know it's final resolution.
Above I alluded to a lack of trust in the optical lever (laser
reflection from mirrors attached to the centers of L3 masses)
measurements of pitch and yaw. This mistrust comes from the surfaces
machined into the faces of the dummy masses. The manufacturing
tolerances for these masses are not that tight and misalignment between
the dummy mass halves are known. Although these are small, they do not
lend themselves to accurate pointing of the target mirrors. This is not
as bad on the M0 dummy mass (D060355) because the center is drilled out
and the mirror sits on a small shelf. However, on the R0 dummy masses
(D060358 and D1002204), where the centers are solid, there is a bump
left over from machining, right in the center of the mass. This bump is
large enough to miss align the mirror by a considerable amount. On the
Quad-4 R0 dummy mass, we removed as much of this bump as we could and
used 0.010" shims as standoffs in an attempt to true the mirror. With
this, we were able to put the bubble within the circle of the level but
could not center it. As a result, yaw does not reflect true to the face
of the mass. Pitch looks OK but not is certain. "
-Jeff Bartlett on 11/10/2011
Adjusted UIM mass distribution in order to take differential pitch contributing from above and below the UIM. Pitch alignment numbers and actual weight distribution to follow. The monolithic was left clamped, shielded, and covered for the night.
For clarity on the status and naming conventions of the SUS QUAD builds, today begins the testing of QUAD 04 BUILD 03. This is the latest QUAD build that is destined to become the ETMY QUAD suspension. Until then, subsequent measurements and data should be saved and committed to the SUS SVN under:
'~/SusSVN/sus/trunk/QUAD/X1/QUAD04/BUILD03/'
QUAD 04 BUILD 02 The Yaw DoF Diagonalization measurements for the R0 mass on the latest QUAD build were run yesterday and are attached below. The measurement was sine wave excitation at 1.3Hz with a 100-ct amplitude. The "F1" and "F2" OSEMs contribute to the "Yaw" DoF. The "F1" and "SD" isolation is at about ~28-30dB below the "Yaw" OSEMs. The other two OSEMs are isolated well below 30dB from "Yaw". These results indicate good isolation of the "Yaw" DoF on the R0 mass.
This post is for measurements taken on 11/09/2011 for QUAD 04 BUILD 02. I attempted to retroactively change the subject line of the original post to include this QUAD's build number, but the aLog time-stamped the edited post at the edit time. These measurements are before Jeff B. and Andres R.'s adjustments on 11/10/2011 to QUAD 04 to correct Pitch errors. The subsequent measurements beginning on 11/10/2011 will be for QUAD 04 BUILD 03.
So, following up a little further on Jeff and my diagnosis of H2 SUS FMY (the suspension formerly known as X1 SUS BSFM01), I attach a comparison between the data taken on Tuesday (111108, in Black) vs. the last data taken before it was transported over to the LVEA (110823, in Orange). A few of my concerns are reduced to "don't worry about it's" immediately: - In comparing model vs. measurement, lower frequencies on high frequency modes in T, V, and R are expected -- they match this suspension's previous measurements. - Though the highest frequency Y mode discrepancy is a measurement resolution issue. The 110823 measurement was taken at a 0.01 Hz BW across the 0.01 - 50 Hz band in DTT, where the 111108 measurement was taken with a 0.5 Hz resolution in the 0.5 to 15 Hz band. We'll fix this for future iterations. My guess is that the resonance is just fine. However, the mysteries that still remain are: - What's that bump at 0.65 Hz in L? - What's the rubbing 'causing the lowest Pitch DOF modes to be lossy / invisible? --------- Plots produced by {susSvnHome}/SusSVN/trunk/BSFM/Common/MatlabTools/plotallbsfm_tfs.m and should be easily adaptable to future measurements by just adding information to measList and defining which to plot in useMeasts. Note that it relies on .mat files that have been produced by running {susSvnHome}/SusSVN/trunk/BSFM/Common/MatlabTools/plotBSFM_dtttfs.m or {susSvnHome}/SusSVN/trunk/BSFM/Common/MatlabTools/plotBSFM_matlabtfs.m with saveData = true.
As mentioned in Hugh's aLOG entry (though not as logbook admin), one should have the ability to assign multiple tasks to an entry, as some may pertain to more than one subsystem or task (e.g. his entry about feedthroughs).
Adding a comment should by default have the same section and task as main entry.
Jeff, This is implemented in test test aLOG. It will be moved to production in the next few days.
While continuing to be logged in, after posting a comment, one should be able to edit comments that you've written in a similar fashion as the main entry.
Jeff, This is implemented in test test aLOG. It will be moved to production in the next few days.
The attached plots are the results of open-loop transfer function measurements for the M1 stage of H2 FMY. The measurements are open-loop from the "H2:SUS-FMY_M1_TEST_*DOF*_EXC" channels to the "H2:SUS-FMY_M1_DAMP_*DOF*_IN1_DQ" channels. Results agree quite nicely with the model. There might be a lower signal-to-noise ration for the really low frequencies (See "L","P",Y" below 0.5Hz), so further measurements with higher drive amplitude in this band might be desirable. Scripts, data, and plots are in the SUS SVN. Excitation and Data retrieval script:'~/SusSVN/sus/trunk/BSFM/H2/FMY/SAGM1/Scripts/collect_TF_H2FMY_M1_allDoFs_0p05to50Hz.m'Data .mat file:'~/SusSVN/sus/trunk/BSFM/H2/FMY/SAGM1/Data/111108_H2FMY_0p01to50hz_all_DoFs_5Kcts_highres.mat'Plotting script:'~/SusSVN/sus/trunk/BSFM/Common/MatlabTools/plotBSFM_matlabtfs.m'Plots (individual and combined):'~/SusSVN/sus/trunk/BSFM/H2/FMY/SAGM1/Results/'
Here's the remaining degrees of freedom, and I've fixed a big in the x ticks, such that they're on powers of 10 (instead of 0.5, 5, 50, etc). Initial investigation comments: We don't understand the blip at 0.65 Hz in Longitudinal. It doesn't appear in any other degree of freedom, and especially not in the likely suspect of Pitch. (Though there is some evidence for excess coupling in the L to P transfer function -- see page 10). The higher Vert, Trans, and Roll modes are lower in frequency than the model. Not really a point for concern just yet, we'll need to compare against (i.e. put on the same plot) the 110823 measuremnt (in progress). The lowest modes in the Pitch TF are not as "Q"-ey as we've seen. The highest Yaw mode is also not as "Q"-ey as has been seen. My guess is there's something rubbing, 'causing the reduced Q's of the P and Y modes, and also cause the weird blip in L. More analysis to come!!
Also, I've commited and updated the changes toplotBSFM_matlabtfs.mthat merge all plots produced, and fixed the axes bugs. Update to rev 1548
The north and south doors blanks were removed from the chamber and the O-ring protectors were installed. Everything is ready to start brushing tomorrow.
I just noticed that I had posted this as HAM-11 ICC (which is a correct iLIGO chamber number). It should really be HAM-12 and will be hereafter.
Comments do not show up as results of search queries for them (I've tested by searching for entry ID #, author name, and keyword search).
I agree that this is a pretty bad bug.
I'll work on that after the NSF review.
This is implemented in test test aLOG. It will be moved to production in the next few days.