TITLE: 04/15 Day Shift: 1430-2330 UTC (0730-1630 PST), all times posted in UTC
STATE of H1: Planned Engineering
OUTGOING OPERATOR: None
CURRENT ENVIRONMENT:
SEI_ENV state: MAINTENANCE
Wind: 14mph Gusts, 8mph 3min avg
Primary useism: 0.03 μm/s
Secondary useism: 0.25 μm/s
QUICK SUMMARY:
IFO is in IDLE for MAINTENANCE
Today the main task is to remove the BSC Dome and continued FARO work.
This entry made at 16:27 PDT
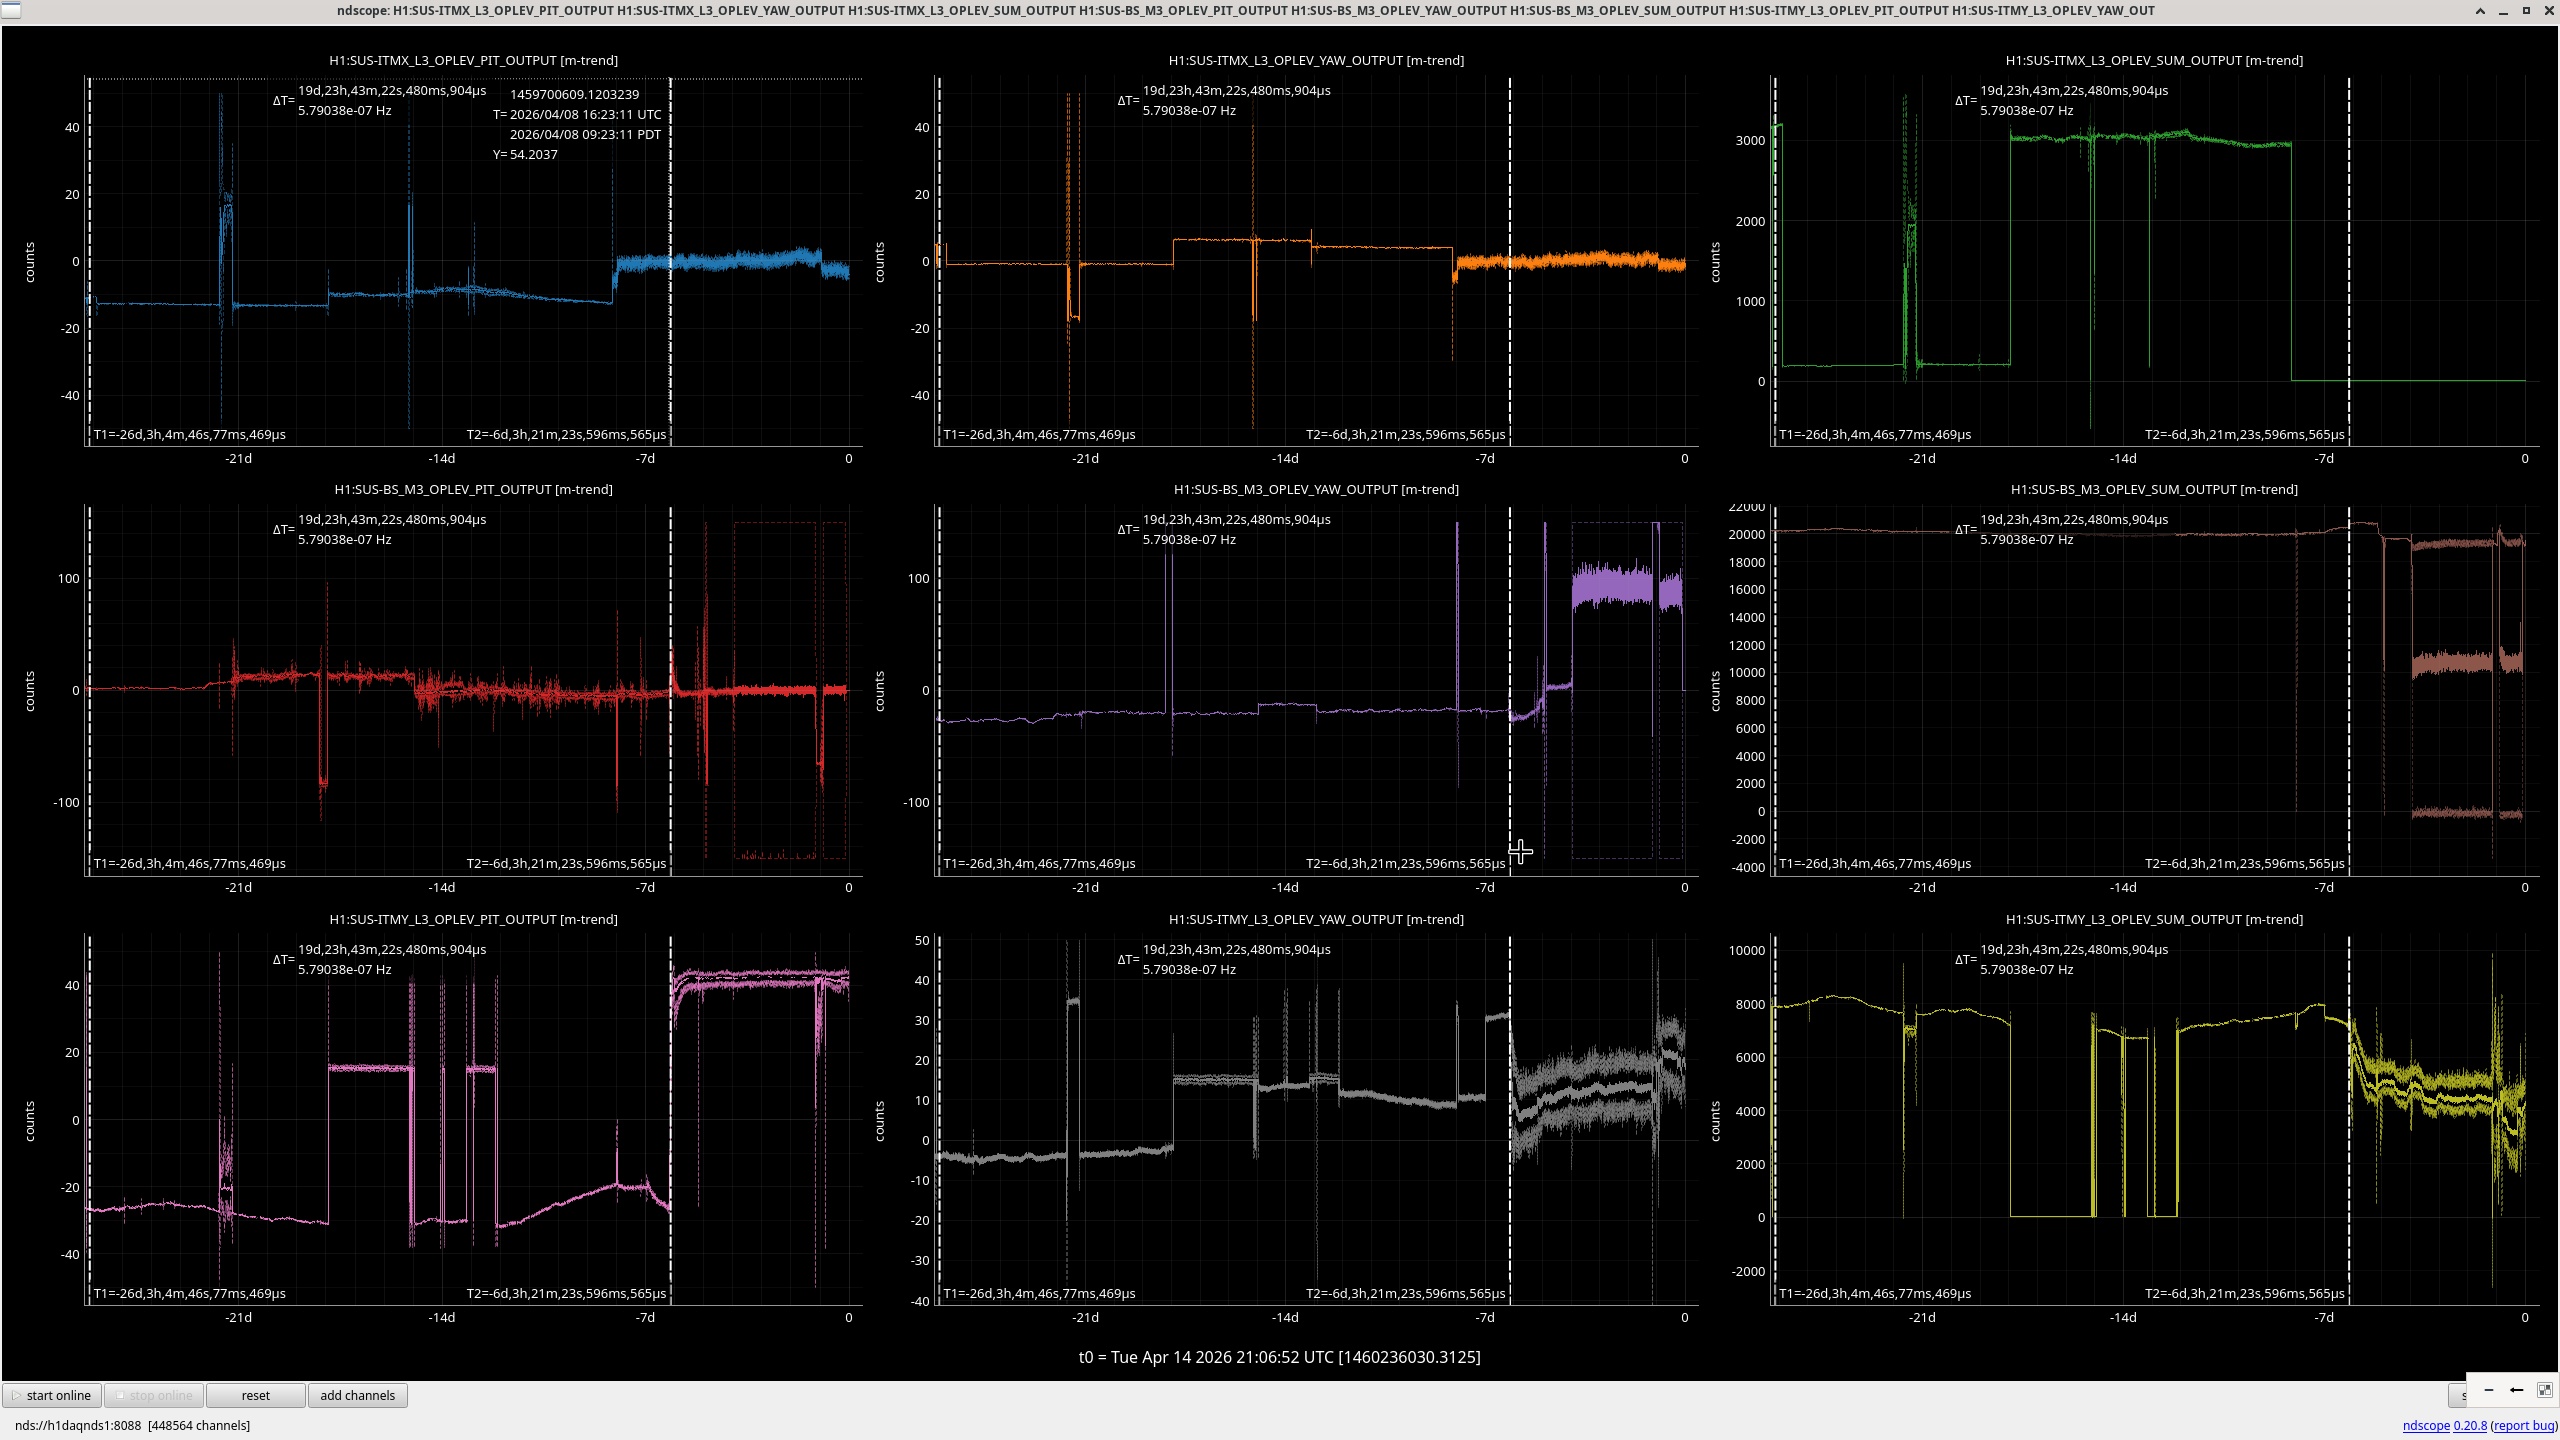
Attahed and in the table below are oplev positions for ITMY, ITMX and BS since last DRMI lock on 03/19/2026 at 11:02 PDT
| DRMI Locked Reference | Latest | |
| 11:02 PDT 03/19/26 | 15:00 PDT 04/14/26 | |
| BS P Oplev | 2.10 | 0 |
| BS Y Oplev | -25.92 | 0 |
| BS Sum Oplev | 20215.30 | 19605.8 |
| IX P Oplev | -10.70 | -3.64 |
| IX Y Oplev | 5.10 | -1.2 |
| IX Sum Oplev | 3188.52 | 4.7 |
| IY P Oplev | -26.65 | 42.5 |
| IY Y Oplev | -3.22 | 22.92 |
| IY Sum Oplev | 7904.27 | 4731.59 |
Note 1: The BS Oplev Damping loops were still on during some FARO work and were shaking the BS. We turned these off on morning of April 14.
Note 2: The right-most T-cursor marks the corner-station vent
Note that gate valve closure means that IX oplevs would read a 0 sum. This is expected.
Also, since this alog, Jeff/Ibrahim flipped the BS OPLEV Damping Servo OFF via the damping filter bank buttons, and re-turned-on the output buttons of the main banks, so those Pit/Yaw channel values bounced back up from 0 to more reasonable values.
Alog server updated to Debian 12 Bookworm.
SVN will be completed tomorrow (4-15-2026)
As per WP 13174 I updated the OS on the h1dmt login system to debian 13. No DMT/GDS services were changed, only the login box.
Madi, Camilla, TJ
TITLE: 04/14 Day Shift: 1430-2330 UTC (0730-1630 PST), all times posted in UTC
STATE of H1: Planned Engineering
INCOMING OPERATOR: None
SHIFT SUMMARY:
IFO is in IDLE for MAINTENANCE
Very productive day in which BSC2 FARO work continued (and is ongoing but almost done). Cleanroom was moved to the biergarten. Prep for dome removal finalized. CEBEX was on-site at MY.
LOG:
| Start Time | System | Name | Location | Lazer_Haz | Task | Time End |
|---|---|---|---|---|---|---|
| 14:55 | FAC | bubba, C&E | MY | N | Trenching? | 01:55 |
| 14:55 | FAC | Kim, Nellie | LVEA | N | Technical Cleaning | 15:37 |
| 15:14 | FAC | Chris + Pest-guys | LVEA, Tubes | N | Debugging | 19:14 |
| 15:15 | IAS | Ryan C | LVEA | N | Warming FARO | 15:23 |
| 15:29 | FAC | Randy, TJ | LVEA | N | Garb room location inspection | 15:43 |
| 15:36 | Camilla | Optics Lab | N | Inspecting optics | 19:23 | |
| 15:37 | FAC | Kim, Nellie | LVEA | N | Technical cleaning | 16:22 |
| 15:44 | FAC | Randy | LVEA | N | Moving stuff around | 16:21 |
| 16:04 | CC | TJ, Jordan | LVEA | N | Check out garbing situ | 16:11 |
| 16:12 | VAC | Jordan | LVEA | N' | Vacuum inventory | 16:14 |
| 16:16 | EE | Fil, Corey | LVEA, FCES' | N | West Bay cameras | 19:04 |
| 16:17 | IAS | Jason, Ryan C | LVEA | N | FARO BSC2 | 00:07 |
| 16:21 | SEI | Jim | LVEA | N | Locking ITM Baffles | 18:37 |
| 16:34 | VAc | Jordan | LVEA | N | cp1 staging parts | 20:49 |
| 16:43 | ICS | Jeff | Optics Lab | N | Searching for part | 17:30 |
| 16:44 | FAC | Randy | LVEA | N | Craning clean room | 17:40 |
| 16:44 | FAC | TJ | LVEA | N | Craning clean room | 17:40 |
| 16:50 | VAC | Gerardo | LVEA | N | Cleanroom move | 17:29 |
| 17:02 | VAC | Travis | LVEA | N | Checking on Gerardo and Jordan | 20:01 |
| 17:21 | Marc | Marc | EX | N | Swapping power supply | 19:02 |
| 17:42 | FAC | Randy | EX, EY | N | Looking for a spreader bar | 19:47 |
| 18:03 | FAC | Kim | LVEA | N | Technical Cleaning | 19:02 |
| 19:13 | epo | jennie.disha.guest | lvea | n | lvea tour | 19:47 |
| 19:15 | pem | robert | EX | - | grounding studies | 00:03 |
| 19:36 | fac | randy.tyler | EY | - | grabbing bsc spreader bar | 20:37 |
| 20:34 | ee | fil | MER | - | pull sus cables | 23:34 |
| 20:50 | sei | jim | bsc2 | - | stickman duties for FARO | 23:36 |
| 20:56 | OPS | TJ | LVEA | N | Battery delivery | 21:01 |
WP 13172
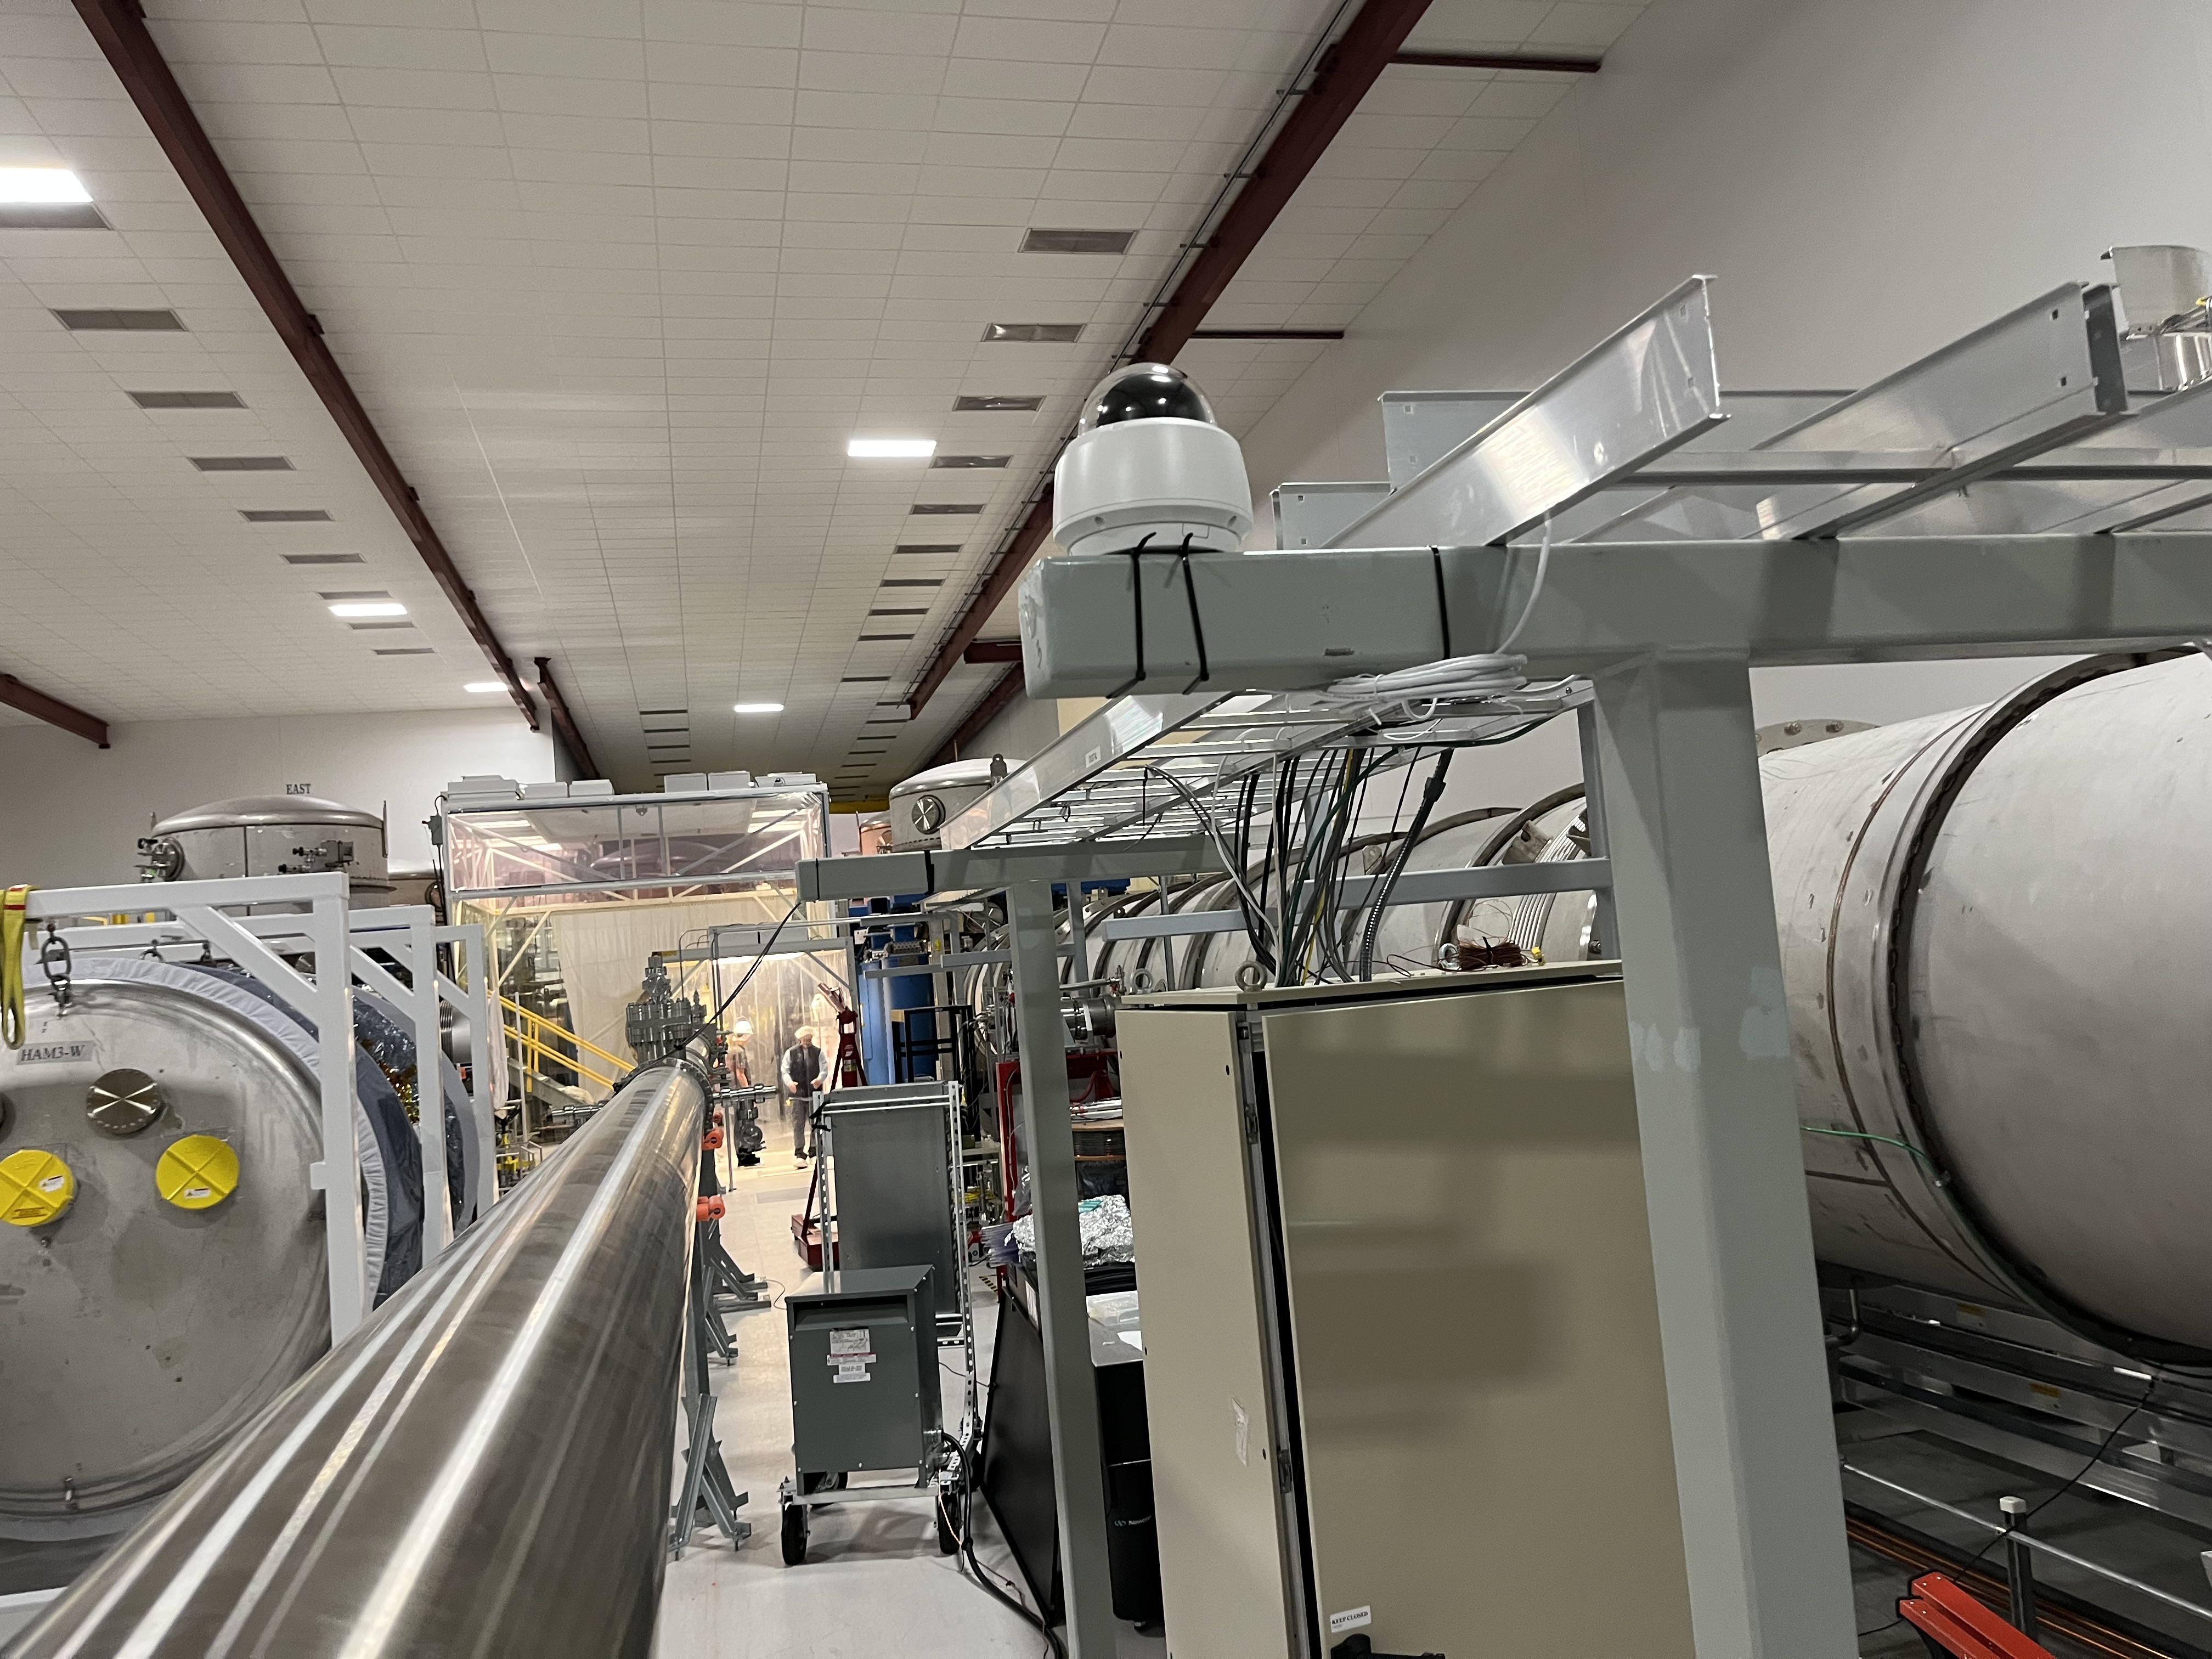
A PTZ camera was installed on the cable tray support near the LY Vacuum rack. Camera is connected to the FCES juniper switch (Access, port 12) via fiber to network converters. This will help document BSC2 dome and cartridge removal.
F. Clara, C. Gray, R. McCarthy
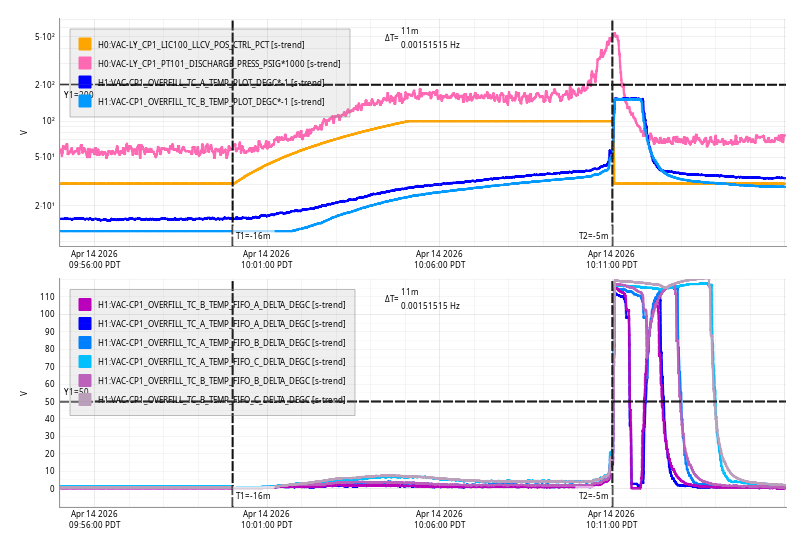
Tue Apr 14 10:11:00 2026 INFO: Fill completed in 10min 57secs
Closes FAMIS39759, last checked in alog89772
Laser Status:
NPRO output power is 1.835W
AMP1 output power is 70.55W
AMP2 output power is 138.1W
NPRO watchdog is GREEN
AMP1 watchdog is GREEN
AMP2 watchdog is GREEN
PDWD watchdog is GREEN
PMC:
It has been locked 3 days, 22 hr 40 minutes
Reflected power = 27.2W
Transmitted power = 104.0W
PowerSum = 131.2W
FSS:
It has been locked for 3 days 22 hr and 40 min
TPD[V] = 0.4879V
ISS:
The diffracted power is around 4.0%
Last saturation event was 0 days 0 hours and 0 minutes ago
Possible Issues:
PMC reflected power is high
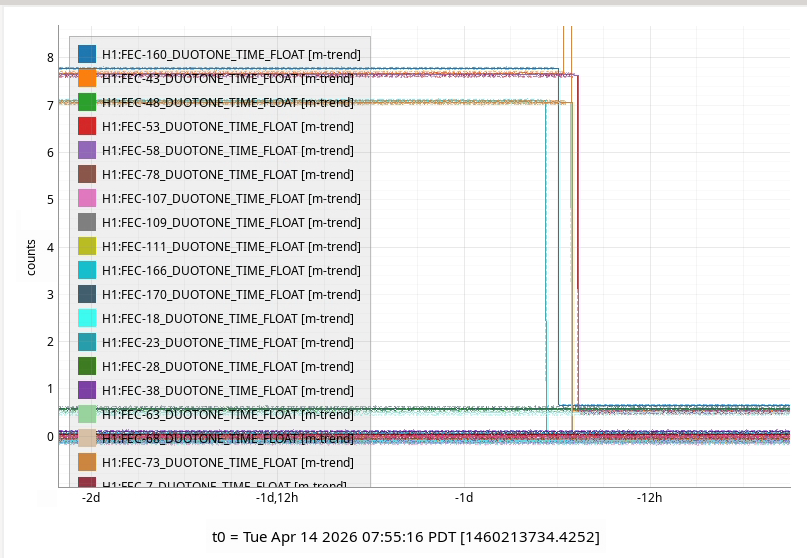
The completion of the Timing Card Firmware upgrade has brought all the IOP Duotone timings to below 1uS (were in the 7uS region).
Duotone times are now either around 0.0uS or around +0.5uS due to a board manufacture variation.
CDS Overview Changes.
Beckhoff Slow Controls DEV1:
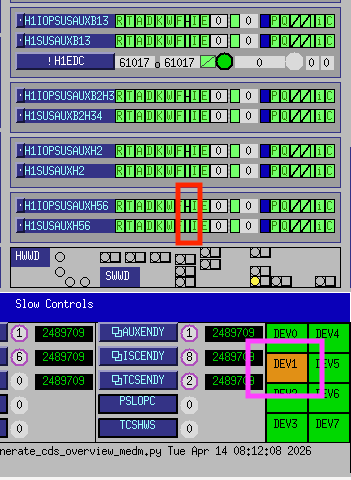
Following the reactivation of the LVEA chamber illuminators yesterday the DEV1 terminal count went from its degraded state of 21 to the full complement of 23. This is because during O4 the illumintor controls were found to be noisy and were powered down. To show this degraded state the CDS Overview used a slightly darker green for a terminal count of 21.
So that we don't forget to address this noise issue and/or power down the illuminator controls before IR1 starts, I'm displaying DEV1 in a dark yellow colour when all the terminals are present as a reminder.
[MAGENTA block in attachment]
Model RCG version and IOP Timing Card Version:
Now all models are running with RCG5.5.2 and all timing cards have the latest Firmware version I've green'ed up these tags on the overview.
The RCG tag will turn BLUE if not 5.5.2. The IOP tag will turn BLUE if the Duotone is out-of-bounds.
[RED block in attachment]
Timing card version is now:
LPTC revision_byte=0x2 subversion_rev=0x635
TITLE: 04/14 Day Shift: 1430-2330 UTC (0730-1630 PST), all times posted in UTC
STATE of H1: Planned Engineering
OUTGOING OPERATOR: None
CURRENT ENVIRONMENT:
SEI_ENV state: MAINTENANCE
Wind: 18mph Gusts, 13mph 3min avg
Primary useism: 0.02 μm/s
Secondary useism: 0.10 μm/s
QUICK SUMMARY:
IFO is in IDLE for MAINTENANCE
FARO BSC2 work, prep for BSC2 dome removal, CDS work and cabling are expected activities today.
An earthquake tripped the SWWDs for ETMY, ITMX and ETMY at 18:30 PDT yesterday evening. I untripped these 07:40 this morning.
Most likley this M5.7 Nevada EQ (link).
M. Todd, J. Wright, S. Dwyer
Here is my attempt to summarize as many of the OMC scan measurements of the input beam overlap with the OMC mode, as well as PRC and SRC gouy phases -- all at different thermal states.
| Measurement | Time | Test Masses | CO2 [W] | Ring Heater (per segment) [W] | SR3 [W] | OM2 [W] | FOM | aLOG |
| OMC Scan - Single Bounce off of ITMY | 1443895154 | Cold | 0 | 0 | 0 | 0 | Mismatch = 8.3% | 87461 |
| OMC Scan - Single Bounce off of ITMX | 1443894875 | Cold | 0 | 0.45 | 0 | 0 | Mismatch = 10.4% | 87461 |
| OMC Scan - Single Bounce off of ITMY | 1443889943 | Cold | 1.7 | 0 | 0 | 0 | Mismatch = 10.3% | 87461 |
| OMC Scan - Single Bounce off of ITMX | 1443894875 | Cold | 1.7 | 0.45 | 0 | 0 | Mismatch = 13.5% | 87461 |
| OMC Scan - Single Bounce off of ITMY | 1431450536 | Cold | 0 | 0 | 5 | 0 | Mismatch = 7.6% | 85661 |
| OMC Scan - Single Bounce off of ITMY | 1403543046 | Cold | 0 | 0 | 0 | 4.6 | Mismatch = 6.6% | 78701 |
| OMC Scan - Single Bounce off of ITMX | 1431449762 | Cold | 0 | 0.45 | 5 | 0 | Mismatch = 9.6% | 85661 |
| OMC Scan - Single Bounce off of ITMY | 1431474471 | Cold | 0 | 0 | 5 | 4.6 | Mismatch = 3.1% | 85698 |
| OMC Scan - Single Bounce off of ITMX | 1431474101 | Cold | 0 | 0.45 | 5 | 4.6 | Mismatch = 5.1% | 85698 |
| OMC Scan - Single Bounce off of ITMY | 1444515634 | Hot-ish | 1.7 | 0 | 0 | 0 | Mismatch = 7.1% | 87461 |
| OMC Scan - Single Bounce off of ITMX | 1444515312 | Hot-ish | 1.7 | 0.45 | 0 | 0 | Mismatch = 8.9% | 87461 |
| OMC Scan - SQZ Beam | 1446952255 | - | - | - | - | 4.6 | Mismatch = 6.8% | 88060 |
| OMC Scan - SQZ Beam | 1447088389 | - | - | - | - | 0 | Mismatch = 2.8% | 88088 |
| Gouy Phase - PRC | 1255227492 | Cold | ITMY = 0.9, ITMX = 0.8 | ITMY = 1.4, ITMX = 0.5 | 0 | 0 | OneWay Gouy Phase = 23.2 [deg] | 52504 |
| Gouy Phase - PRC | 1354415805 | Cold | 0 | 0 | 0 | 0 | OneWay Gouy Phase = 20.7 [deg] | 66215 |
| Gouy Phase - SRC | 1354410195 | Cold | 0 | 0 | 0 | 0 | OneWay Gouy Phase = 19.9 [deg] | 66211 |
| Gouy Phase - SRC | 1255907203 | Cold | ITMY = 0.9, ITMX = 0.8 | ITMY = 1.4, ITMX = 0.5 | 0 | 0 | OneWay Gouy Phase = 25.5 [deg] | 52658 |
| Gouy Phase - SRC | 1255829128 | Cold | ITMY = 0.9, ITMX = 0.8 | ITMY = 1.4, ITMX = 0.5 | 4 | 0 | OneWay Gouy Phase = 29 [deg] | 52641 |
The measurements made with SR3 hot in May 2025 were done with SR3 heater requested power set to 2W, the readback of reported power was 1.9W. The lines in the table that say 5W for SR3 power should say 2W.
Jennie W, Sheila, Elenna
In order to get data for mode-matching and for Elenna to get data to calibrate sideband heights we ran some mode scans after the SR3 heater was turned on last night.
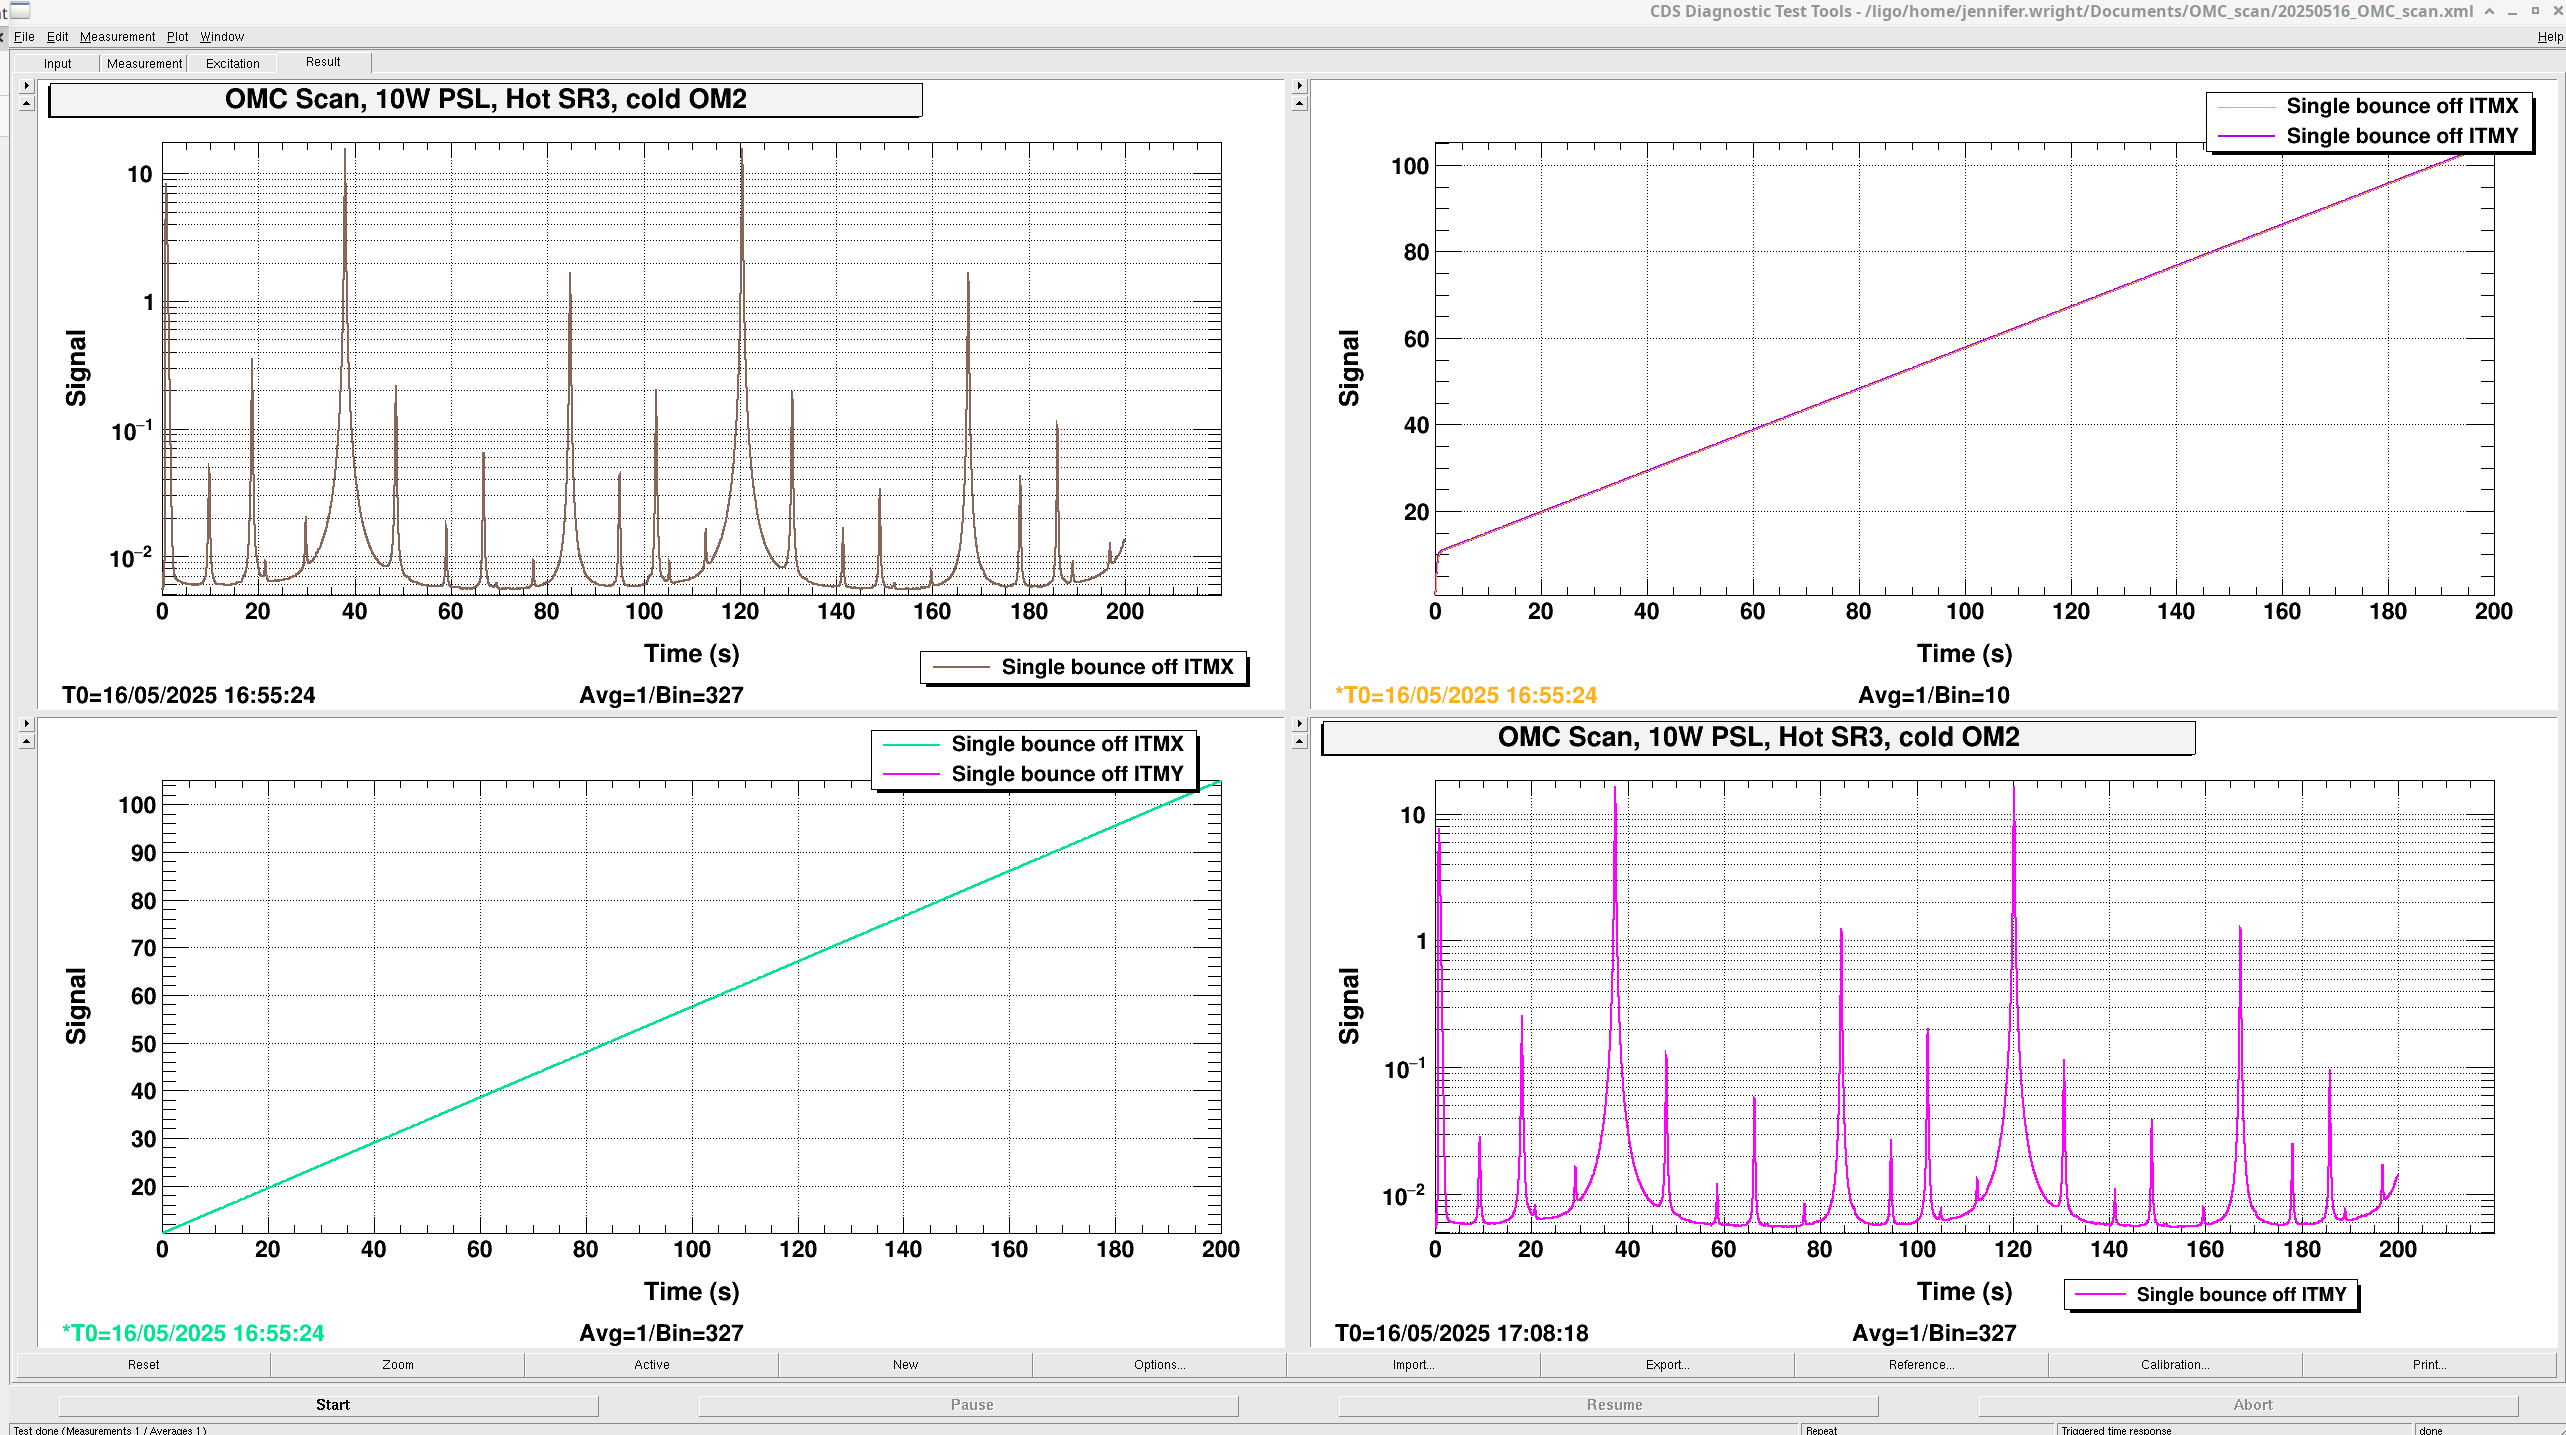
16:55:24 UTC Carried out single bounce OMC scan at 10W PSL input with sensor correction on HAM6 on, high voltage on for PZT driver in HAM6, sidebands off , SRM mis-aligned, ITMY mis-aligned, DC 3 and 4 on, OMC ASC on.
Excitation freq changed to 0.005 Hz as the top peak of the TM00 mode looked squint so could have been saturating. Lowering this frequency prevented this.
Ref 15-17 corresponds to dcpd data, pzt exc signal, pzt2 dc monitor.
Then mis-aligned ITMX and aligned ITMY (Sheila had to re-align SR2 to centre on ASC-AS_C).
Measurement starts at 17:08:18 UTC.
Ref 18-20 corresponds to dcpd data, pzt exc signal, pzt2 dc monitor.
Traces saved in 20250516_OMC_scan.xml. The top left plot is the first scan bouncing beam off ITMX, the second scan is the bottom right bouncing off ITMY.
The top right is the two plots of the PZT2 DC voltage monitor. That is, the current voltage applied to the PZT. The bottom left is the plot of the voltage ramp applied to the PZT2 on the OMC for this measurement.
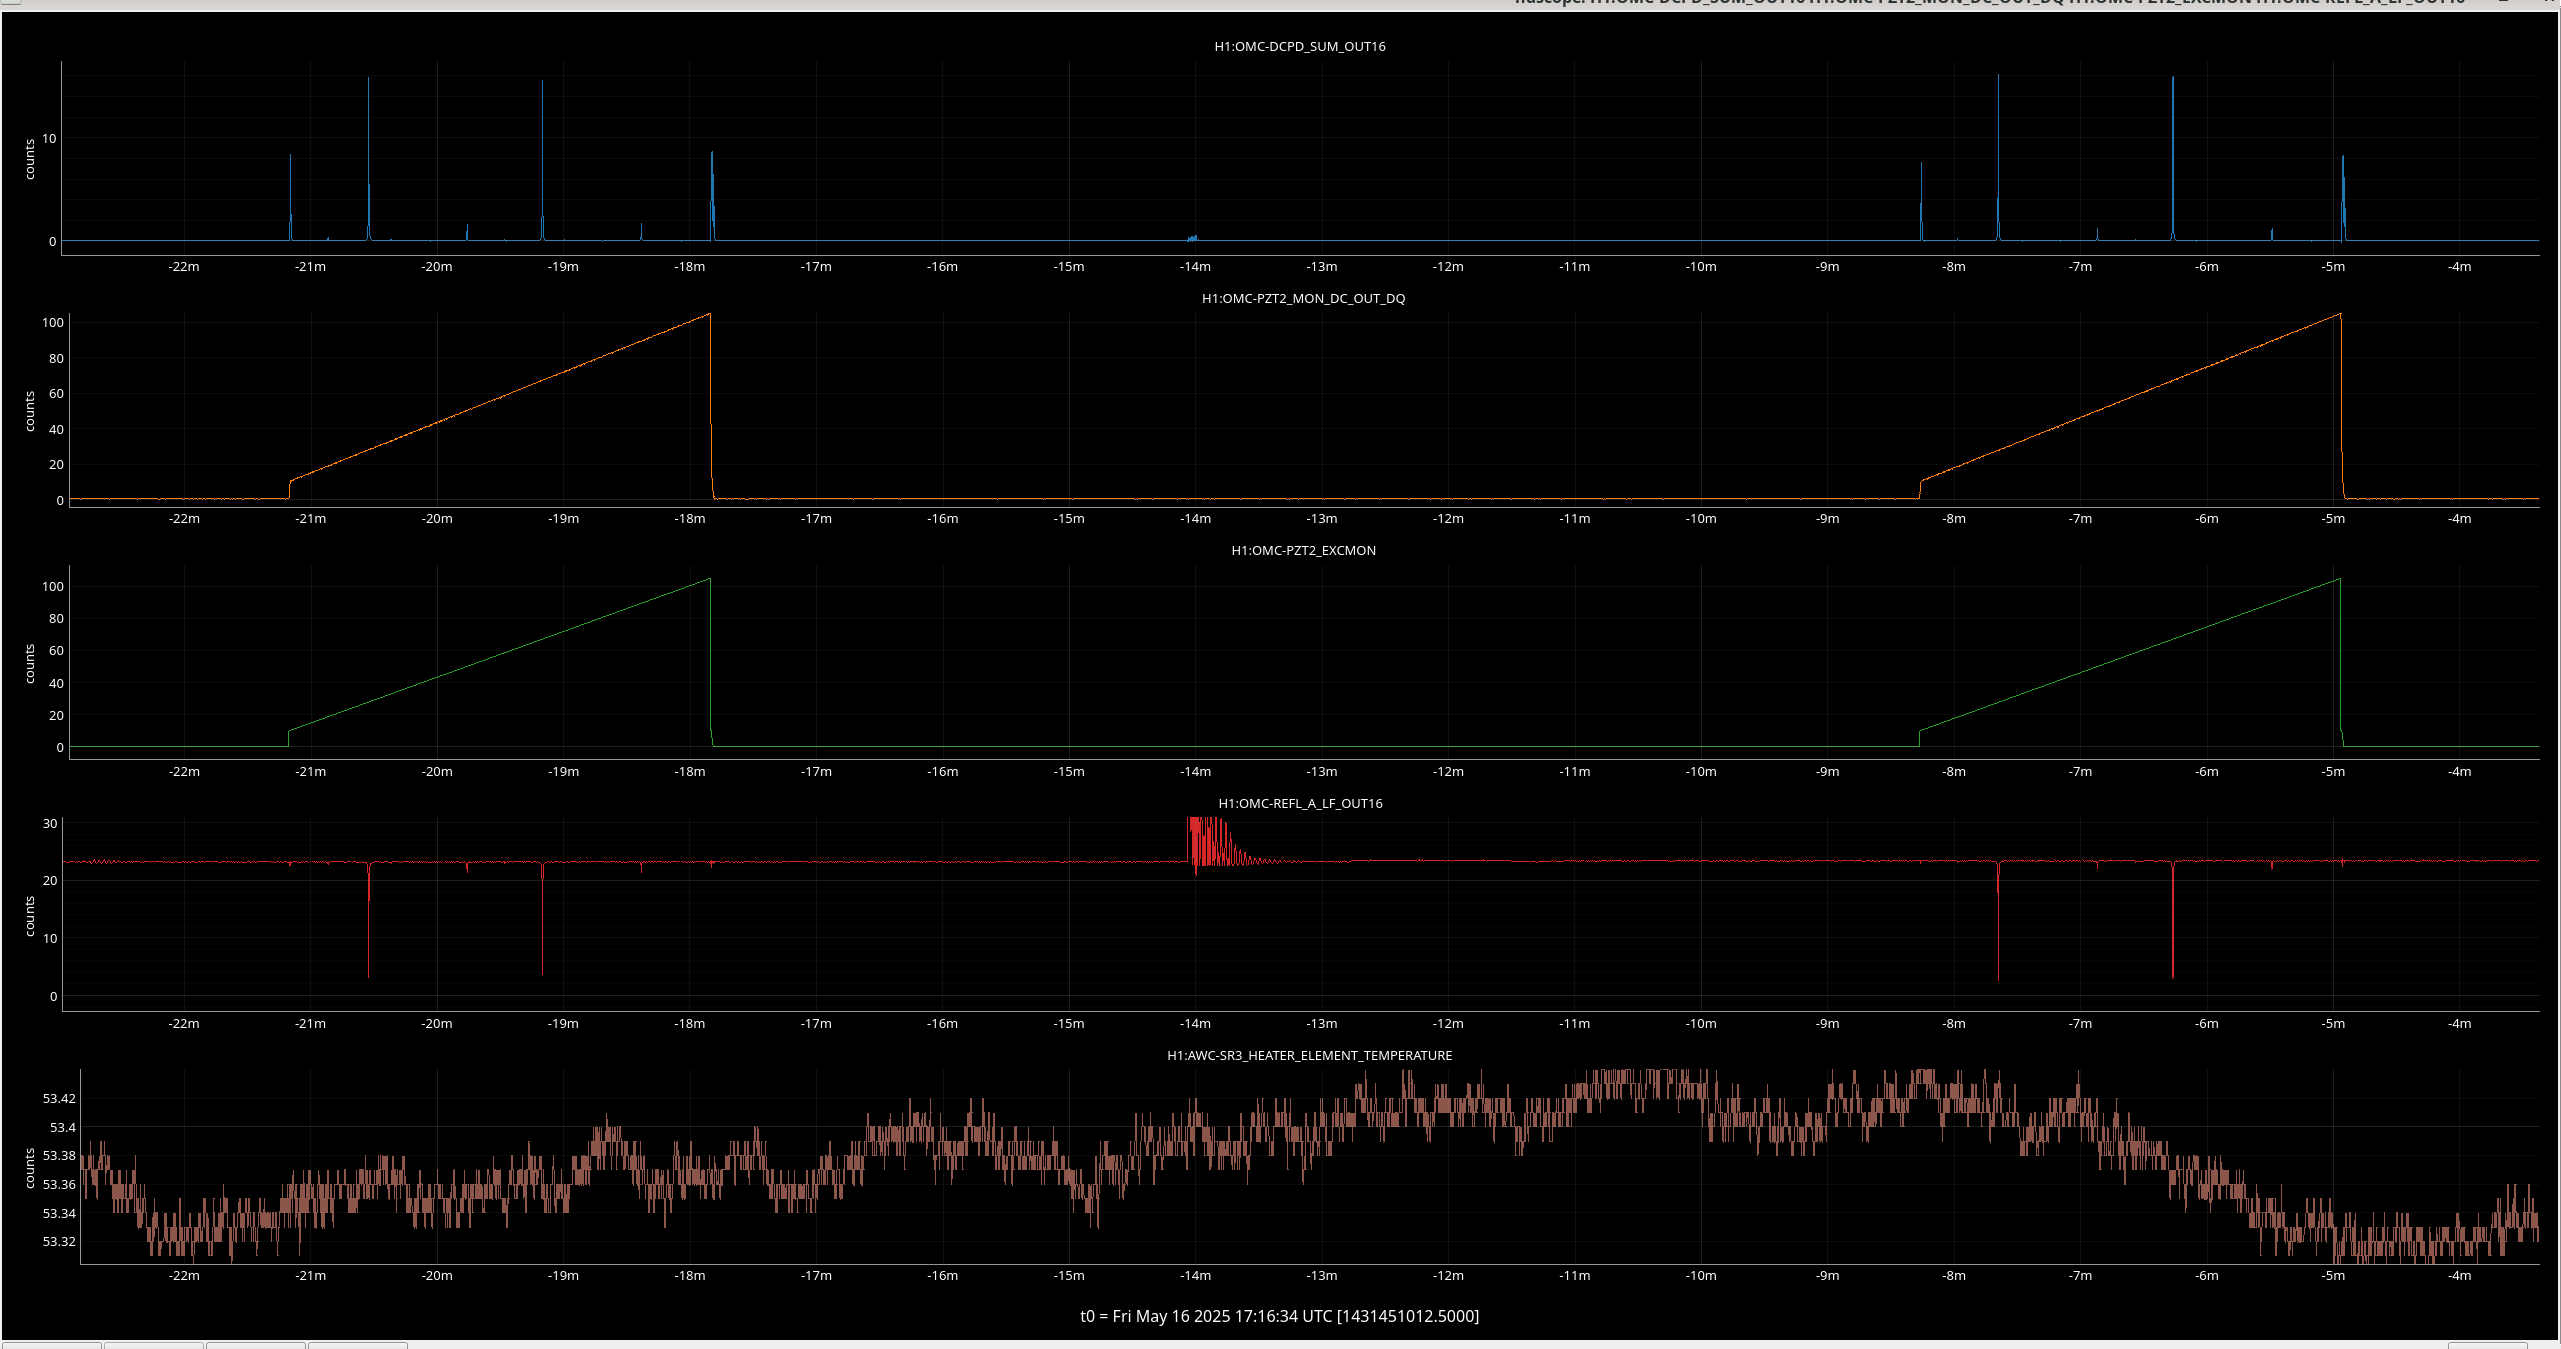
The ndscope attached shows the power in mA transmitted through the OMC on the top, then the PZT used for the scan DC voltage underneath, then the input PZT voltage underneath that, then the reflected power from the OMC in mW, then at the bottom the SR3 heater element temperature in degrees.
Elenna did two more scans in single bounce with sidebands back on and different modulations depths in each.
See Elenna's comment on her previous measurement where this saturation happened.
Turn off the sidebands - instructions in this alog.
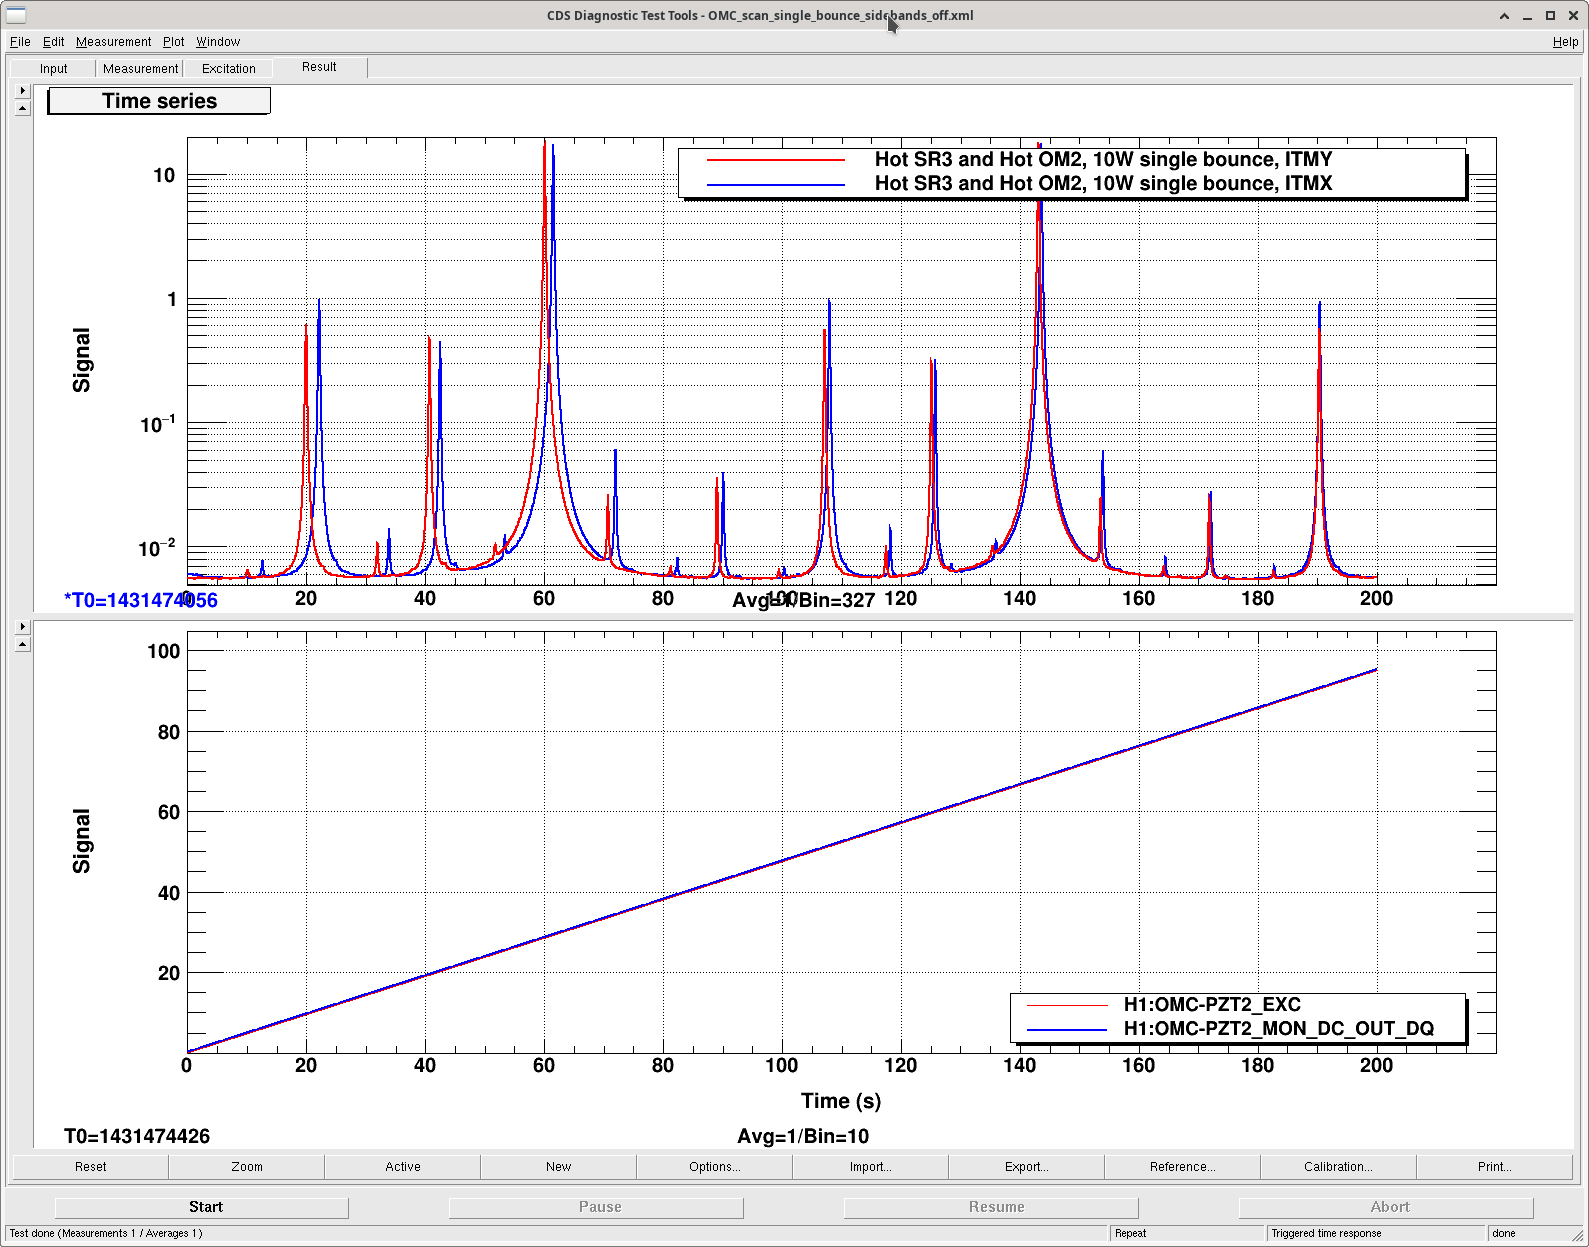
Sheila and I ran one more OMC scan with sidebands off after OM2 heated up. Attached is the screenshot with scans off both ITMX and ITMY, data is saved in [userapp]/omc/h1/templates/OMC_scan_single_bounce_sidebands_off.xml
I also ran two OMC scans, single bounce off ITMY, 10 W input, with the sidebands ON. One measurement I ran with the sidebands set to 23 dBm and 27 dBm (9 and 45 MHz) and another set to 20 dBm and 21 dBm (9 and 45 MHz). I will use these measurements to calibrate the modulation depth. Data saved in /opt/rtcds/userapps/release/omc/h1/templates/OMC_scan_single_bounce_RF_cal.xml
SR3 heater was on for this measurement but it should have little effect on my results.
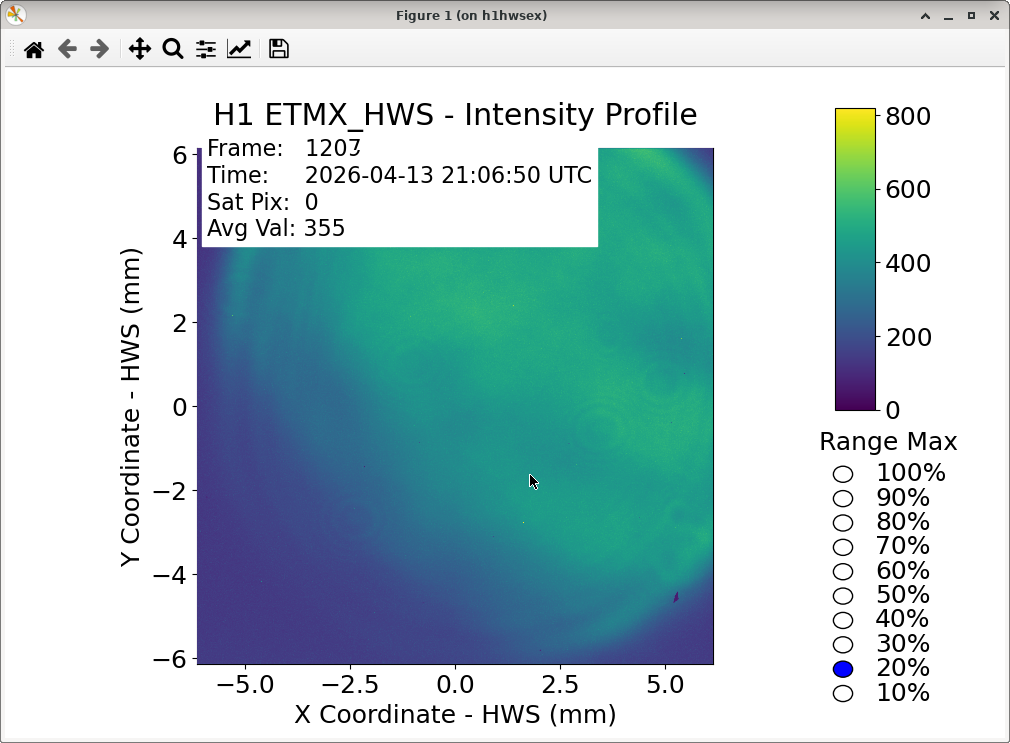
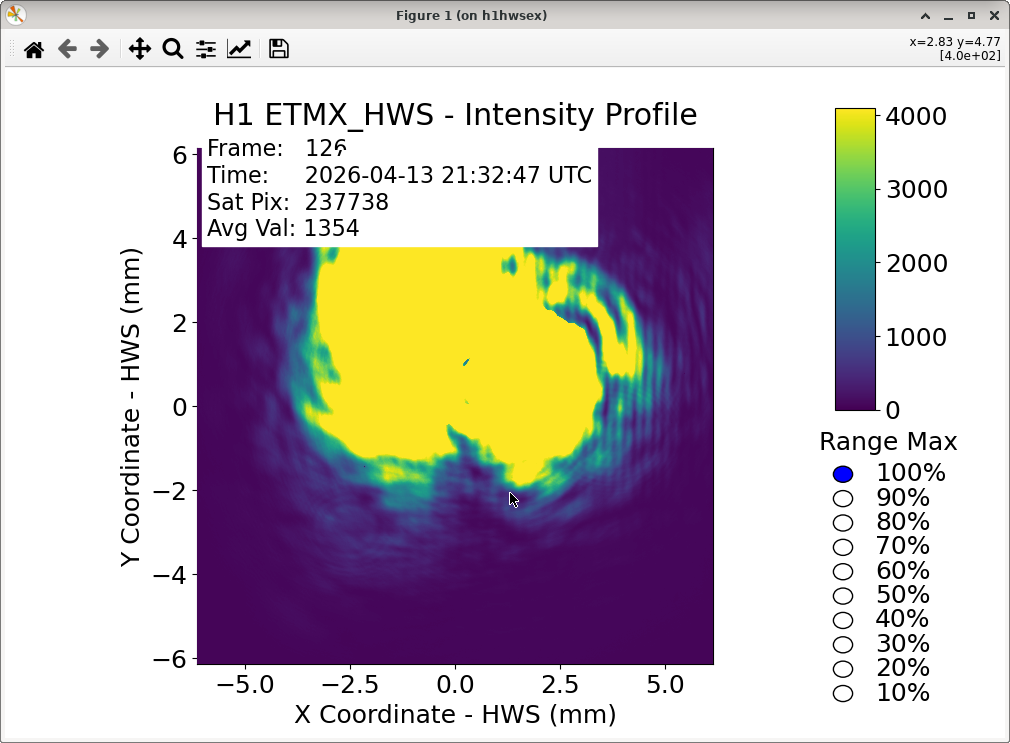
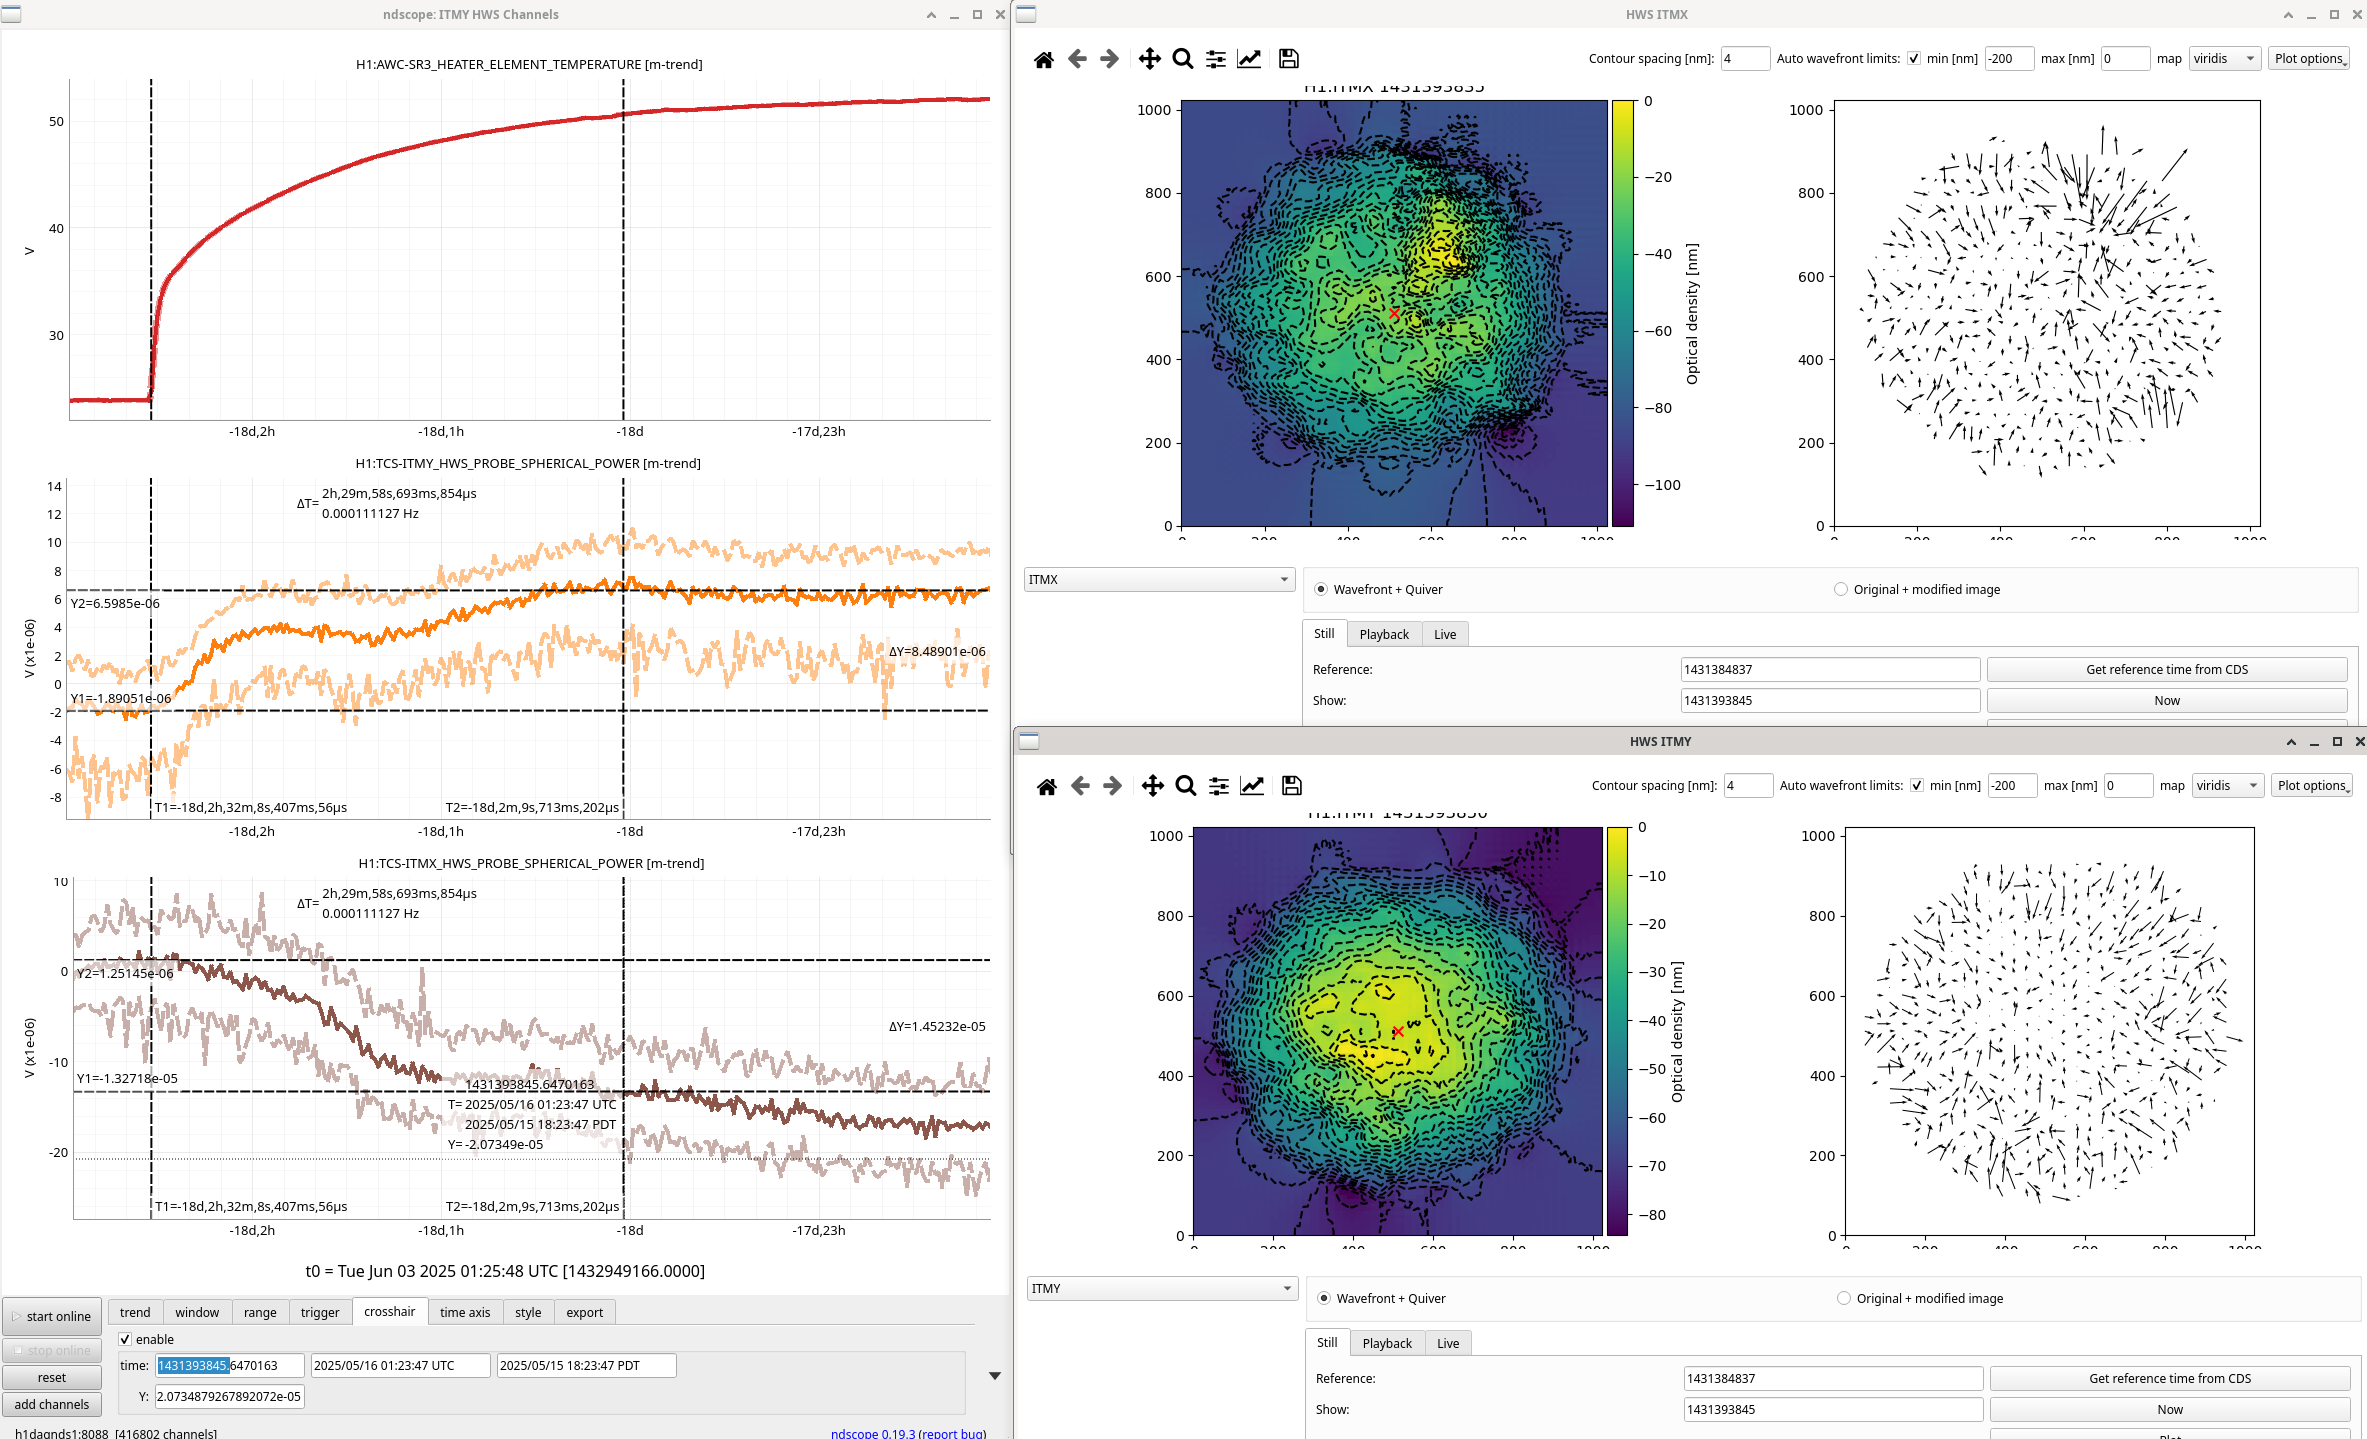
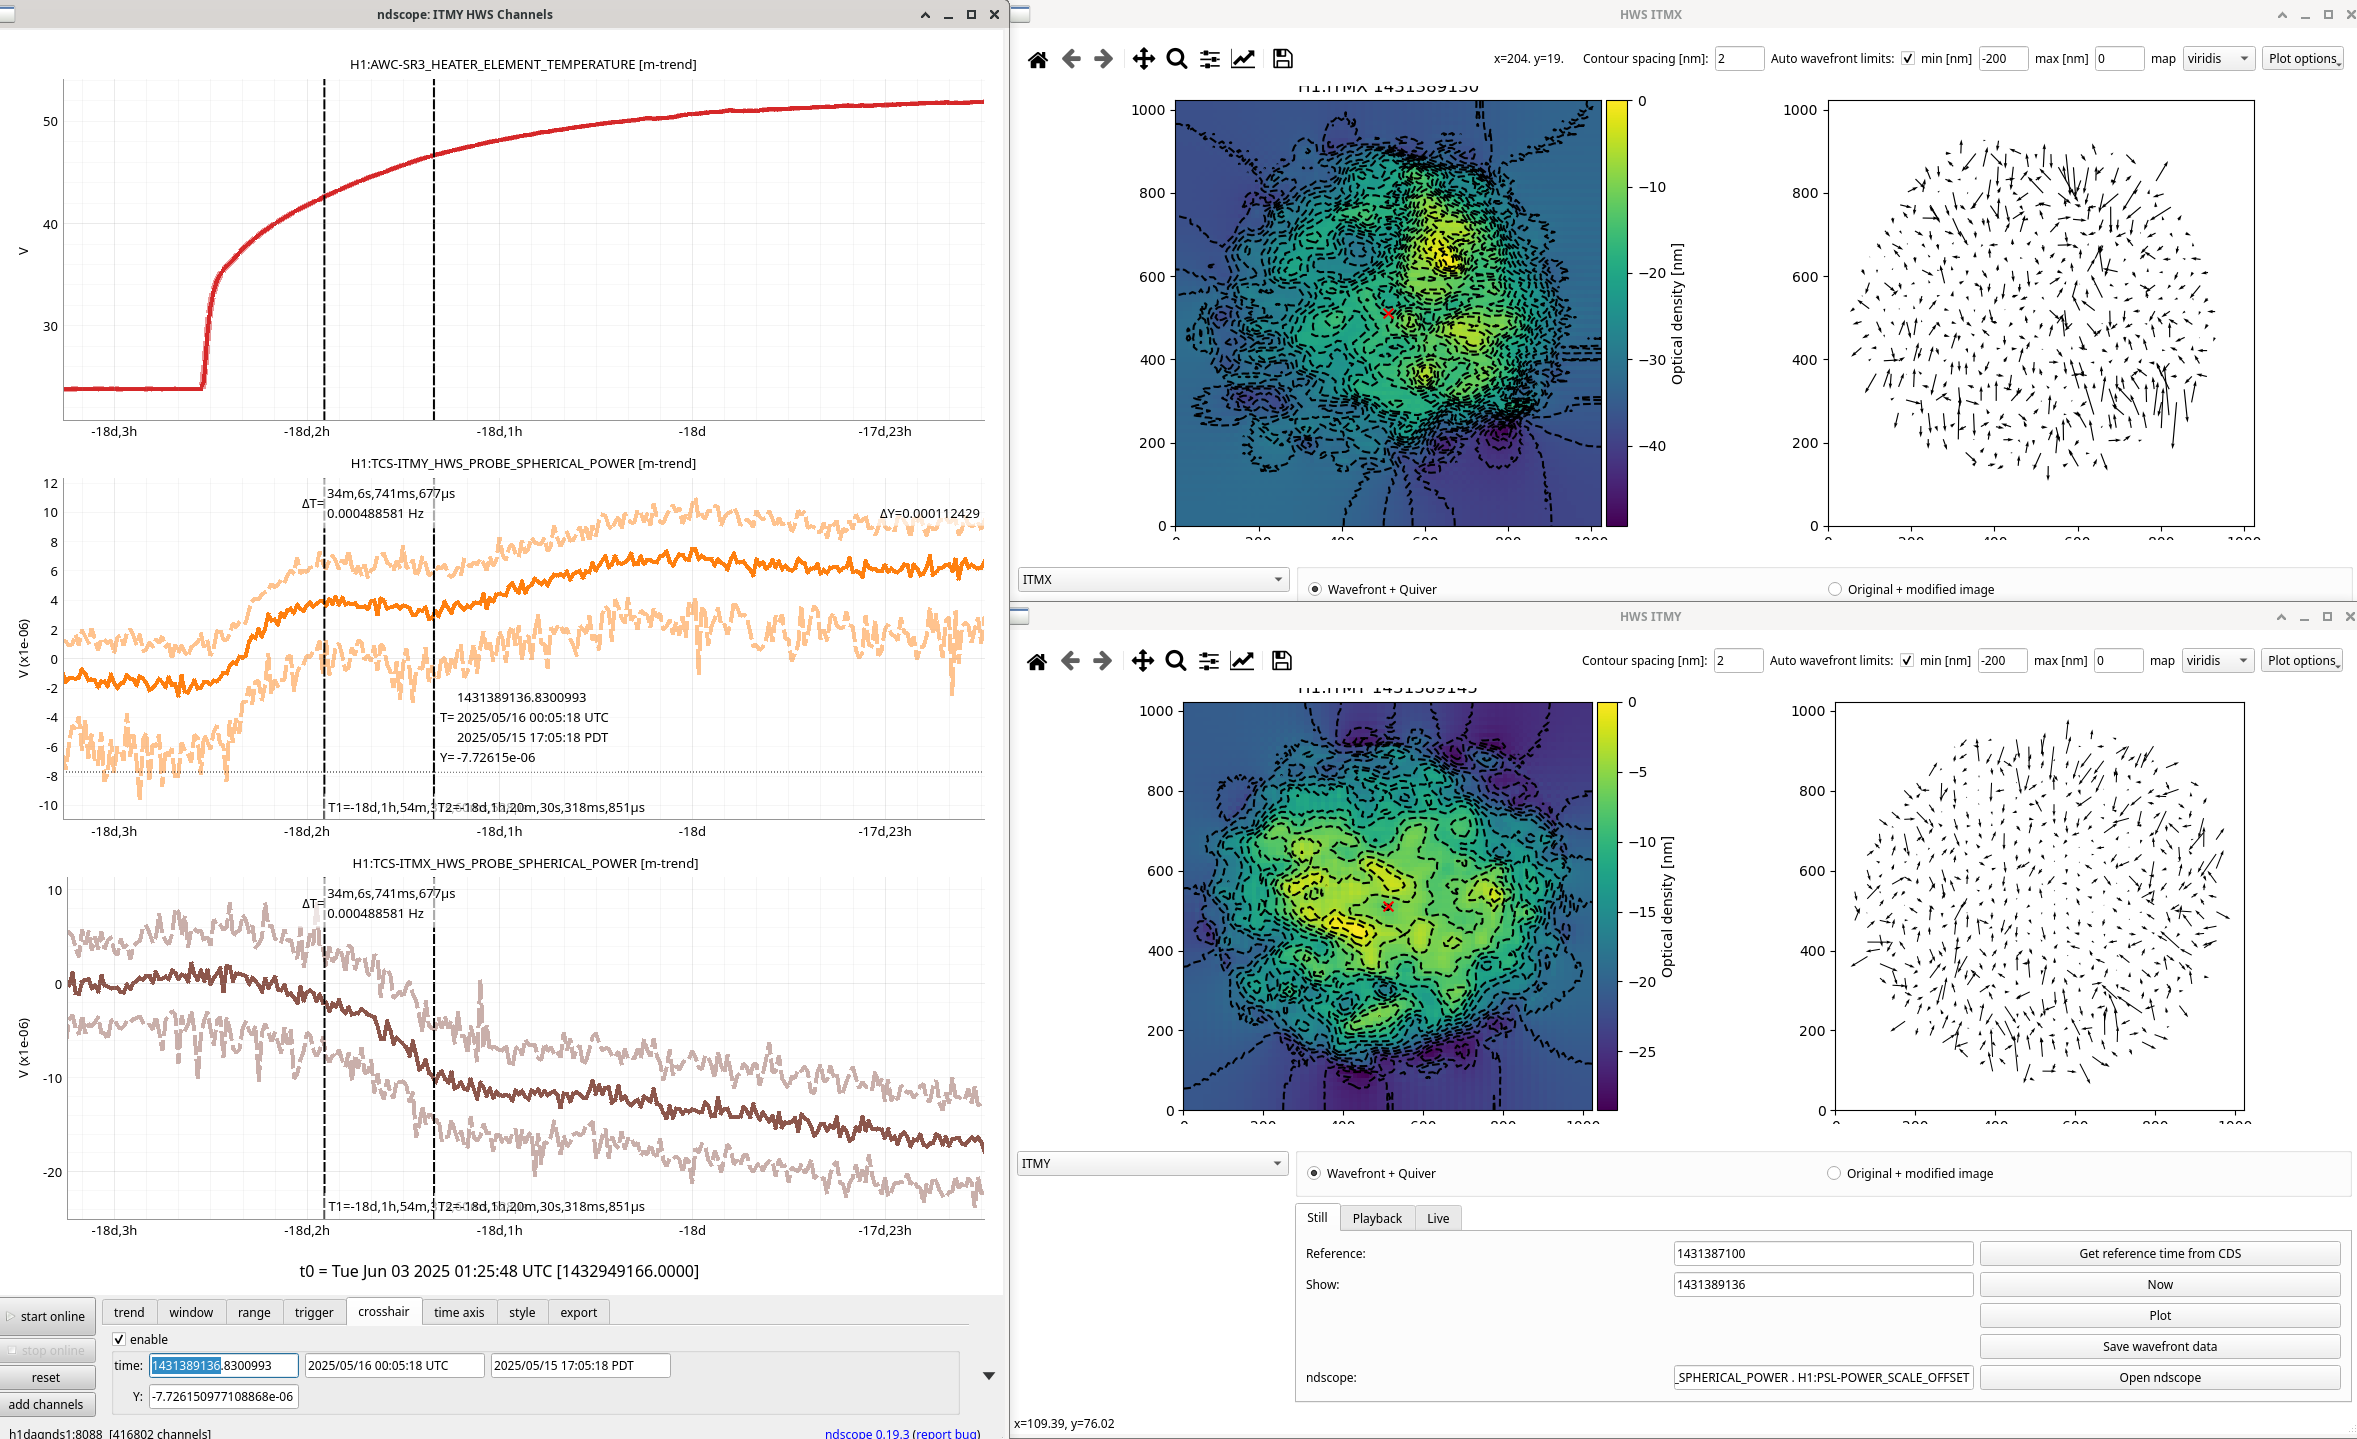
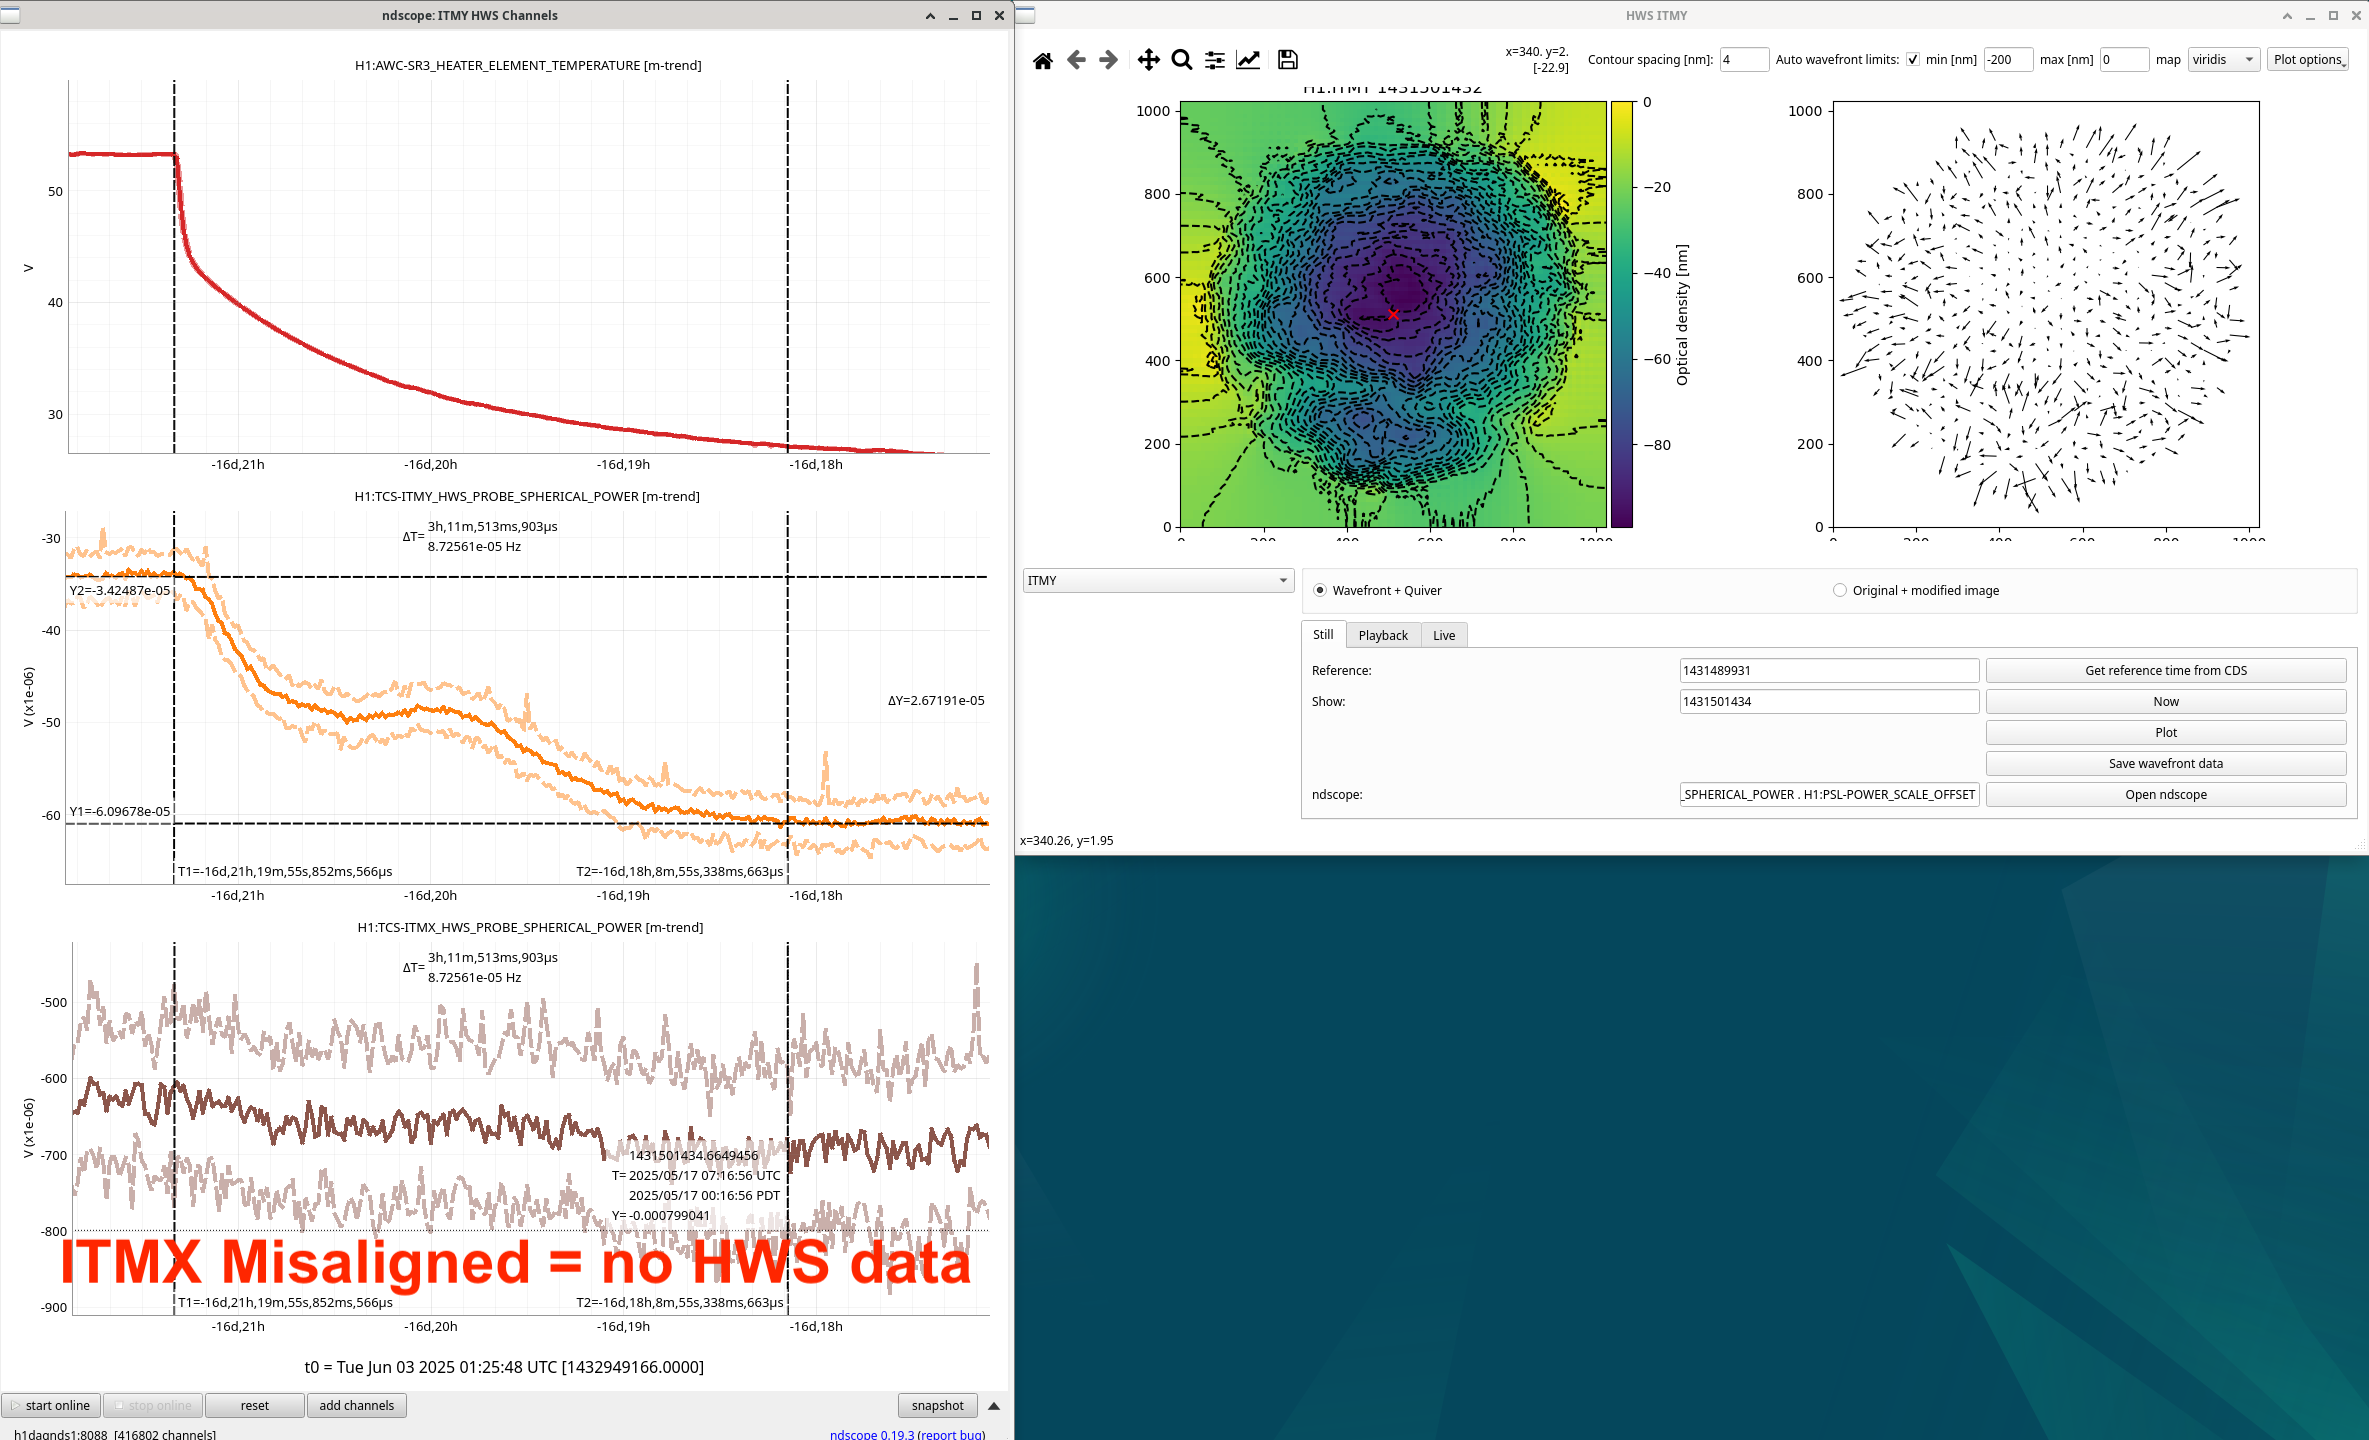
Looked closer at these HWS signals during SR3 heater heat up and cool down. In all these plots, the two t-cursors are used as the reference and shown HWS live image.
Some strange things:
Finally got round to fitting the two single bounce mode scans done with SR3 hot and OM2 cold. The first we had ITMX aligned, the second we switched to ITMY aligned.
These can currently be processed using OMCscan.py in the /dev branch for the labutils/omcscan repository at /ligo/gitcommon/labutils/omc_scan, you need to have activated the labutils conda environment to do so.
The call statements for the data processing are:
python OMCscan.py 1431449762 130 "1st 1431449762 - SR3 hot, 10W PSL, ITMY mis-aligned" "single bounce" -s -v -o 2 -m
python OMCscan.py 1431450536 140 "2nd 1431450536 - SR3 hot, 10W PSL, ITMX mis-aligned" "single bounce" -s --verbose -m -o 2
For each measurement the tag -s specifices that the sidebands were not on and so in order to calibrate the PZT the code uses the two TM00 modes and then you have to tell it in what height order the 10 and 20 modes appear relative to the highest peak which will be one of the 00 modes.
def identify_C02(self):
"""If in single bounce configuration, and with sidebands off,
identify 10 and 20 modes in order to improve fit.
Assumes that
OMCscan.identify_peaks()
and
OMCscan.identify_carrier_00_peaks()
have already been run.
Output:
-------
self.peak_dict: dictionary
first set of keys are carrier, 45 upper, 45 lower
second set of keys are TEM mode, e.g. "00", "01", "20", etc.
third set of keys is the fsr number
"""
# Create temporary dictionary to combine into self.peak_dict
peak_dict = {}
peak_dict["carrier"] = {"10": {}, "20": {}}
#print(peak_dict)
nn = [2, 1]
mm = 0
#freq_diff = np.empty(np.size(self.peak_frequencies)) not sure why this line here.
#set frequency to be that of third largest peak.
first_order = np.argsort(self.peak_heights)[-4]#-4 for second meas.
second_order = np.argsort(self.peak_heights)[-3]#change index to match where 20 is in terfirst meas if measuring from start of scan.ms of peak height.
#print(third_larg)
for ii, peak_freq in enumerate(self.peak_frequencies):
if peak_freq == self.peak_frequencies[second_order]:
#print("found C02")
#print(f"List fields in IFO {self.fields_MHz}")
#print(type(self.fields_MHz))
#print(f"OMC HOM spacing {self.omc_hom} MHz")
#print(type(self.omc_hom))
field = f"carrier"
#print(f"mode {field}{nn[0]}{mm}")
peak_dict[field]["20"][-1] = {
"height": self.peak_heights[ii],
"voltage": self.peak_pzt_voltages[ii],
"frequency": self.peak_frequencies[ii],
"true_frequency": np.mod((self.fields_MHz - (nn[0] + mm) * self.omc_hom), self.omc_fsr),
"label": r"$c_{20}$",
}
self.peak_ided[ii] = 1
elif peak_freq == self.peak_frequencies[first_order]:
field = f"carrier"
peak_dict[field]["10"][-1] = {
"height": self.peak_heights[ii],
"voltage": self.peak_pzt_voltages[ii],
"frequency": self.peak_frequencies[ii],
"true_frequency": np.mod((self.fields_MHz - (nn[1] + mm) * self.omc_hom), self.omc_fsr),
"label": r"$c_{10}$",
}
self.peak_ided[ii] = 1
else:
continue
# Merge dictionaries
#if not "20" in peak_dict["carrier"].keys():
self.peak_dict["carrier"] = {**self.peak_dict["carrier"], **peak_dict["carrier"]}
#print(self.peak_dict)
#print(self.peak_ided)
return
For both measurements I only took slightly over 1 FSR of the data, this is because in order to fit a polynomial to the known peaks (allowing us to calculate the PZT non-linearity), the code assumes the 1st order is the 3rd highest and 2nd order is the 4th highest. In the code above you need to change the indexes in the below lines to match the height order of the peaks (ie. and index of -4 is fourth highest peak).
first_order = np.argsort(self.peak_heights)[-4]
second_order = np.argsort(self.peak_heights)[-3]
When the mode-matching is bad this may not be true, also if there are multiple FSRs in the scan this also may not be true.
First measurement 1st order mode is fifth highest, 2nd order mode is third highest. The scan is here. I took 130 s of data. The PZT fit is here.
Second measurement the 1st order mode was the 4th highest, 2nd order mode was the third highest. The scan is here. I took 140s of the scan data. The PZT fit is here.
First measurement has
1.69/(1.69+15.86) = 9.63 % mode mis-match.
Second measurement has
1.25*100/(1.25 + 16.46) = 7.06 % mode mis-match
I also analysed the single bounce measurements Elenna and Sheila made after OM2 was heated up. So these have both SR3 and OM2 hot.
For both these measurements C02 was the third highest mode and C01 was the fourth highest. I took 120s starting 45s into the scan.
Measurement 1: 23:40:38 UTC on 2025/05/16 with ITMX aligned and ITMY mis-aligned.
See the spectrum with labelled peaks here.
And the PZT calibration here.
Mode mis-match is:
0.93/( 0.93 + 17.29 ) = 5.10 %
Measurement 2: 23:46:48 UTC on 2025/05/16 with ITMY aligned and ITMX mis-aligned.
See the spectrum with labelled peaks here.
And the PZT calibration here.
100 * 0.56/( 0.56 + 17.62 ) = 3.08 %
Bear in mind that this is assuming that there is no astigmatism in the OMC (since there is but we cannot resolve 02 vs 20 modes). This requires some careful analysis of uncertainties to get useful info about how we should tune for better mode-matching. Watch this space.
In these scans the SR3 heater request (POWER_SET) was 2W, the readback power monitor reports 1.9W.
Using the data from Elenna's scans with the sidebands on, I added a functioncalculate_modulation_depths()to the OMCscan.py code. I then used it to find the modulation depths for the 9 and 45 MHz from those scans:PDH measurement data for two GPS timestamps
Parameter GPS 1431450833 GPS 1431451160 Slider 9 MHz 23.4 dBm 20.4 dBm Slider 45 MHz 27.0 dBm 21.0 dBm Modulation depth 9 MHz 0.215 rad 0.165 rad Modulation depth 45 MHz 0.277 rad 0.145 rad
The default timezone has been corrected.