R. Crouch, J. Oberling
Yesterday we began measuring the locations of the vacuum chamber support tube ends using the FARO laser tracker. We started with the support tubes for the WBSC3 chamber and the +X ends of the WBSC2 support tubes as these were the most readily accesible. The remaining support tubes in the LVEA (WBSC1, WBSC2 -X ends, and all WHAM chambers except WHAM7) have iLIGO-era PEM Interface Plates on them that block the support tube; some of these plates have undocumented spacers between them and the support tubes they are attached to, meaning we cannot accurately locate the support tube end w.r.t. the PEM interface plate and therefore making an accurate measurement of the support tube location impossible. As an aside, Jim is in the process of removing these plates from the chambers (so far WHAM3 and WHAM4 are complete, WHAM1 and WHAM2 are 75% complete), so we can get at these support tube ends as the opportunity arises (he will then reinstall these plates, as they make for very convient mounts for dial indicators).
Measurement Method
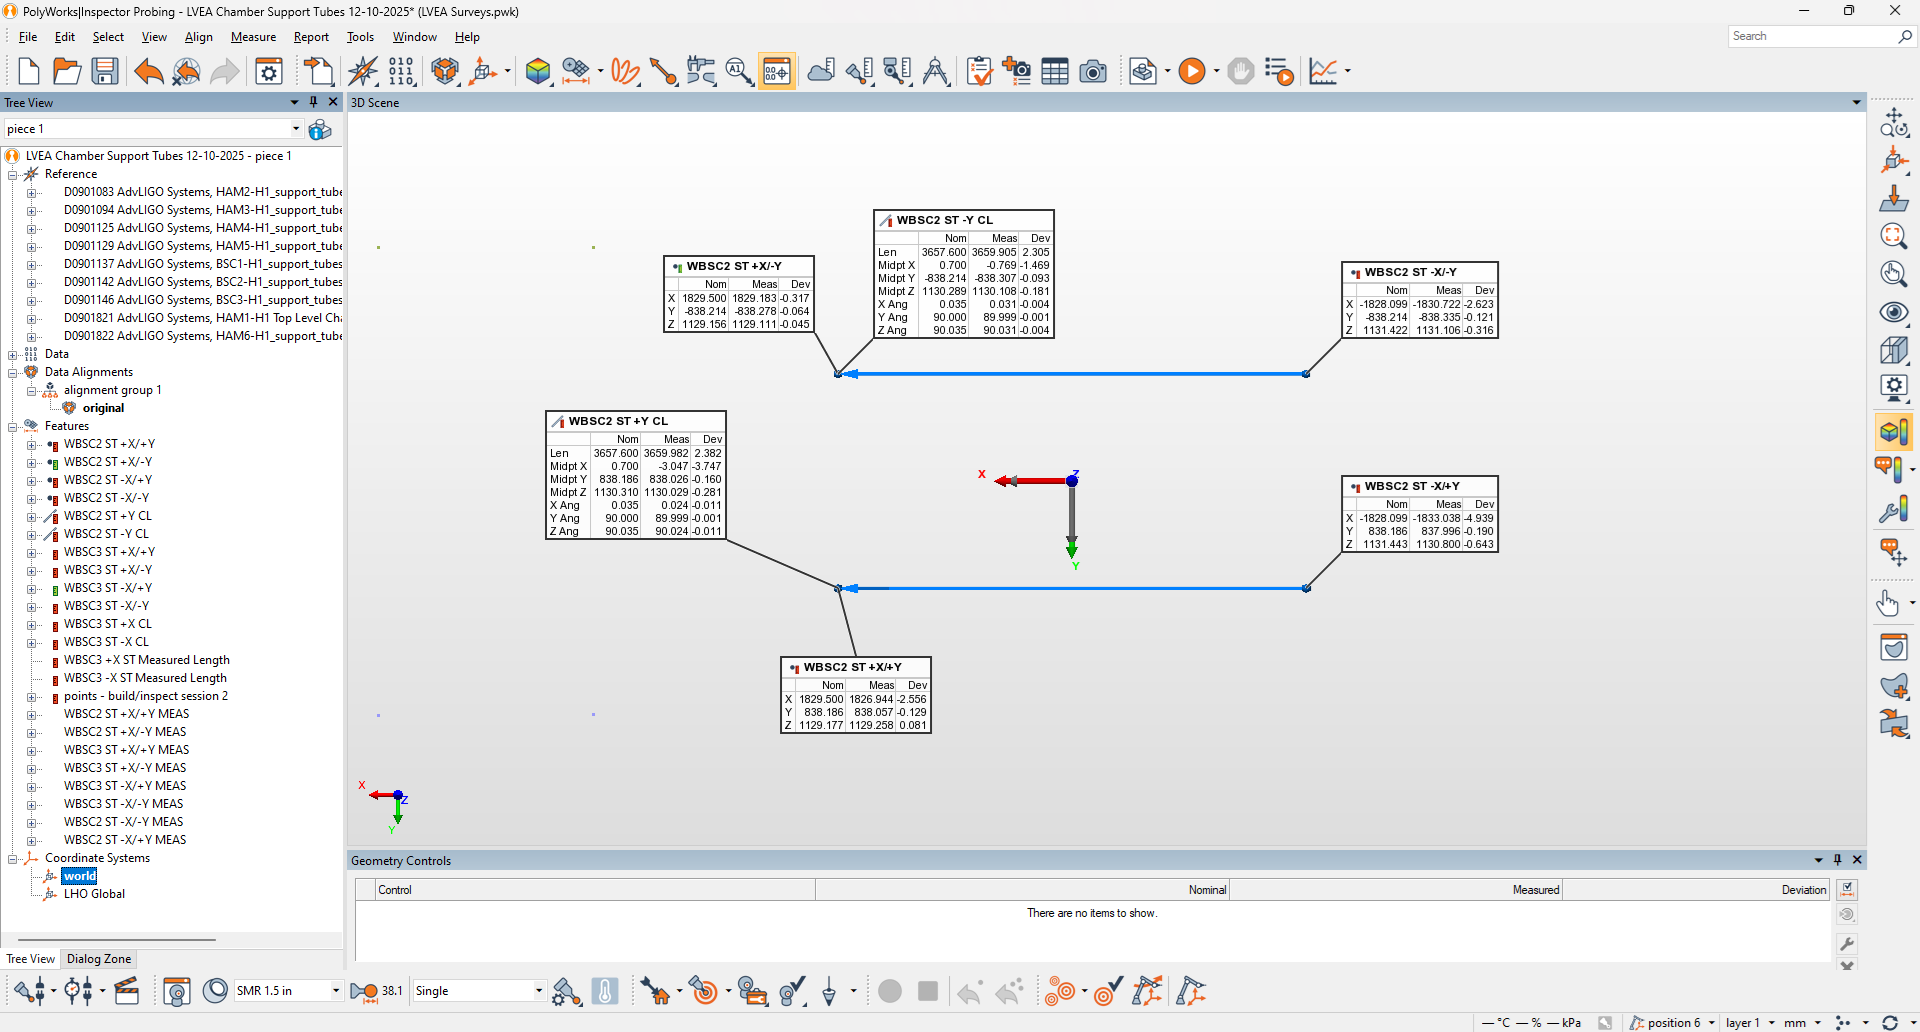
This is a fairly straightforward measurement, but there is a somewhat subtle "gotcha" that needs to be accounted for to get an accurate measurement. But first things first, we aligned the FARO to the LVEA's Building Coordinate system using our red alignment nests, then applied the X and Y axis rotations required to align the FARO to the site global coordinate system (see T0900340 for a brief overview of the coordinate systems in use). We then loaded CAD models of the support tubes, that Ryan downloaded from the SolidWorks vault with each model in the site global coordinate system, into the FARO's control software, PolyWorks. PolyWorks automatically reads the coordinate system information contained in the CAD files and places these models in position w.r.t. to the site global coordinate system. This gives us nominal locations of the support tube ends, a guide for our measurements, and also a nice visual reference for where everything is positioned.
Now for the "gotcha." The physical support tubes have a hole in the center of each end that is not represented in the CAD model, and this hole is large enough that the FARO target (a Spherically Mounted Retroreflector, or SMR, with a 1.5" diameter) sits slightly inside the hole. This means that when you're taking a measurement of the center of the support tube end using this hole the SMR is not measuring the location of the actual support tube end, it is a few mm inside of it. To account for this we did the following:
- Use the SMR to get the coordinate corresponding the the axial length of the support tube on either side of the end and calculate the average (to remove any yaw in the support tube)
- Using WBSC3 as an example, the support tubes lie parallel to the y-axis. So we touch the SMR to either side of the support tube and record the y-axis coordinate, then calculate the average
- We do this for each individual support tube end, as each one is slightly different
- Use the SMR to get the same coordinate, but this time with the SMR sitting in the center of hole of the support tube
- Calculate the difference between the two, to get the offset required for an accurate measurement
- In the PolyWorks software:
- Use the CAD model to create points representing the center of each end of the support tube
- Create a line between each end point, representing the theoretical centerline of the support tube
- Create a Measurement Point by offsetting the support tube end point along the centerline and to the inside of the support tube by the amount calculated in steps 1-3
- Congratulations, you now have a measurement point that represents the nominal location of the support tube end, taking into account the offset required due to SMR positioning inside the center hole
To take the measurement we used the Build/Inspect mode in PolyWorks. In this mode we have to be sure to select the "Towards Object" compensation method, which automatically compensates for the radius of the SMR (3/4", or 19.05 mm). If "None" is selected the FARO measures to the center of the SMR, but our measurement point is at the edge of the SMR, since that's what is physically touching the support tube, so we need to compensate for that radius. This gives us the deviations of the measurement point, which can then applied to the point representing the center of each support tube end to give their measured location. The results of our measurements are shown in the attachment. Since we had measurements for each end of the WBSC3 support tubes I also added a distance feature representing the measured length of each WBSC3 support tube.
Wrapping Up
Some points for discussion/further thought. Keep in mind that the BSC support tubes are not exact representations of where their respective optics are; we only aligned the optic during aLIGO install, and in the end didn't really care where the support tubes ended up as long as HEPI had enough range to work. This means that any deviation from nominal seen in the support tube ends is not an indication of misalignment of that chamber's optic.
- The WBSC2 support tubes were supposed to be lowered by ~2.5 mm to account for the BS z-axis position being at -82.9 mm instead of -80.0 mm; this was done because, while the 4km arm cavities are flat in global coordinates the IFO input and output arms are not, so the BS had to be lowered to properly direct the beam (which rises in elevation while traversing the PRC) into the arms. Therefore our expectation is that the WBSC2 support tubes are below the nominal z-axis coordinate of 1130.3 mm (we recently discovered that this change was not accounted for in the SolidWorks models for the sites). While the global z-axis coordinate for all BSC support tubes is 1130.3 mm, if WBSC2 was lowered as required we would still expect to see a z-axis deviation in the measured points, but this is clearly not the case.
- I was at LLO working on PRC alignment when the WBSC2 in-chamber alignment was started, so I have no memory of the initial positioning of the BS in-chamber; this was done by Hugh Radkins and Doug Cook (I had returned in time for pitch/yaw alignment). Looking back at their notes they had to move HEPI +X by 4.6 mm, -Y by 2.3 mm, and +Z by 0.4 mm to position the BS, so this does not fully account for apparent lack of support tube lowering. But as stated above, this does not necessarily mean the BS is too high (we'll know that for sure when we measure it once WBSC2 is opened in March 2026).
- The measured length for the WBSC3 support tubes is shorter than their as-designed length of 3657.6 mm. Not sure why at this point.
- Once we get more full BSC support tube measurements we'll have more info to work from
- The WBSC3 +X/-Y support tube end is a decent bit further in the +Y axis than expected. Again, not sure why.
- Looking back at my notes from install we had to move WBSC3 HEPI in the +Y dircection to properly place ITMx, so the overal deviation direction of these support tubes isn't a surprise.
This work was associated with LHO WP 12947, which also included the WBSC1 +X support tube ends. Those support tubes still have PEM interface plates installed, so we are currently unable to measure them (will do in the future once the plates are removed). Since we completed the rest of the measurements involved, I've closed the WP.


