[Jenne Louis Matt]
The change in the filters used by calibration created a 10% calibration error. Louis is trying to fix this but in an effort to have a way to revert to the previous filters without losing lock Jenne came up with a cdsutils way to revert back. Essentially it toggles off the new filters ('H1:OMC-DCPD_A0 FM10 H1:OMC-DCPD_B0') FM10
and steps the demod phase ('H1:OMC-LSC_PHASEROT')
in steps of 1 degree, 77 times, with a 0.065 sec delay (77steps/5seconds) between each step. The filter toggles have a 5 second ramp time, which informs the step delay in the cdsutils step, and the 77 degrees is the difference from the old demod phase and the new. Hopefully this avoids a lockloss in the event we are to revert, but may not. *fingers crossed*
Here is the command:
cdsutils switch H1:OMC-DCPD_A0 FM10 OFF; cdsutils switch H1:OMC-DCPD_B0 FM10 OFF; cdsutils step H1:OMC-LSC_PHASEROT 1,77 -s 0.065
UPDATE:
It worked :) anti-alias filters off and OMC-LSC phaserot returned to nominal
Locklossalert had a bug whereby repeat GRD_NOTIFY cell phone calls/texts were not being sent if H1 remained in the same lock/unlocked state throughout. This was seen on at least two occasions, Monday 20th January at 4am and Sunday 12th January at 6am.
New code with the fix was restarted on cdslogin at 16:03 23jan2025. All LLA settings were restored, but the reset cleared the H1 lock-clock (from 4+ hrs).
Summary
Q: What is the relationship between the strength of violin mode ring-ups and the number of narrow spectral artifacts around the violin modes? Is there a clear cut-off at which the contamination begins?
A: The answer depends on the time period analyzed. There was an unusual time period spanning from mid-June 2023 through (very approximately) August 2023. During this time period, the number lines during ring-ups was much greater than in the rest of O4, and the appearance of the contamination may have begun at lower violin mode amplitudes.
What to keep in mind when looking at the plots.
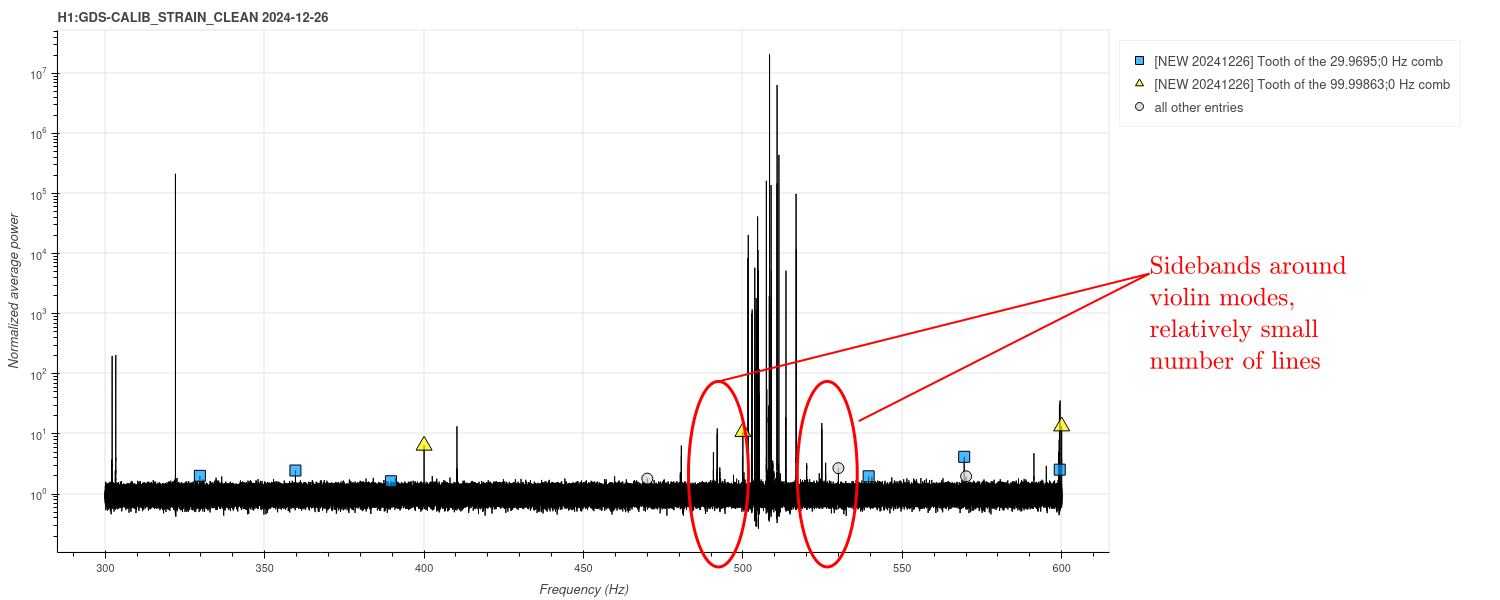
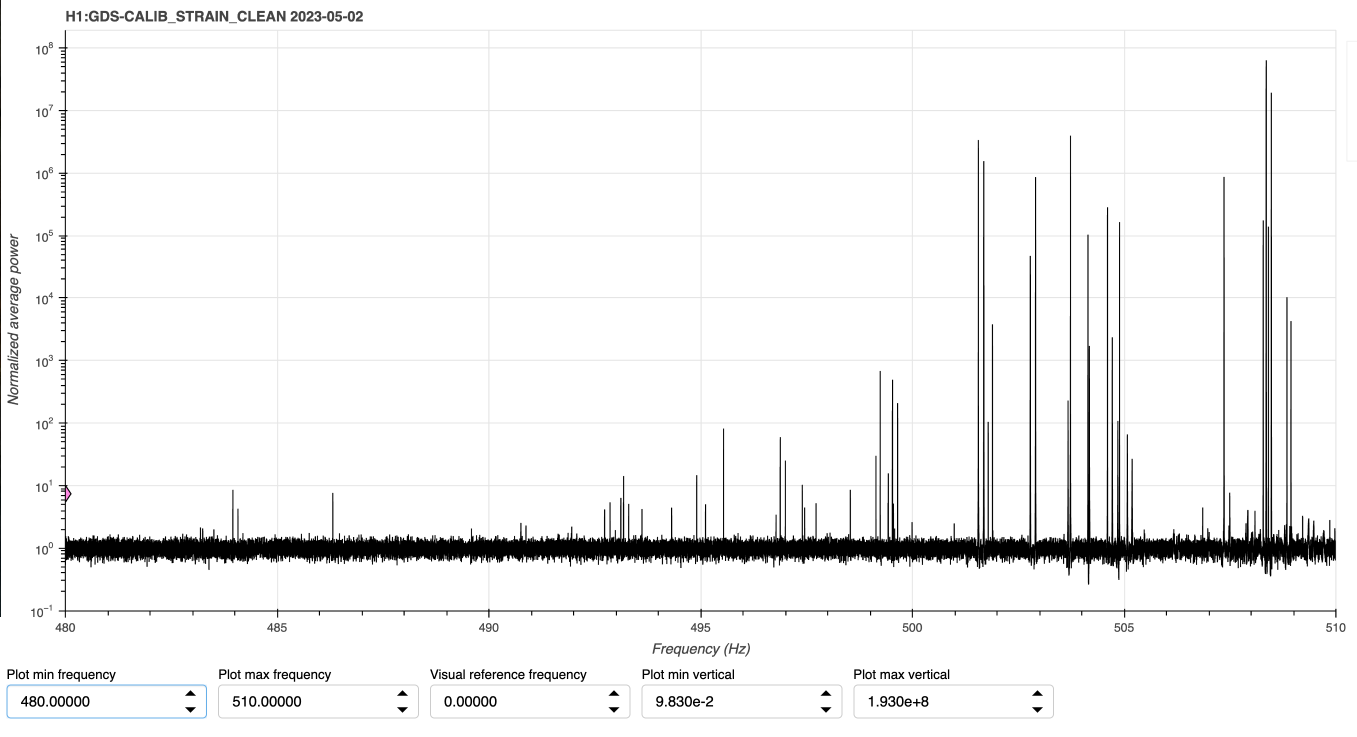
1. These plots use the Fscan line count in a 200-Hz band around each violin mode region, which is a pretty rough metric, and not good for picking up small variations in the line count. It's the best we've got at the moment, and it can show big-picture changes. But on some days, contamination is present, but only in the form of ~10 narrow lines symmetrically arranged around a high violin mode peak. (Example in the last figure, fig 7) This small jump in the line count may not show up above the usual fluctuations. However, in aggregate (over all of O4) this phenomenon does become an issue for CW data quality. These "slight contamination" cases are also particularly important for answering the question "at what violin mode amplitude does the contamination just start to emerge?" In short, we shouldn't put too much faith in this method for locating a cut-off problematic violin mode height.
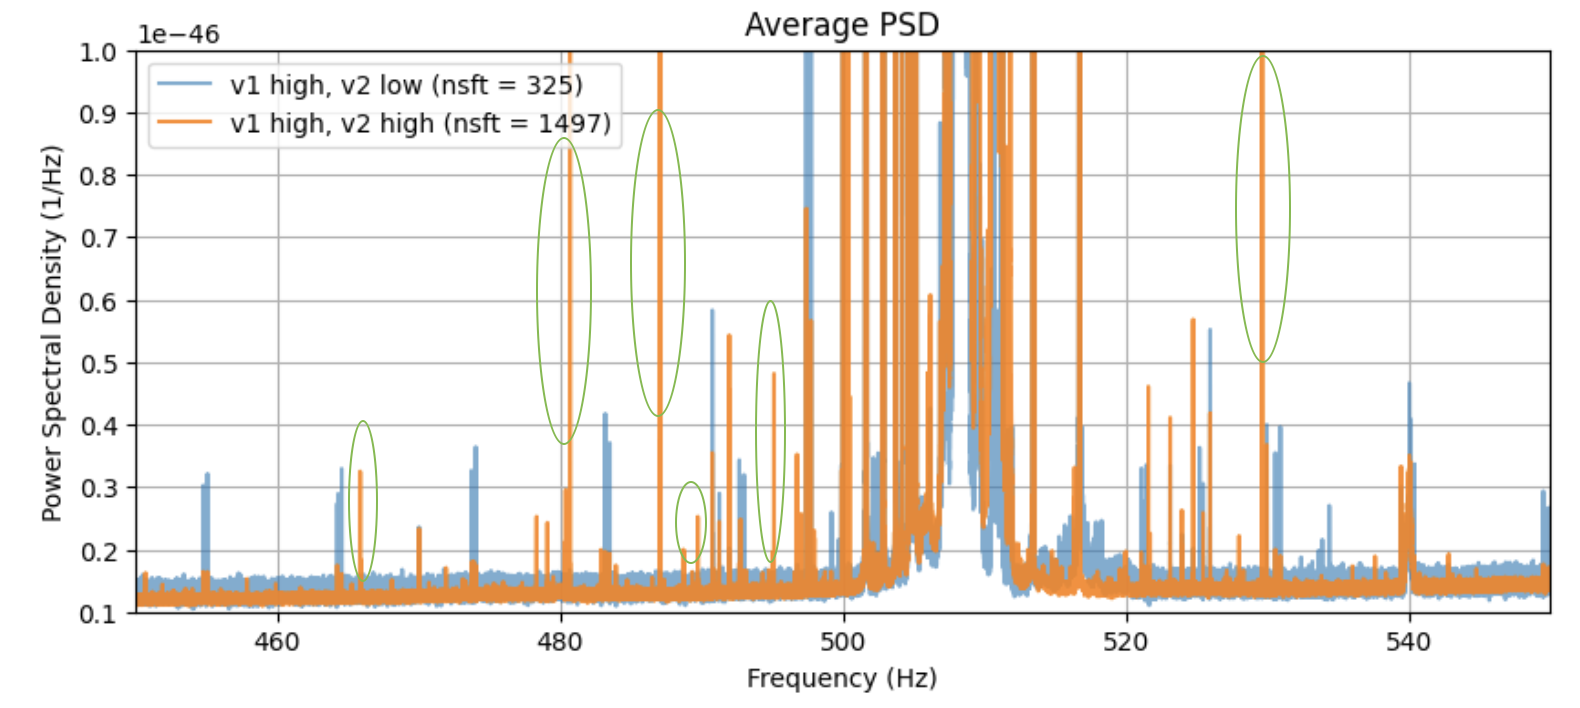
2. The violin modes may not be the only factor in play, so we shouldn't necessarily expect a very clear trend. For example, consider alog 79825 . This alog showed that at least some of the contamination lines are violin mode + calibration line intermodulations. Some of them (the weaker ones) disappeared below the rest of the noise when the violin mode amplitude decreased. Others (the stronger ones) remained visible at reduced amplitude. Both clusters vanished when the temporary calibration lines were off. If we asked the question "How high do the violin modes need to be...?" using just these two clusters, we'd get different apparent answers depending on (a) which cluster we chose to track (weak or strong), and (b) which time period we selected (calibration lines on or off). This is because at least some of the contamination is dependent on the presence & strength of a second line, not a violin mode.
Looking at the data
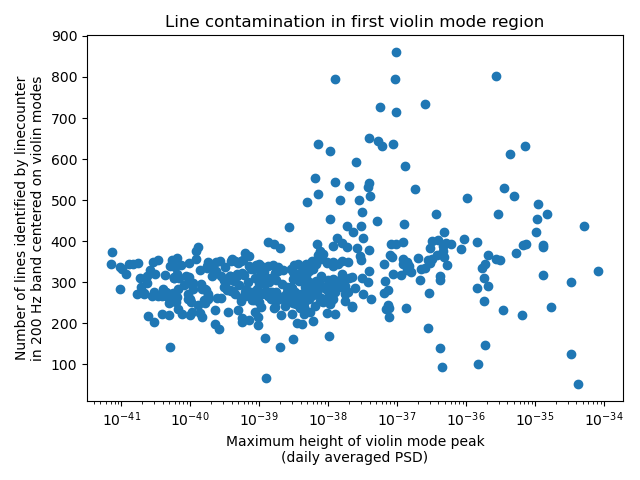
First, let's take a look at a simple scatter plot of the violin mode height vs the number of lines identified. This is figure 1. It's essentially an updated version of the scatter plots in alog 71501. It looks like there's a change around 1e-39 on the horizontal axis (which corresponds to peak violin mode height).
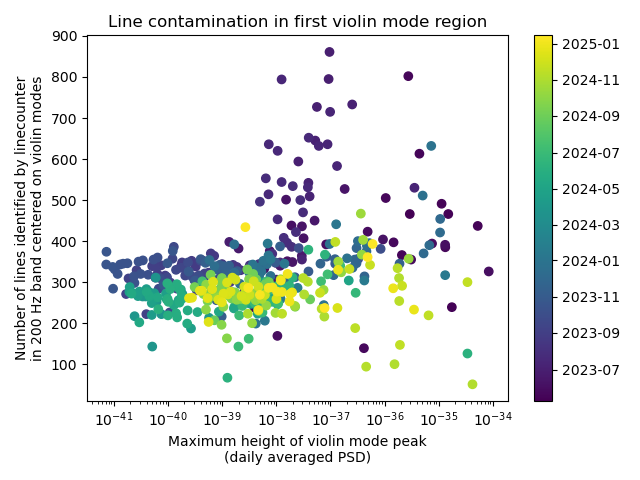
However, when we add color-coding by date (figure 2), new features can be seen. There's a shift at the left side of the plot, and an unusual group of high-line-count points in early O4.
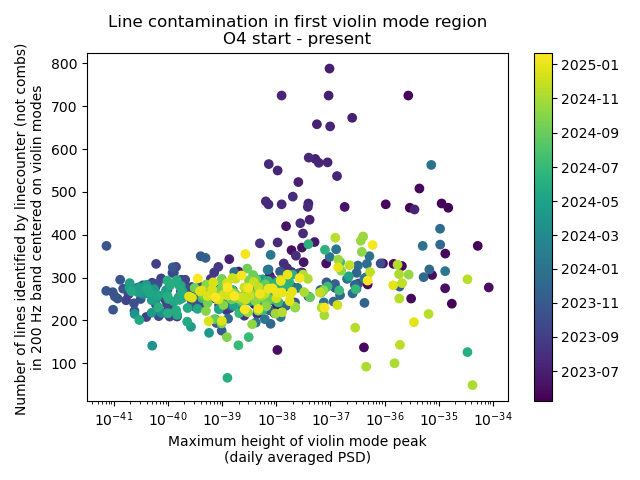
The shift at the left side of the plot is likely due to an unrelated data quality issue: combs in the band of interest. In particular, the 9.5 Hz comb, which was identified and removed mid O4, contributes to the line count. Once we subtract out the number of lines which were identified as being part of a comb, this shift disappears (figure 3).
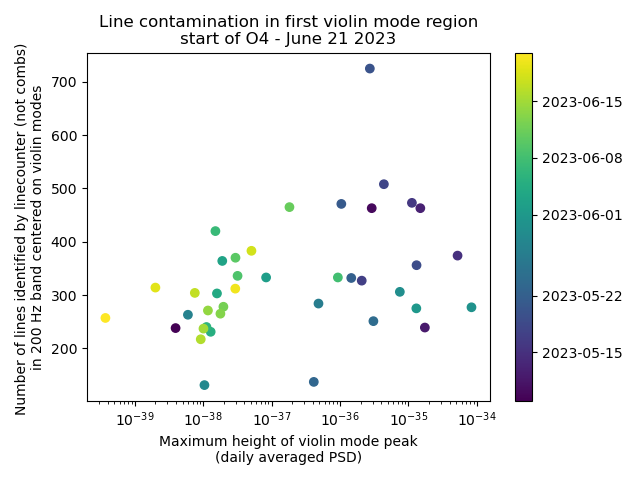
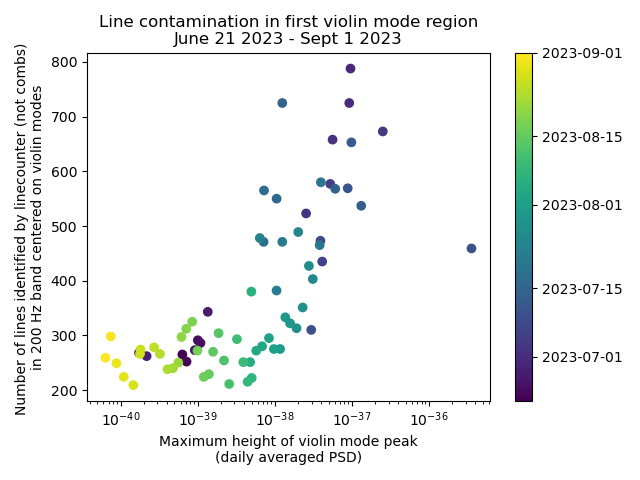
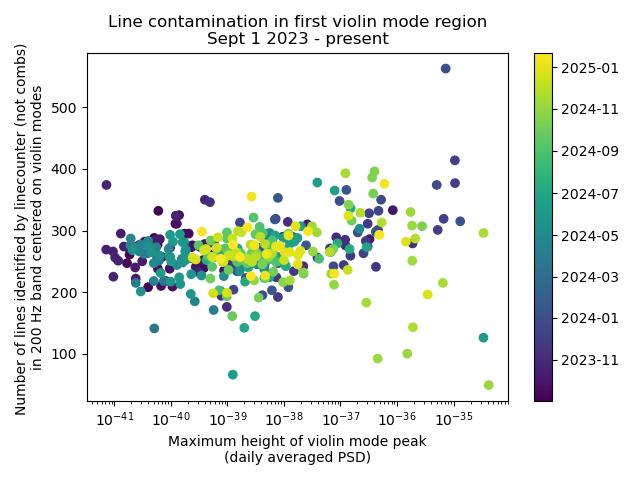
With the distracting factor of comb counts removed, we still need to understand the high-line-count time period. This is more interesting. I've broken the data down into three epochs: start of O4 - June 21, 2023 (figure 4); June 21, 2023 - Sept 1 2023 (figure 5); and Sept 1 2023 - present (figure 6). As shown in the plots, the middle epoch seems notably different from the others.
These dates are highly approximate. The violin mode ring-ups are intermittent, so it's not possible to pinpoint the changes sharply. The Sept 1 date is just the month boundary that seemed to best differentiate between the unusual time period and the rest of O4. The June 21 date is somewhat less arbitrary; it's the date on which the input power was brought back to 60W (alog 70648), which seems a bit suspicious. Note that, with this data set, I can't actually differentiate between a change on June 21 and a change (say) on June 15th, so please don't be misled by the specificity of the selected boundary.
Kiet, Sheila
We recently started looking into the whether nonlinearity of the ADC can contribute to this by looking at the ADC range that we were using in O4a.
They are showed in the H1:OMC-DCPD_A_WINDOW_{MAX,MIN} that sum the 4 DC photodiodes (DCPD). They are 18 bits DCPD, so that channel should saturate at 4* 2^17 ~520,000 counts.
Now there are instances that agree with Ansel report when there are violin mode ring up that we can see a shift in the count baseline.
Jun 29 - Jun 30, 2023 when the baseline seems to shift up and stay there for >1 months, Detchar summary page show significant higher violin mode ring up in the usual 500-520Hz region as well as the nearby region (480-500 Hz)
Oct 9, 2023 is when the temporary calibration lines are turned off 72096, the down shift happened right after the lines are off (after 16:40 UTC)
During this period, we were using a~5% of the ADC range (difference between max and min channel divided by the total range - 500,000 to 500,000 counts), and it went down to ~2.5 % once the shift happenned on Oct 9, 2023. We want to do something similar with Livingston, using the L1:IOP-LSC0_SAT_CHECK_DCPD_{A,B}_{MAX,MIN} channels to see the ADC range and the typical count values of those channels.
Another thing for us to maybe take a closer look is the baseline count value increase around May 03 2023. There was a change to the DCPC total photocurrent during that time (69358). Maybe worth checking if there is violin mode contaimination during the period before that.
Kiet, Sheila
More updates related to the ADC range investigation:
Further points + investigations:
Kiet, Sheila
Following up on the investigation into potential intermixing between higher-order violin modes down to the ~500 Hz region:
The Fscan team compiled a detailed summary of the daily maximum peak height (log10 of peak height above noise in the first violin mode region) for the violin modes near 500 Hz (v1) and 1000 Hz (v2). They also tracked line counts in the corresponding frequency bands: 400–600 Hz for v1 and 900–1000 Hz for v2. This data is available in the Google spreadsheet (LIGO credentials required).
n1_height
and n2_height
are the max peak heights of v1 and v2, and n1_count
and n2_count
are the corresponding line counts. There appears to be a threshold in violin mode amplitude beyond which line counts increase (based on {n1_height, n2_height} vs. {n1_count, n2_count} trends).Next: We plan to further investigate the lines that appear when both modes are high, the goal is to identify possible intermodulation products using the recorded peak frequencies of the violin modes.
J. Kissel, L. Dartez, E. Goetz In process of updating the calibration after installing the extra AA 65k to 16k digital AA filter we turned on this morning (see 82404, 82412 and 82413), we've updated the "template" pyDARM DARM model parameter set that is the basis for all copies for every report against which the model is compared against measurement, and from which the calibration pipeline's model is derived. The changes are relatively simple, -omc_filter_noncompensating_modules = 9,10 : 9,10 +omc_filter_noncompensating_modules = 8,9,10 : 8,9,10 -omc_filter_file = Common/H1CalFilterArchive/h1iopomc0/H1IOPOMC0_1364929770.txt +omc_filter_file = Common/H1CalFilterArchive/h1iopomc0/H1IOPOMC0_1421610658.txt where the "-" lines are the "before" and the "+" lines are the "after." Here's the location of the file, and the corresponding "before" vs. "after" git commit hash. /ligo/groups/cal/H1/ifo/pydarm_H1.ini Previous version f480b0a1 Now new version 17649002
Also (somehow) remembered that another minor problem with the TST stage actuation path was the current CALCS replica of the L2L_DRIVEALIGN_GAIN. H1:CAL-CS_DARM_FE_ETMX_L3_DRIVEALIGN_L2L_GAIN needs to be the same the pydarm_H1.ini vs. what's in the front-end. Changed the value from 191.712 to 184.65, - tst_drive_align_gain = 191.712 + tst_drive_align_gain = 184.65 This is all changing the same file in the same location, but here's the next iteration's change. /ligo/groups/cal/H1/ifo/pydarm_H1.ini ccc02365
In addition to changing the parameter file for the extra OMC DCPD digital AA filtering, we decided to *also* push a somewhat long-standing issue with apparent delays in actuation functions. We're applying 23.0e-6 [sec] worth of delay to the model of the UIM stage, and more consequentially, 20.2e-6 worth of delay to the TST stage. Both numbers are informed by the fit to the actuation measurements we just took, see 20250123T211118Z. The updated parameter set has been push to git with the following local location and mothership git hash. /ligo/groups/cal/H1/ifo/pydarm_H1.ini 4d9eb345 The calibration we installed / pushed / exported today will have all three of these changes in play.
TITLE: 01/23 Eve Shift: 21:00-0600 UTC (1300-2200 PST), all times posted in UTC
STATE of H1: Commissioning
OUTGOING OPERATOR: TJ
CURRENT ENVIRONMENT:
SEI_ENV state: CALM
Wind: 21mph Gusts, 14mph 3min avg
Primary useism: 0.04 μm/s
Secondary useism: 0.20 μm/s
QUICK SUMMARY:
Tj is out early & I'm starting Eve shift starting now.
H1 is currently in Nominal_Low_Noise and Comissioning.
The Calibration team is running some OMC tests and we will return back to Observing around 22:00 UTC.
TITLE: 01/23 Day Shift: 1530-0030 UTC (0730-1630 PST), all times posted in UTC
STATE of H1: Commissioning
INCOMING OPERATOR: Tony
SHIFT SUMMARY: We are currently finishing up few minor commissioning items and a calibration measurement and then we will be headed into observing. Two lock losses during my shift, one from the calibrators and one most likely from some view port work. Relocks were straight forward.
LOG:
Start Time | System | Name | Location | Lazer_Haz | Task | Time End |
---|---|---|---|---|---|---|
17:16 | SAFETY | LAZER HAZ (\u2310\u25a0-\u25a0) | LVEA | !!!YES!!! | LVEA = LASER HAZARD! | 16:35 |
16:35 | FAC | Kim | Opt Lab | n | Tech clean | 16:57 |
17:55 | FAC | Kim | MY | n | Tech clean | 18:59 |
18:12 | PEM | Robert | LVEA | YES | Setup viewport power metering | 18:47 |
18:15 | VAC | Richard, Ken | EX | n | Look at compressor electrical | 18:47 |
18:49 | ISS | Keita, Rahul, Mayank, Sivananda, Jennie | Opt Lab | n | ISS array prep | 20:36 |
19:41 | PEM | Robert | LVEA | yes | VP pictures near BSC3 | 20:31 |
After the CAL team changed the OMC digital phase in 82413, the SQZ at the start of the lock went through an excursion much larger than usual, all the way to 5dB of ASQZ before settling around -3.5dB of SQZ, plot. We often have a SQZ excursion at the start of the lock but it rarely gets above 0dB. We are unsure if it makes sense that the OMC change would effect the SQZ like this or we were just unlucky.
I paused SQZ_MANGER and took SQZ_ANG_ADF to DOWN. I think tuned H1:SQZ-CLF_REFL_RF6_PHASE_PHASEDEG for the best SQZ and adjusted H1:SQZ-ADF_OMC_TRANS_PHASE to get H1:SQZ-ADF_OMC_TRANS_SQZ_ANG to zero, effectively setting the setpoint of the servo. Adjusted from -138 to -128 sdf. We may need to change this again or revert before going back to observing if the SQZ isn't good with a more thermalized IFO.
Also used this time to reduce the HAM7 rejected SHG power. Enabling (not moving) the picos unlocked SQZ which is surprising.
The supposition of *how* the change in digital anti-aliasing might have impacted the ADF / SQZ loop is as follows: - The actuation / excitation of the ADF / SQZ tuning system is a single line driven into the ADF's VCXO at 322.0 Hz. - That ADF field beats against the IFO field, which is influenced by the DARM control loop. - The new digital AA filter causes -4.5 deg phase loss (and an increase in amplitude of 0.1%) at 322.0 Hz, and changes the DARM open loop gain in that same way. - Thus the 322 Hz DEMOD of the IFO vs. SQZ beatnote field that's picked off at 3.125 MHz needs a phase adjustment. If that (I don't really know what I'm talking about) model of what's happening is happening, I would have expected the ADF SQZ DEMOD phase to need exactly 4.5 [deg] of phase change, much like the OMC LSC SERVO's DEMOD phase needed changing at it's modulation frequency (see LHO:82413). Camilla's main log here suggests a (-138) - (-128) = 10 [deg] phase shift. I very much welcome other mechanisms/models of what has happened if this change in SQZ behavior is a result of the OMC DCPD digital filter change.
Once we'd been locked for 4 hours, I again tweaked the SQZ angle by finding the angle ether side of good SQZ and going to the middle the adjusting ADF phase, diff attached, so that the total phase change since the OMC changes is the 4deg that Jeff predicted.
SQZ at 1kHz+ still isn't as good as I remember so we touched the OPO temp while in observing as in 80461, no change needed.
Reverted back to -128deg ready for reverting CAL team to revert thier changes.
E. Goetz, J. Kissel, L. Dartez In previous aLOGs (see, e.g., LHO aLOG 82405), we had to decimate the 524 kHz data offline in order to evaluate the improvement of TEST channels with changes to anti-alias filtering. We expected to see a reduction in artifacts with the addition of 1 extra 65-16k decimation filter. Attached is a figure showing before and after the ratio of ASDs calculated in DTT from the DCPD A0 channel (not the TEST A channels). This figure shows some improvements (though perhaps hard to see visually) and introduces more questions, especially comparing to a plot like in LHO aLOG 82405, attached here as well. Statistics: Bins above 1% before = 33416 Bins above 1% after = 30273 Bins above 1% before, f < 2000 Hz = 9011 Bins above 1% after, f < 2000 Hz = 8362 Mean before = 1.1087 Mean after = 1.0651 Mean before, f < 2000 Hz = 1.0756 Mean after, f < 2000 = 1.0495 So we do see that the number of bins above 1% has gone down as expected (good), but the raw number of bins above 1% is much different than our expectations. Figure 1 simply seems far noisier than Figure 2. What is the cause of this? It would seem to imply that the IOP downsampling is not simply grabbing 1 value for every 32 samples in a consistent manner, or perhaps the way DTT grabs and exports the PSD data? I'll have to keep digging, but this seems strange
This may be improved by using a the double precision version of diaggui, 'diaggui_test', creates much less noisy ASDs, especially at higher frequencies.
In the attached image, single precision ASD is on the left and double precision is i on the right.
There may be a DTT export precision issue at play here with the ASD as Erik suggests. I wanted to carry out a time series analysis offline, so I exported all of the data before and after for the 16k (H1:OMC-DCPD_A_OUT_DQ) and 524k (H1:OMC-DCPD_A0_OUT) channels. Then I computed the PSD of the 524k channel and 16k channel, plus downsampling the 524k channel and computing the PSD. Then I plot the ratio of the 16k PSD over the 524k PSD (cut off to the 16k Nyquist) to inspect the data for excess noise before and after the addition of the extra 65-16k downsampling filter. I don't understand the red curve, but the blue curve seems reasonable, as well as the black and grey curves. The blue curve shows excess noise that is then suppressed by the additional filter seen in the absence of large ratio values in the black and gray curves. This result shows that the extra filtering is helpful, but until we can push a new calibration, we'll have to hold off adding it in.
I have added whitening and dewhitening filters to the appropriate esd to 28 bit dac filters for the glitch limiting I posted about here. Filters can be accessed from the 28 bit dac test screen called DAC TEST, under the WD tab on the sitemap. Filters aren't engaged, locking has been a challenge this morning and I'm not sure when the filters should be engaged. I also need to try to figure out what the limit should be. I will try to see if we can fit a test in during a commissioning window next week.
Whitening filters are in the L3_ESD_{U/L}{L/R} filters, on the input column of the DAC TEST medm, limits should get applied in those filter banks as well. Dewhitening filters are in the ETMX_18_2_28_CHAN_1/2/3/4 filters in the output row on the bottom of the screen.
Filters I installed are shown in the attached image.
L. Dartez, E. Goetz, J. Kissel, T. Shaffer After we killed the lock stretch by turning on the extra 16 kHz anti-aliasing filter (LHO:82412) -- we found that the OMC wouldn't lock after 4 to 5 attempts during the next lock acquisition attempt. We turned on the 16 kHz AA filter early in the lock acquisition sequence "it would just work" and really -- thinking the cause of the lock loss was the loss of phase margin in the DARM loop. However after seeing the abnormally large number of failed OMC attempts, we suspected the new filter again. Then we realized -- the extra AA filter will cause phase loss at the 4.19 kHz OMC LSC dither line, and thus the OMC LSC DEMOD needs to be rephased to account for it. The magnitude / phase of the 65k to 16kHz AA filter at the 4.19e3 Hz dither line frequency is 1.0837 [ct/ct] / -77.2 [deg]. As such, we adjusted the H1:OMC-LSC_PHASEROT from 56 deg to 56 [deg] - 77 [deg] = -21 [deg], and the OMC "locked right up." (We assume that an 8% increase in the OMC LSC dither line signal would only be *good* for the OMC locking, but this will be confirmed with others later.) We are now in Nominal Low Noise with the extra AA filter on, and have been for 8 minutes (and the many minutes prior that it takes to get from transitioning to DC READOUT and getting to Nominal Low Noise). I've accepted the two changes in the safe and OBSERVE SDFs for the h1omc and h1iopomc0 front-end models.
Screenshots of SDF accepting. h1iopomc0 model's safe and OBSERVE files are linked to the same file, /opt/rtcds/userapps/release/cds/h1/burtfiles/h1iopomc0/safe.snap. h1omc model's safe and OBSERVE files are linked to /opt/rtcds/lho/h1/target/h1omc/h1omcepics/burt/OBSERVE.snap -> /opt/rtcds/userapps/release/omc/h1/burtfiles/h1omc_OBSERVE.snap /opt/rtcds/lho/h1/target/h1omc/h1omcepics/burt/safe.snap -> /opt/rtcds/userapps/release/omc/h1/burtfiles/h1omc_down.snap
Thu Jan 23 10:11:46 2025 INFO: Fill completed in 11min 43secs
Gerardo confirmed a good fill curbside. TCmins [-79C,-77C] OAT (0C,32F). delta-temp trip 10:11:53
Looking for the latest In-Lock Sus Charge files i find that last ones were made on Jan 7th and already alogged 82163 .
cdsws25: ls /opt/rtcds/userapps/release/sus/common/scripts/quad/InLockChargeMeasurements/rec_LHO -lt | head -n 6
total 527
-rw-r--r-- 1 test_user controls 160 Jan 7 07:58 ETMX_12_Hz_1420300733.txt
-rw-r--r-- 1 test_user controls 160 Jan 7 07:50 ETMY_12_Hz_1420300262.txt
-rw-r--r-- 1 test_user controls 160 Jan 7 07:50 ITMY_15_Hz_1420300244.txt
-rw-r--r-- 1 test_user controls 160 Jan 7 07:50 ITMX_13_Hz_1420300243.txt
-rw-r--r-- 1 test_user controls 160 Dec 17 07:58 ETMX_12_Hz_1418486333.txt
Since I thought I remember us being locked this past Tuesday morning I checked to see if the SUS_Charge Guardian ran and it looks like it didn't run, but we were actually locked?
I don't see a reason why it wouldn't have run. It looks like since the h1guardian1 machine reboot ont he 14th it hasn't run. Looking at the code it wait for exactly 07:45:00 PT. Maybe it missed that exact second for some reason? That said, the EXECTIME channel for that node shows 0, so I would expect it to catch that second. I've reran SUS_CHARGE through INIT and we'll see if it does it next Tuesday. If not, perhaps we change this to have a >1 second buffer on start time.
J. Kissel, E. Goetz, L. Dartez As mentioned briefly in LHO:82329 -- after discovering that there is a significant amount of aliasing from the 524 kHz version of the OMC DCPD signals when down-sampled to 16 kHz -- Louis and Evan tried a versions of the (test, pick-off, A1, A2, B1, and B2) DCPD signal path with two copies, each, of the existing 524 kHz to 65kHz and 65 kHz to 16 kHz AA filters as opposed to one. In this aLOG, I'll refer to these filters as "Dec65k" and "Dec16k," or for short in the plots attached "65k" and "16k." Just restating the conclusion from LHO:82329 :: Having two copies of these filters -- and thus a factor of 10x more suppression in the 8 to 32kHz region and 100x more suppression in the 32 to 232 kHz region -- seems to dramatically improve the amount of aliasing. Recall these filters were designed with lots of compromises in mind -- see all the details in G2202011. Upon discussion of applying this "why don't we just add MOAR FIRE" option 2xDec65k and 2xDec16k option for the primary signal path, there was concerns about - DARM open loop gain phase margin, and - Computational turn-around time for the h1iopomc0 front-end process. I attach two plots to help facilitate that discussion, (1st attachment) Bode plot of various combinations of the Dec65k and Dec16k filters. (2nd attachment) Plot of the CPU timing meter over the weekend, the during in which these filters were installed and ON in the 4x test banks on the same computer. For (1st) :: Here we show several of the high-frequency suppression above 1000 Hz, and phase loss around 100 Hz for a couple of simple combinations of filtering. The weekend configuration of two copies of the 65k and 16k filters is shown in BLACK, the nominal configuration of one copy is shown in RED. In short -- all these combinations incur less than 5 deg phase loss around the DARM UGF. Louis is going do some modeling to show the impact of these combinations on the DARM loop stability via plots of open loop gain and loop suppression. We anecdotally remember that the phase margin is "pretty tight," sub-30 [deg], but we'll wait for the plots. For (2nd) :: With the weekend configuration of filters, with eight more filters (the copies of the 65k and 16k, copied 4 times in each of the A1, A2, B1, B2 banks) installed and running, the extremes of CPU clock cycle turnaround time did increase, from "never above 13 [usec]" to "occasionally hitting 14 [usec]" out of the ideal 1/2^16 = 15.26 [usec], which is rounded up on the GDSTP MEDM screen to be an even 16 [usec]. This is to say, that "we can probably run with 4 more filters in the A0 and B0 banks," though that may necessarily limit how much filtering can be in the A1, A2, B1, B2 banks for future testing. Also, no one has really looked at what happens to the gravitational wave channel when the timing of the CPU changes, or gets near the ideal clock-cycle time, namely the basic question "Are there glitches in the GW data when the CPU runs longer than normal?"
Unless a DAC, ADC, or IPC timing error occurs, then a long IOP cycle time will not affect the data. The models have some buffering, so can even suffer an occaisional long cycle time beyond the maximum without affecting data.
h1iopomc0 average cycle time is about 8 us (see the IO Info button on the GDS TP screen), so can probably run with a consistent max cycle time well beyond 15 us without affecting data.
Here, the 1st attachment, a two week trend of H1IOPOMC0 front-end (DCUID 179) CPU timing activity during this time periods flurry of activity in installing, turning on, and using lots of different combinations of (relatively low Q, low-order, low SOS number) filters. While the minute trend of the primary "CPU_METER" channel is creeping up, the "CPU_AVG" has only incremented up once to 8 [usec] that Erik quotes above. FYI these channels can be found displayed on MEDM in the IOP's GDS_TP screen, following the link to "IO Info" and looking at the "CPU PROCESSING TIMES" section at the top middle. See second attachment.
Bright beam spot on HAM3 ballast mass baffle moves with ITMY compensation plate yaw motion
We have been looking for the source of the scattering noise that varies with the ITMY compensation plate yaw setting (80499). I recently searched for beam spots in the HAM3 area that move as CPY is yawed, using movies that I took from both the MC2 camera viewport and the PR2 camera viewport near HAM2. Anamaria and I had done some of this before (77631) but this time I recorded the CP movements on the audio track of the movies for a more precise correlation. And I also modified the movies in iMovie to increase visibility of faint spots. Figure 1 shows that I did find a spot that moved precisely with CPY Yaw settings (link to movie clips: https://youtu.be/FDdNDPoQadU ). The spot appears to be on a ballast mass baffle (see Fig. 1), which is not angled as much as the scraper baffle (which I think the beam is supposed to fall on (Alena's slides)) and may thus retroreflect more light.
Mystery beam spot on HAM3 spool piece comes from ITMX direction, not HAM2 direction
I had previously misinterpreted the pattern of light on edges and bellows of the HAM3 spool piece as suggesting that the mystery beam spot (78192) was coming from the HAM2 direction . More recently I found that there was light on the HAM3 side of the MC baffle that had a similar interference pattern and was consistent with being part of the mystery beam spot (Figure 1). The light on the HAM3 side of the baffle was visible when looking through the viewport for the PRM camera at a high angle. Thus, the beam is most likely coming from the ITMX direction, travelling close to the –Y wall of the beam tube.
One possibility is that it actually comes from ITMX, either scattered light from ITMX or scattered light from the back side of MC2 reflecting off of ITMX. Figure 3 shows these suggested paths and a picture taken from the point of view of the beamspot on ITMX that shows that there is a clear path to the site of the mystery beam spot. I think that the cartoon shows that it would be worth using a real model to determine if these paths are possible.
I checked to see if the beamspot on the eye baffle moved or modulated when I actuated the compensation plates. I made movies as I moved the two compensation plates more than 600 microradions in pitch and yaw, but, unlike the spot on the ballast mass baffle, I did not see any modulation or motion of the spot on the eye baffle.
Somehow I used the wrong photo in Figure 3 - it is actually a photo from the beamsplitter. The correct photo from CPx is used in the corrected version of Figure 3 attached here.
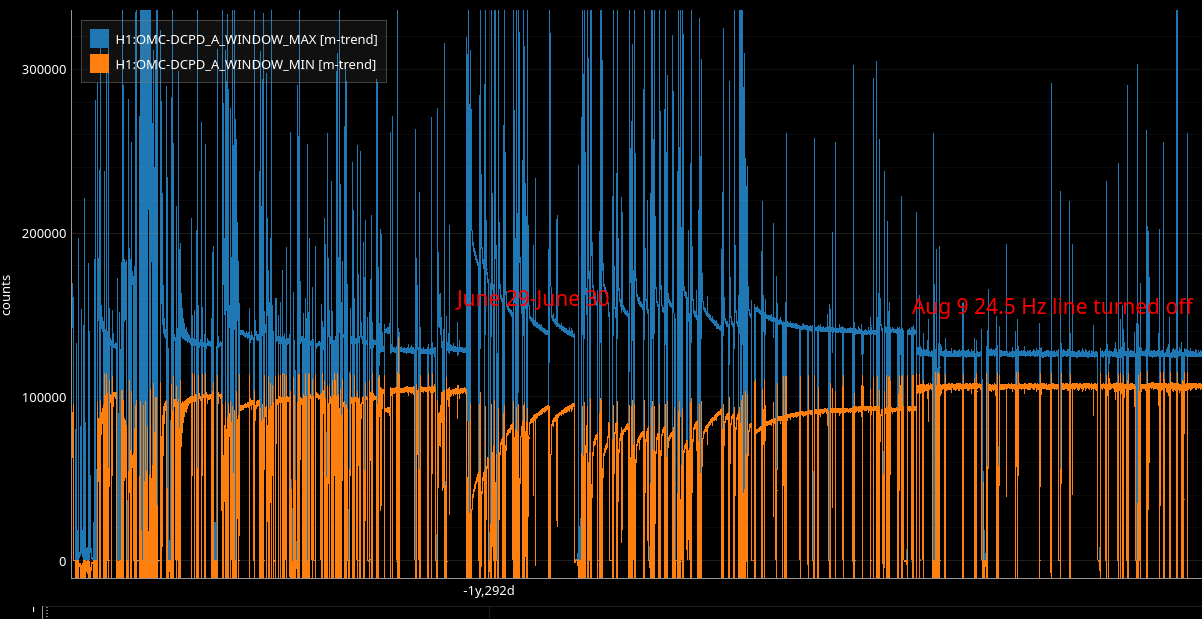
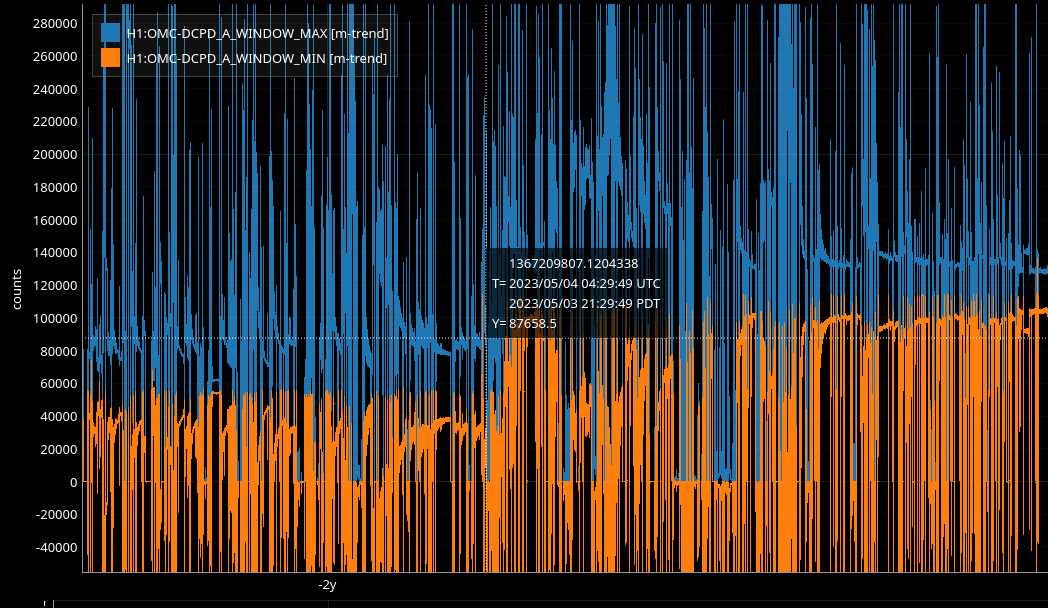
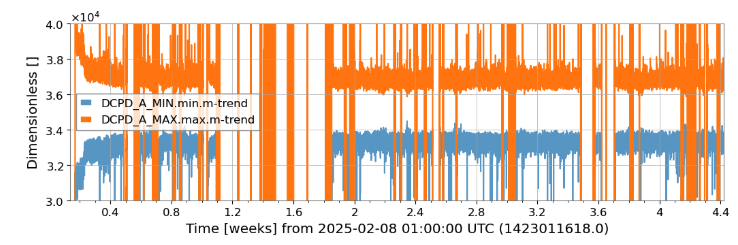
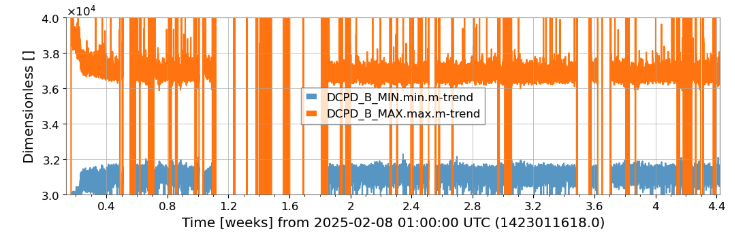
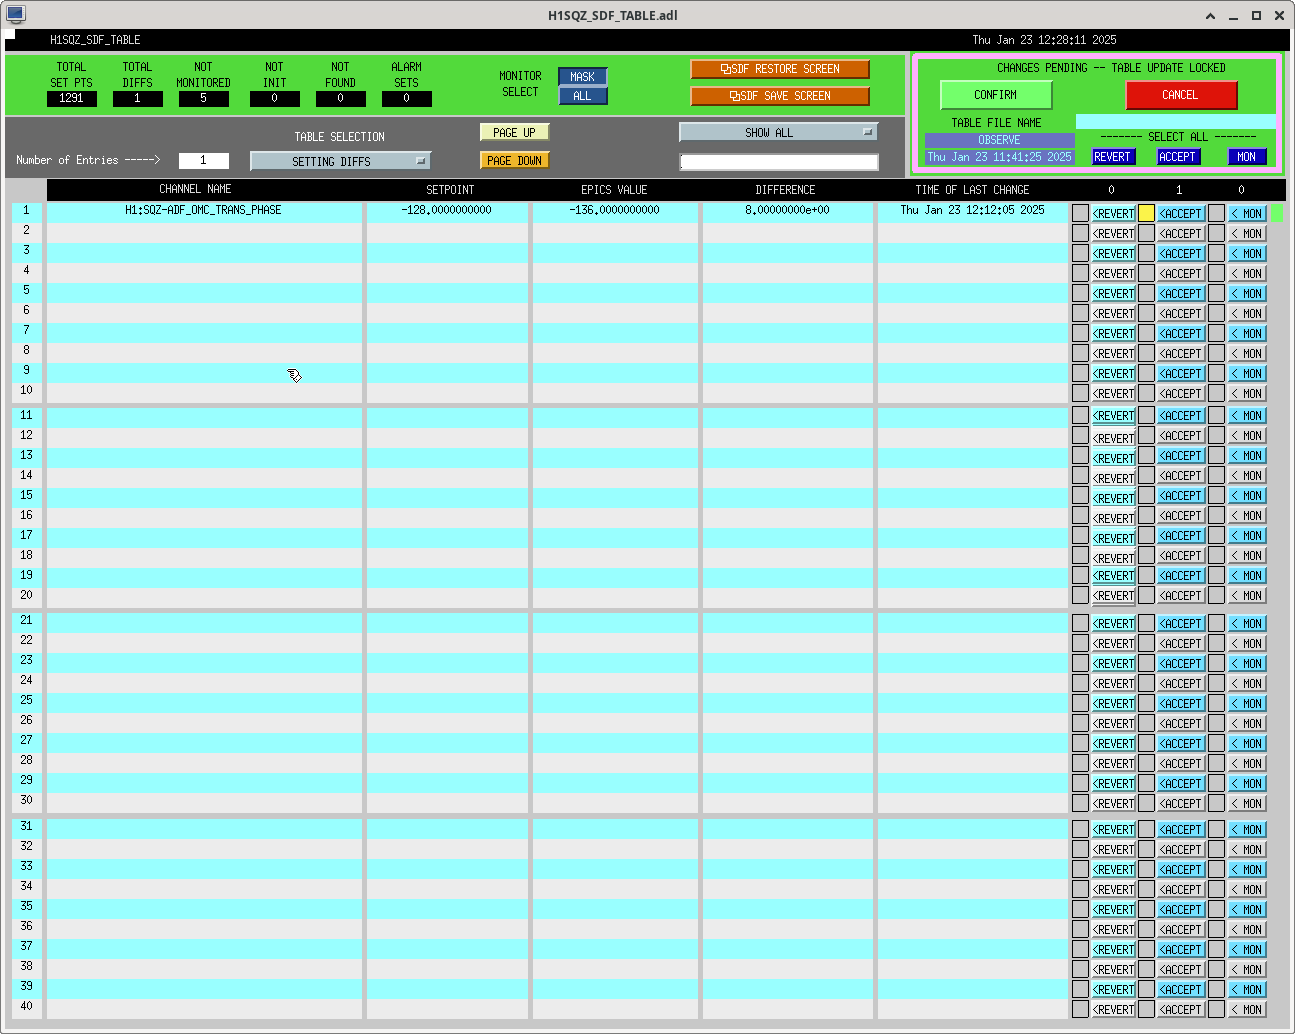
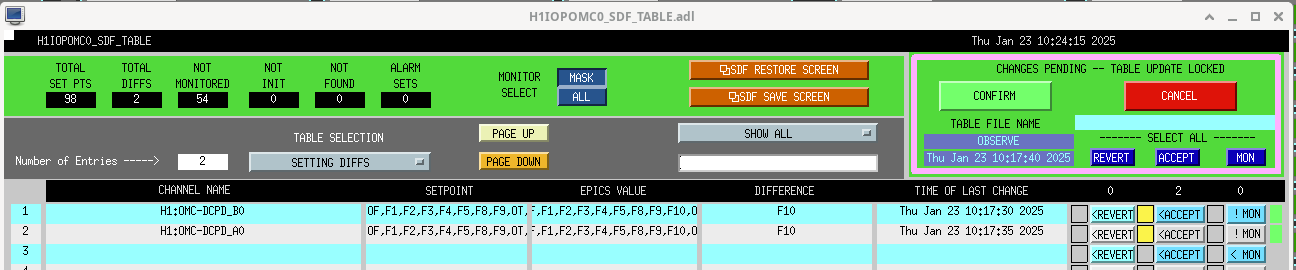
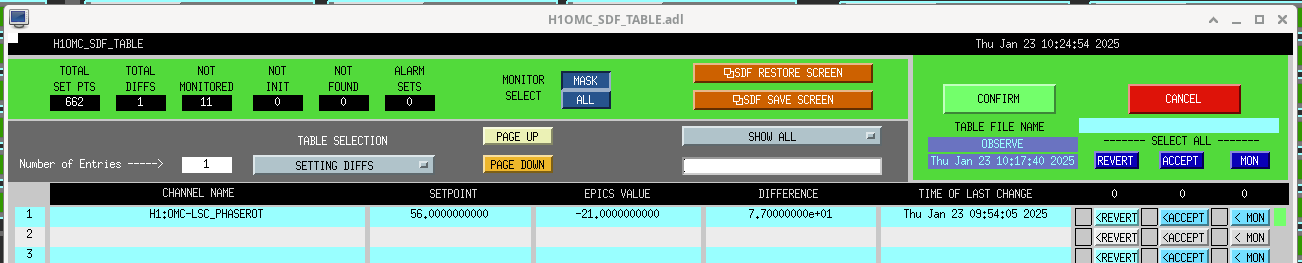
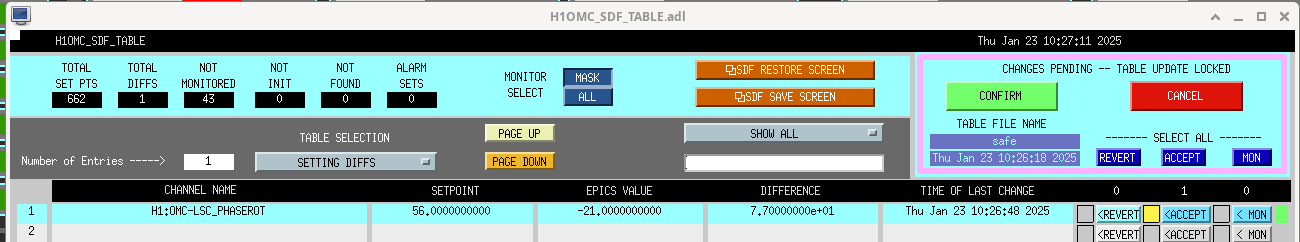
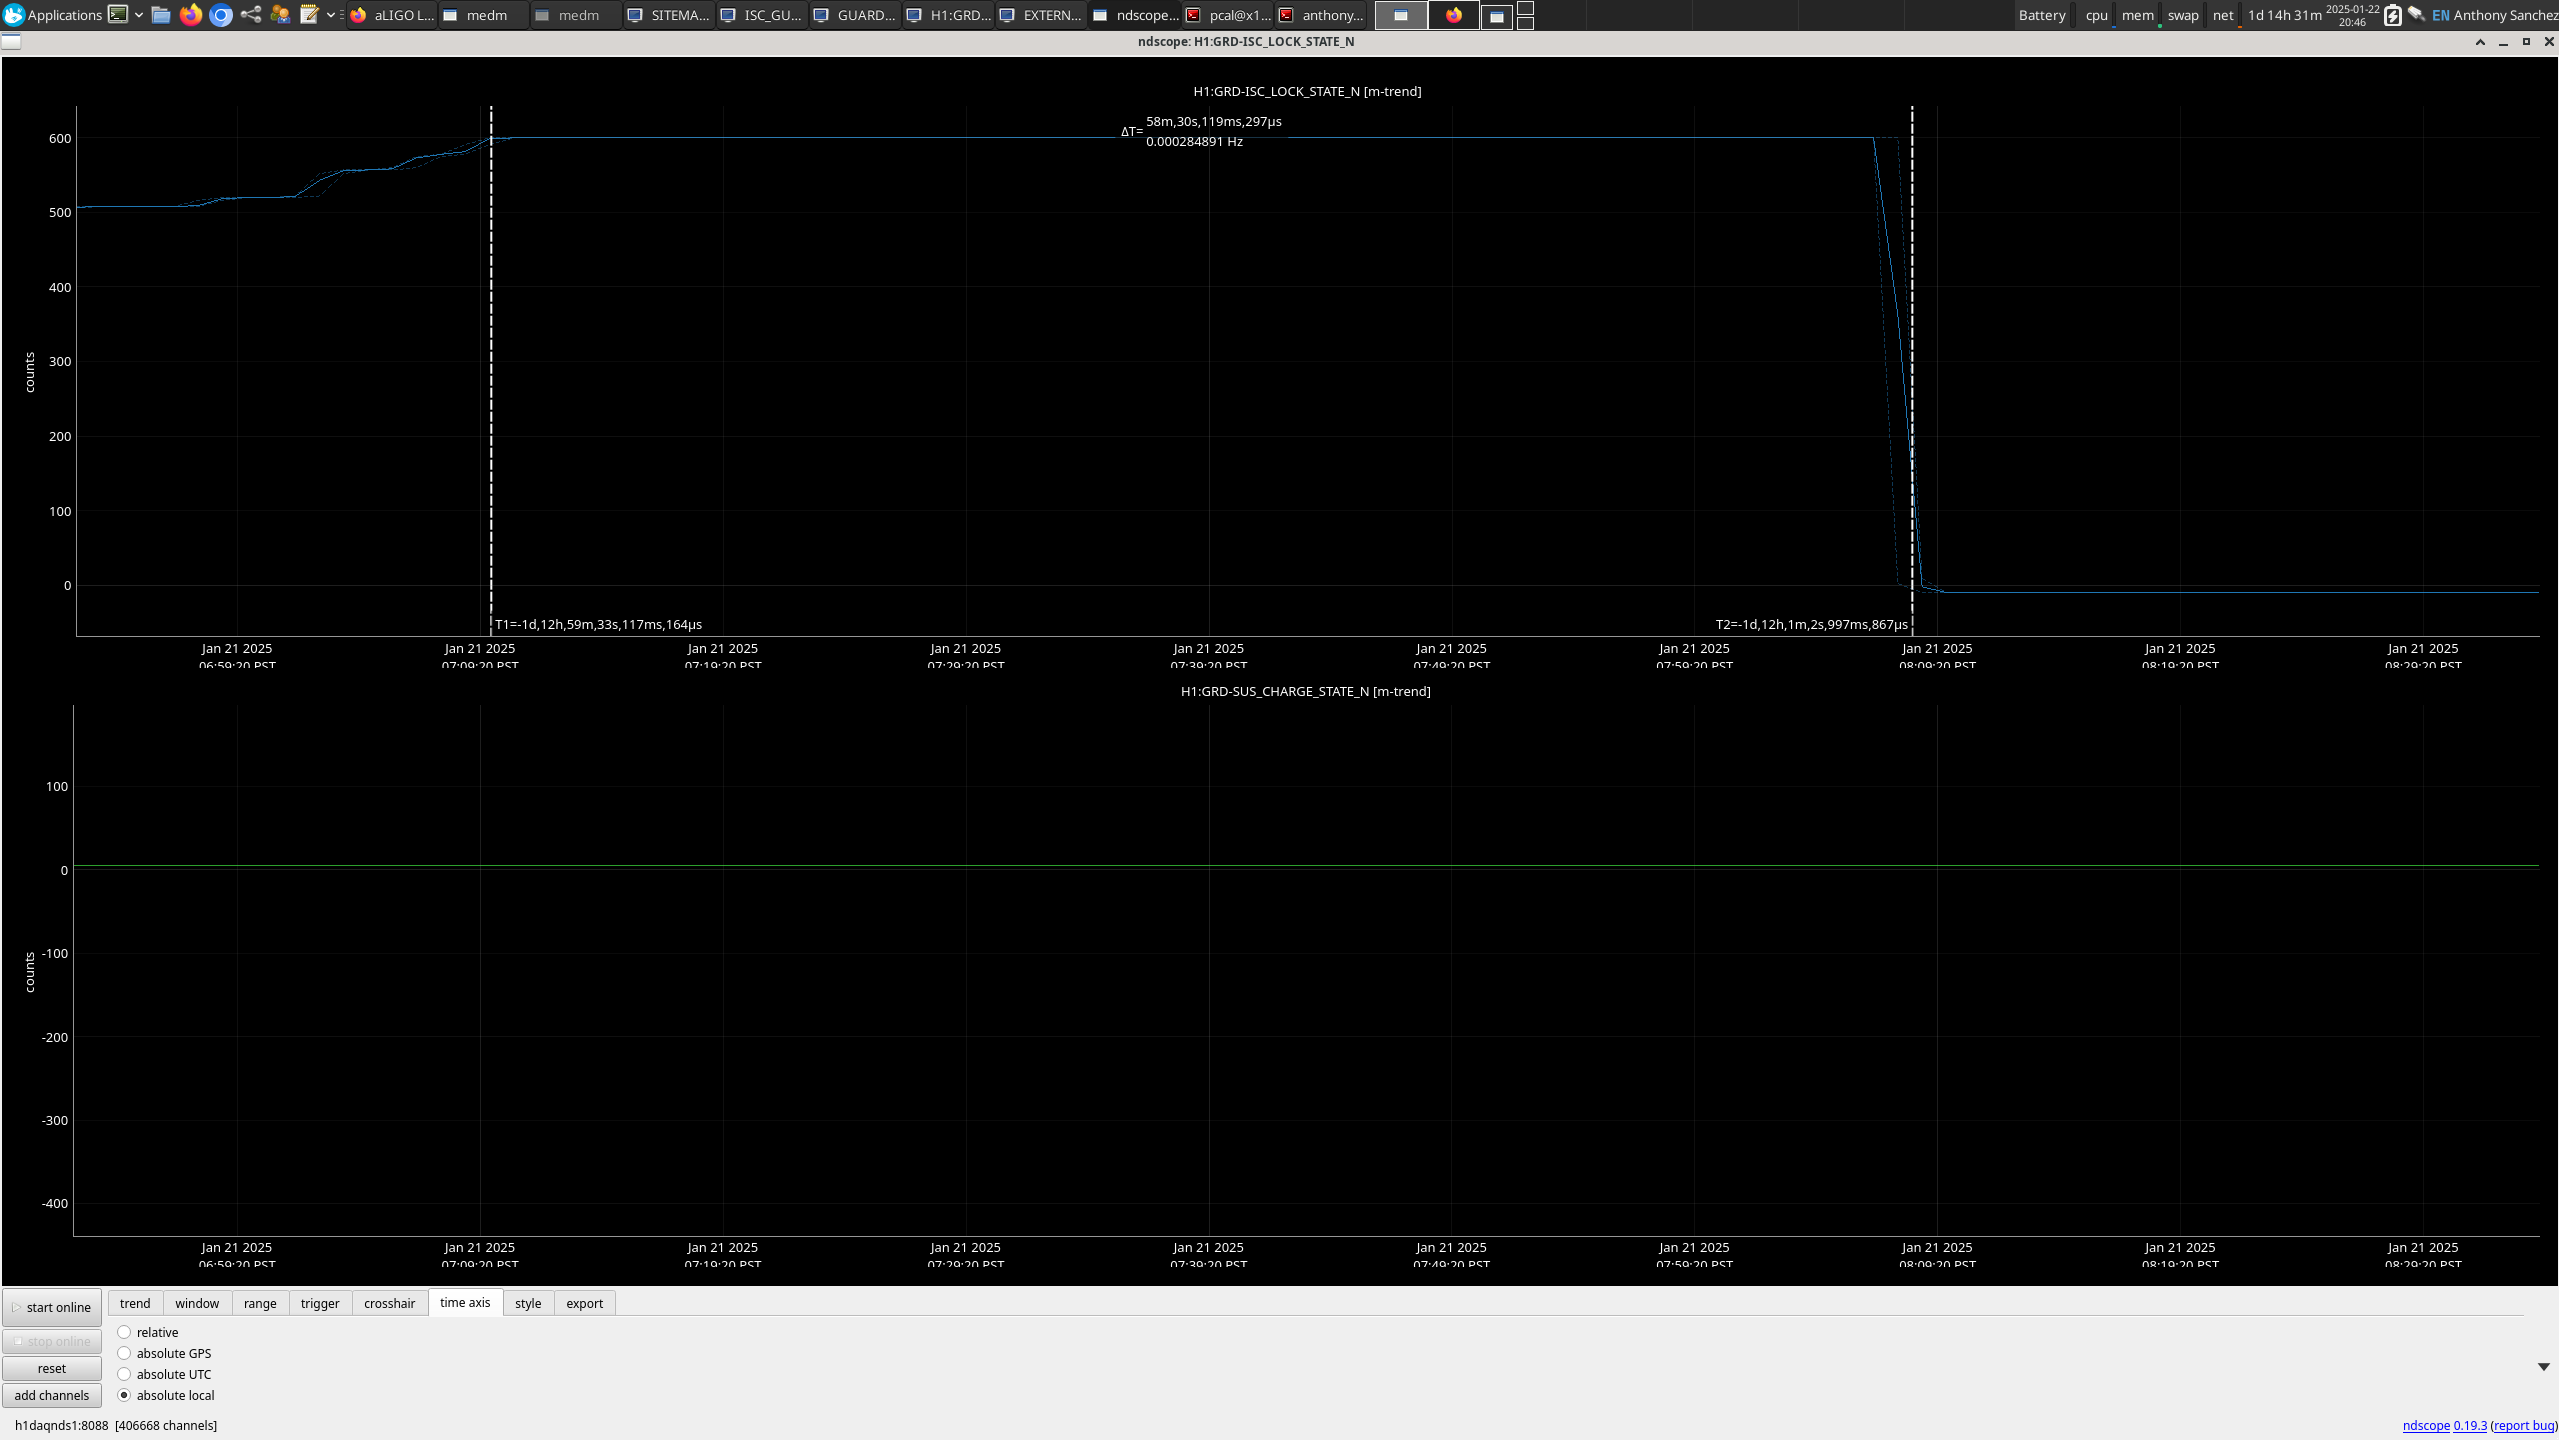
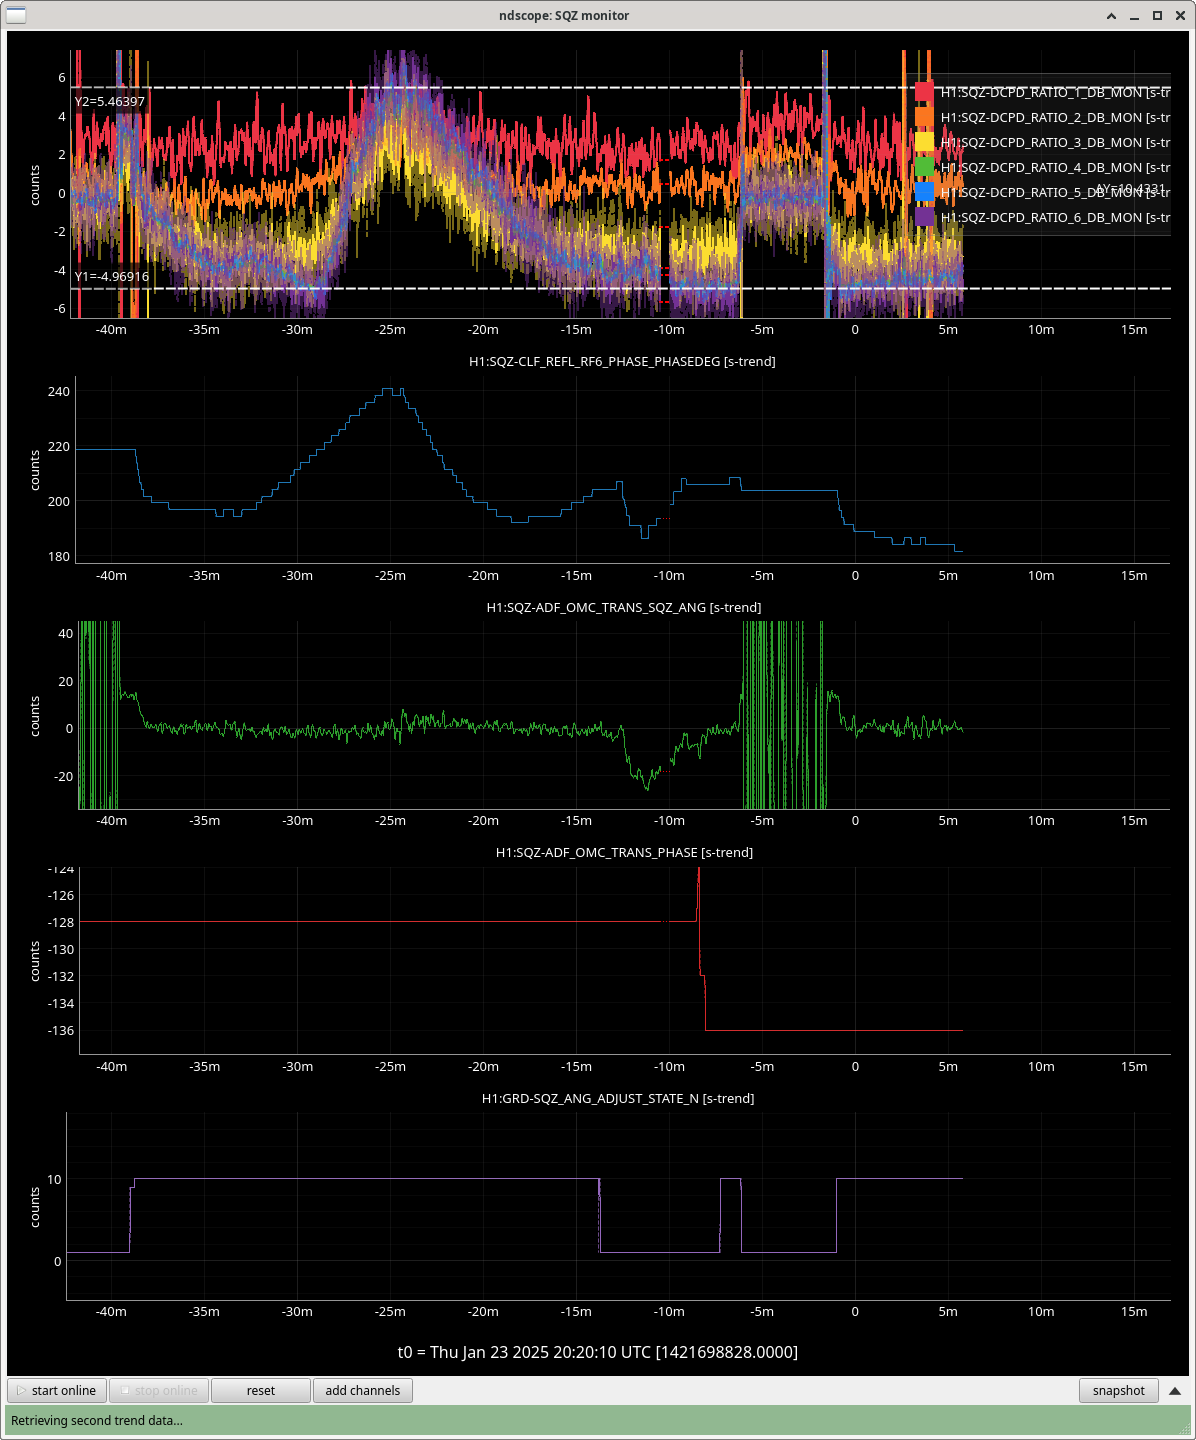
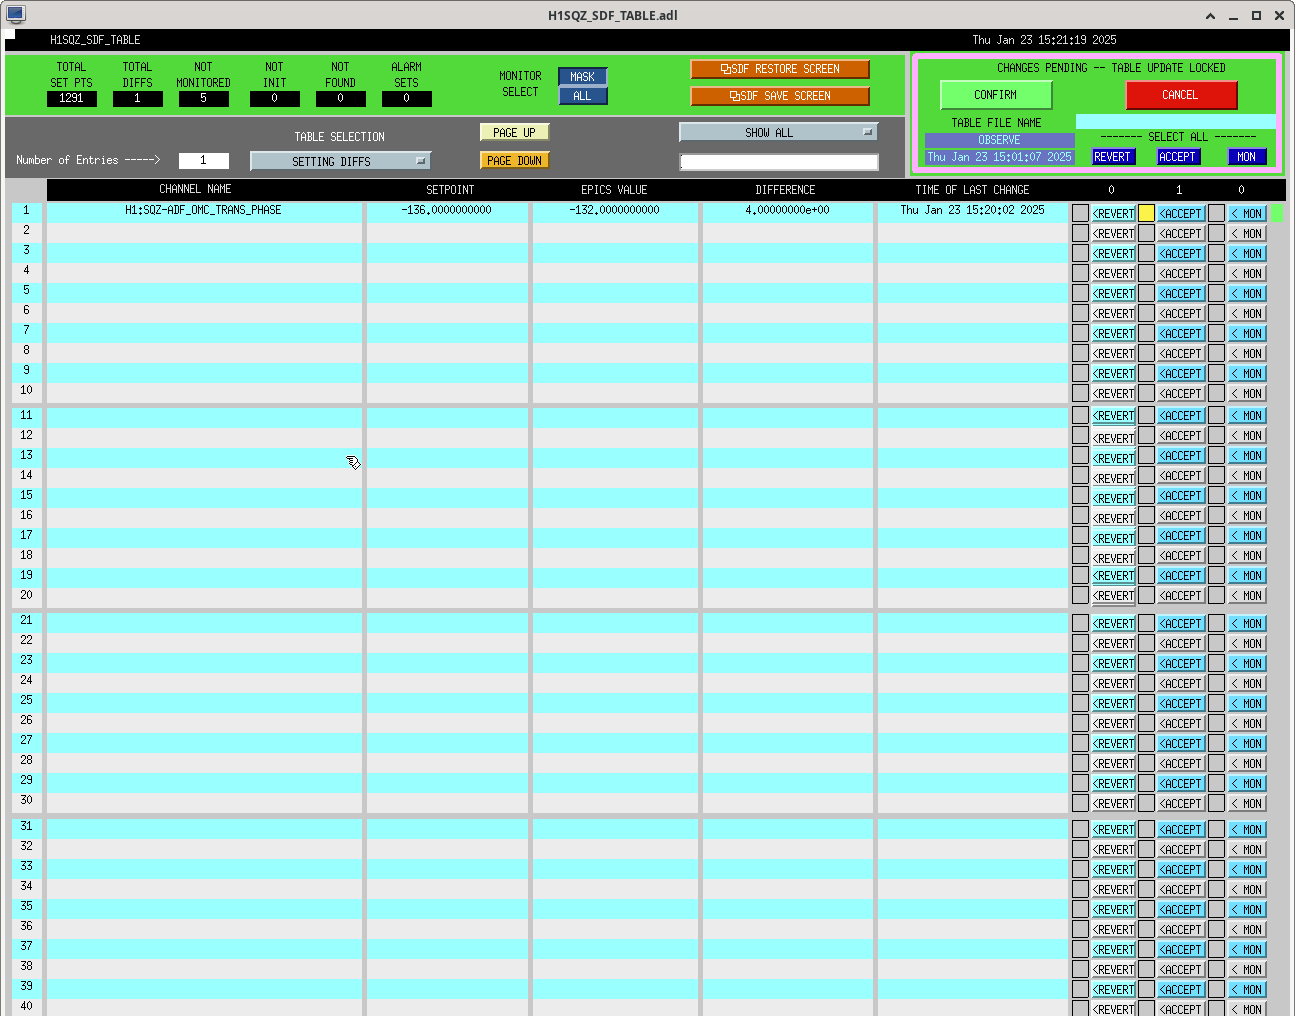
Joe, Fancisco and I got confused about the reverting and changing of the OMC Phase rot changes around this time.
I opened up an ndscope to see what happened.