TITLE: 01/14 Day Shift: 1530-0030 UTC (0730-1630 PST), all times posted in UTC
STATE of H1: Commissioning
OUTGOING OPERATOR: TJ
CURRENT ENVIRONMENT:
SEI_ENV state: USEISM
Wind: 4mph Gusts, 3mph 3min avg
Primary useism: 0.04 μm/s
Secondary useism: 0.45 μm/s
QUICK SUMMARY:
PEM and SUS charge measurements currently being taken. We've been Locked for over 5.5 hours. Today is an 8 hour maintenance day.
Workstations were updated and rebooted. This was an OS packages update. Conda packages were not updated.
TITLE: 01/14 Eve Shift: 0030-0600 UTC (1630-2200 PST), all times posted in UTC
STATE of H1: Observing at 162Mpc
INCOMING OPERATOR: TJ
SHIFT SUMMARY:
IFO is in NLN and OBSERVING as of 04:47 UTC
Smooth shift with one Lockloss caused by the ETMX glitch (alog 82254)
Per Ryan C's instruction from Ryan S, I also adjusted the PSL ISS Ref signal (attached pic) to bring the refracted power above 4.
There was one SDF Diff that I accepted (also attached).
LOG:
None
These should have been the -0.36 and -7.0 values that Jennie found (alog82251). We're reaccepted the new values in the safe.snap and observe.snap.
Lockloss likely caused by the ETMX glitch. EX L2 OUT channel shows erratic movement 170ms pre-lockloss (attached screenshot)
ETM Glitch tag confirming the LL cause on Lockloss Tool.
Bright beam spot on HAM3 ballast mass baffle moves with ITMY compensation plate yaw motion
We have been looking for the source of the scattering noise that varies with the ITMY compensation plate yaw setting (80499). I recently searched for beam spots in the HAM3 area that move as CPY is yawed, using movies that I took from both the MC2 camera viewport and the PR2 camera viewport near HAM2. Anamaria and I had done some of this before (77631) but this time I recorded the CP movements on the audio track of the movies for a more precise correlation. And I also modified the movies in iMovie to increase visibility of faint spots. Figure 1 shows that I did find a spot that moved precisely with CPY Yaw settings (link to movie clips: https://youtu.be/FDdNDPoQadU ). The spot appears to be on a ballast mass baffle (see Fig. 1), which is not angled as much as the scraper baffle (which I think the beam is supposed to fall on (Alena's slides)) and may thus retroreflect more light.
Mystery beam spot on HAM3 spool piece comes from ITMX direction, not HAM2 direction
I had previously misinterpreted the pattern of light on edges and bellows of the HAM3 spool piece as suggesting that the mystery beam spot (78192) was coming from the HAM2 direction . More recently I found that there was light on the HAM3 side of the MC baffle that had a similar interference pattern and was consistent with being part of the mystery beam spot (Figure 1). The light on the HAM3 side of the baffle was visible when looking through the viewport for the PRM camera at a high angle. Thus, the beam is most likely coming from the ITMX direction, travelling close to the –Y wall of the beam tube.
One possibility is that it actually comes from ITMX, either scattered light from ITMX or scattered light from the back side of MC2 reflecting off of ITMX. Figure 3 shows these suggested paths and a picture taken from the point of view of the beamspot on ITMX that shows that there is a clear path to the site of the mystery beam spot. I think that the cartoon shows that it would be worth using a real model to determine if these paths are possible.
I checked to see if the beamspot on the eye baffle moved or modulated when I actuated the compensation plates. I made movies as I moved the two compensation plates more than 600 microradions in pitch and yaw, but, unlike the spot on the ballast mass baffle, I did not see any modulation or motion of the spot on the eye baffle.
Somehow I used the wrong photo in Figure 3 - it is actually a photo from the beamsplitter. The correct photo from CPx is used in the corrected version of Figure 3 attached here.
TITLE: 01/13 Day Shift: 1530-0030 UTC (0730-1630 PST), all times posted in UTC
STATE of H1: Observing at 160Mpc
INCOMING OPERATOR: Ibrahim
SHIFT SUMMARY: The bottom monitor of NUC31 looks pretty dim today, we've also had a standdown query failure on OPS_OVERVIEW. The failure is from the last query being greater than 4 minutes from the current time, the last query was 01/11/25 15:25 UTC. We've been locked for 6 hours, range coherence check yielded.
LOG:
Start Time | System | Name | Location | Lazer_Haz | Task | Time End |
---|---|---|---|---|---|---|
22:08 | OPS | LVEA | LVEA | N | LASER SAFE | 15:07 |
16:09 | FAC | Kim | Optics, PCAL | N | Tech clean | 16:37 |
16:27 | CAL | Francisco | PCAL | LOCAL | PCAL work | 16:39 |
16:43 | FAC | Tyler | Xarm | N | Tumbleweeds check | 17:13 |
17:15 | CAL | Camilla | Optics lab | N | Tidying | 18:41 |
17:58 | FAC | Kim | MidY then X | N | Tech clean | 18:35 |
17:59 | VAC | Janos | MidX | N | Look for a setup, mech room | 18:30 |
18:33 | ISC | Jennie, Sheila | CR | N | A2L measurement | 19:29 |
18:44 | FAC | Kim | MidX | N | Tech clean | 19:29 |
19:08 | ISC | Elenna | Remote | N | SRCL dither meas | 19:29 |
TITLE: 01/14 Eve Shift: 0030-0600 UTC (1630-2200 PST), all times posted in UTC
STATE of H1: Observing at 162Mpc
OUTGOING OPERATOR: Ryan C
CURRENT ENVIRONMENT:
SEI_ENV state: USEISM
Wind: 6mph Gusts, 4mph 3min avg
Primary useism: 0.04 μm/s
Secondary useism: 0.52 μm/s
QUICK SUMMARY:
IFO is in NLN as of 19:20 UTC (5hr 30 min lock)
Sheila, Jennie W
During commissioning window today we measured the P2L and Y2L gains for the PR2 mirror.
This is part of the work to understand how to move the beam on PR2 in order top avoid a reflection and subsquent stray beam off the PR2 scraper baffle (as found in alog #77631 by Annamaria and Robert).
The P2L gain was close to optimised and has been left at -0.36.
The commissioning window ran out before I could finish optimising the Y2L, I have left it at -7.00 which gave better A2L decpupling than the previous value.
Method:
Do this until the line height relative to the background is minimised, allowing time for the ramp and a couple averages each step. One thing to note is that the line height above the background in the PRCL spectrum (LSC-PRCL_OUT_DQ) is much less than the relative height above the background in DARM which suggests that the noise in PRCL is not coupling strongly to DARM.
Switch off the line and set the PIT 9 amplitude to 0 counts.
Then repeat the above for the YAW 9 oscillator channel in the ADS, changing the gain in the Y2L gain filter bank in order to minimise the line height. The reference values for yaw are in the photo linked above with the green line showing DARM (we had gone into NLN cal meas with SRCL FF switched off for Elenna's SRCL tests so that is why DARM shows elevated noise). The orange line is the reference value of PRCL using the nominal Y2L gain. The same amplitude was used in the oscillator for this line but it was much higher above the PRCL background noise than for the pitch degree of freedom.
Template is at /ligo/hom,e/jennifer.wright/git/2025/A2L/20250113_A2L_PR2.xml
While Jennie was optimizing this I noticed that there weren't 30Hz notch filters in PR2s M3 ISCINF bank. As Jenne Driggers noted the last time this was done (alog77855), she wasn't sure if they would be necessary. To check I put some in for P and Y in the FM7 slot and turned them on while coordinating with Jennie. Jennie saw no difference with them on or off so it confirms Jenne D's suspicions. I believe these notches were left on for the remainder of Jennie's optimization.
Since the last report siding, insulation, roofing and doors have all been installed. In addition, a concrete transition between the asphalt and slab was poured as well as a walkway & equipment pad to/near the mandoor. With that, the building construction is complete. Keys were handed over last Thursday 1/9. I have began the process of populating the space with site equipment. Richard and I are making preparations to get basic electrical items ran to the building. T. Guidry
There are not yet any results to report about the SRCL dither arm power measurement, but I have some notes about the attempts to run this measurement over the last few commissioning periods.
This measurement works by using the radiation pressure coupling of SRCL to induce differential radiation pressure in the arms, which depends on a couple factors, one being the arm power. This measurement is made by injecting into the SRCL control signal, and measuring the transfer function of of the relative intensity noise on the transmission QPDs of each arm to DARM.
Measurement requirements:
However, I once caused a lockloss running Craig's measurement templates, so I wanted to be sure that I could drive hard enough to get the required coherence, but not break the lock.
Last week, I ran a couple of test measurements with the SRCL feedforward off, and the TMS QPDs as well centered as possible. I have a screenshot of the results below. You can see that the DARM/SRCL coherence is very good, but the DARM/TMS QPD coherence is very bad. This is true for the NSUM channels as well as the individual segments. When I tried to drive harder, I would get ETMX saturation warnings. The signal appears almost four orders of magnitude above the noise in DARM and about one order of magnitude above the noise in the TMS QPDs.
The centering loops we use center onto QPD B of both arms, but cause the beam to be off center on QPD A in both arms. However, the coherence is equally low on both the A and B QPDs, so I don't think the centering is the issue. Craig and I previously tried centering onto the A QPDs, but then you become miscentered on B, and also cause other problems, see 67066.
Today, I instead drove single lines using awggui. I was able to achieve >0.9 coherence at three different frequencies without causing any saturations anywhere, at about 70 Hz, 49 Hz and 34 Hz. Good coherence was observed with both the NSUM channels and the individual segments of the TMS QPDs. I also confirmed that we see the expected differential phase in the signal between the X and Y arm.
We were not thermalized today, so I plan to rerun this measurement on Thursday using these three points. This should be sufficient information to measure the arm power, and also confirm that we observe the predicted 1/f^2 coupling. I can also use the regularly scheduled Thursday calibration measurements to make sure we know the CAL DELTA L calibration.
19:44 UTC we wrapped up commissioning which started late due (~18:30 UTC) to not being locked. I had to accept/revert some SDFs to get back to observing, ASC, PR2, and OMC.
The OMC chans have been unmonitored at Jeffs behest.
Mon Jan 13 10:11:32 2025 INFO: Fill completed in 11min 28secs
Jordan confirmed a good fill curbside. TCmins [-86C, -84C] OAT (0C, 32F)
FAMIS 31068
PMC REFL continues to rise. Since I didn't get a chance to bump up the ISS diffracted power last week and it's continued to fall, I'll adjust that opportunistically this week between lock stretches.
Alerted by H1_MANAGER that it needed intervention. There was a large earthquake coming through that had tripped the ISIs for the ITMs and ETMs. Also, ETMY stages M0 and R0 had tripped (not yet sure if that is just due to the ISI tripping).
There was also a notification on verbals from 08:51UTC, a minute after everything tripped, that says "ETMY hardware watchdog trip imminent", but when I checked the hardware watchdog screen everything looked normal with no countdowns. Once it looked like the worst of the earthquake had passed and the ISI values were all within range, I reset R0 and M0 for ETMY and reset all four ISI watchdogs. We are still in LARGE_EQ mode so we haven't started relocking yet, but it looks like we are close to leaving and we should be good to go for relocking.
It looks like ETMY M0 and R0 tripped due to barely going over the watchdog limit, and that it was due to the ISI stages tripping (ndscope). Similar to what I did in 81668, I'll up the thresholds for M0 and R0 by a bit. Thankfully it looks like the thresholds we established for the other stages were all good guesses and are still good.
Stage | Original WD threshold | Max BLRMS reached after lockloss | New WD threshold |
M0 | 100 | 106 | 150 |
R0 | 120 | 122 | 175 |
L1 | 170 | 134 | 170 (unchanged) |
L2 | 270 | 168 | 270 (unchanged) |
Unknown cause lockloss but reasonable to assume it was either microseism or squeeze related (though I'm unsure if SQZ can cause a LL like that).
The lockloss happened as I was adjusting the SQZ OPO temperature since in the last hour, there has been a steady decline in H1:SQZ-CLF_REFL_RF6_ABS_OUTPUT channel. After noticing this, I went out of OBSERVING and into CORRECTIVE MAINTENANCE to fix. It was actually working (the channel signal was getting higher with each tap when the LL happened. This coincided with a 5.2 EQ in Ethiopia, which I do not think was the cause but may have moved things while in this high microseim state. I've attached the trends from SQZ overview and OPO temp including the improvements made. If it is possible to induce a LL changing the OPO temp, then this is likely what happened, though the LL did not happen when the temp was being adjusted, as the 3rd screenshot shows.
Seems that the microseism, the earthquake and SQZ issues also coincided with some 34mph gusts so I will conclude that it was mostly environmental.
Short update on locking: After very slow initial alignment, locking took some time to get through DRMI but managed after going to PRMI (and losing lock due to BS in between). We are now sitting at DARM_OFFSET but signals are not converged after 10 minutes due to a passing 5.0 from guatemala (that I beleive we will survive.
As Ibrahim said, the OPO temp adjustment would not cause a lockloss.
However we can see a this Friday time and two days before, the SQZ angle servo and ASC seem to get into a strange ~13minute oscillation when the OPO temperature is bad and the SQZ angle is around 220deg. See attached plots. We are not sure why this is. Now we are a week from the OPO crystal move 82134, the OPO temperature is becoming more stable but will still need adjusting for the next ~week.
Jeff K, Oli P
In alog 75947 part3, we had modeled the BBSS using what we thought were the correct Final Design parameters and then adjusted the d1 and d4 values* in order to get our model to match how the actual BBSS was responding. However, the parameter set we were using had the boolean variable stage2** set to 0, when the parameter set from the BBSS Final Design document(T2000503) had stage2 = 1. This was a change that I had made due to a misinterpretation.
Because of this mistake, the parameters that we had thought were correct were actually wrong, and so when we adjusted d1 and d4, we were unknowingly fitting to an incorrect model. These results were shared with the SUS group, where it was mentioned that stage2 was supposed to be 1.
We've now rerun the model with the actually correct Final Design(FD) parameters, and have adjusted d1 and d4 to fit our data. This adjustment has d1 = FD - 2.5mm and d4 = FD - 1.0mm, which are smaller changes than when we were using the wrong parameter set (d1 and d4 were increased by 5.0mm and 1.5mm respectively). Attached are our results in pdf form, along with pngs of the transfer functions for Pitch and Longitude, since those are the two most affected by the changes to d1 and d4. This adjusted parameter set can currently be found at $sussvn/Common/MatlabTools/TripleModel_Production/bbssopt_pendstage2on_d1minus2p5mm_d4minus1p0mm.m, but eventually will replace the bbssopt.m that is in that same directory.
Figure legend:
- Black - Model using the wrong Final Design parameters
- Dark blue - Model using the wrong Final Design parameters plus adjustments for d1 & d4 to match data
- Dark green - Model using the correct Final Design parameters
- Light Green - Model using the correct Final Design parameters plus adjustments for d1 & d4 to match data
- Gray - BBSS M1 Transfer Function data
Appendix:
* d{top, 0, 1, 2, 3, 4} is the vertical distance between the break off point of a wire and the CoM for each mass. These values are important for calculating the locations of fundamental modes for each DOF. There are two different types of d's, effective d's and physical d's.
- The physical d's are the vertical distance between the break-off point of the wire and the CoM of the mass. These values assume an infinitely flexible wire, which isn't the case in real life.
- The effective d's are the vertical distance between where the wire leaves the clamp and the CoM. Since the wires aren't actually infinitely flexible, they'll start bending before they reach the break off point, meaning we'll have a larger effective d as compared to the physical d.
These two relate to each other as physical d = effective d - effective flexure point, with the effective flexture point being the extra distance between the clamps and the breakoff point.
In the building of the suspension model, both types are used at different times, so there is a need to be able to swap between them. That's what the stage2** variable is used for.
** stage2 is a boolean variable that determines whether the effective(stage2 = 0) or physical(stage2 = 1) d's are used.
- If stage2 = 0, the d values are used as effective values, and there are no corrections made to account for the flex of the wires.
- If stage2 = 1, the d values are taken to be the physical values, and so an effective flexture point is calculated and added to account for the flexing of the wires.
Since we entered in the physical d's, me changing stage2 to 0 meant that the model wasn't adding in the effective flexture point distances, changing our results.
Verification that the d4 value is correct: 82138
I. Abouelfettouh, J. Kissel, O. Patane, B. Weaver Executive Summary: The first article BBSS transfer functions look great. Though there is some confusion about the M1 P 2 P modeled transfer functions drastically disagreeing with the measured TFs, there is a consistent story between - the adjustments to the mechanics that were made during construction and - deviations from the "production" model parameter set that could re-create those construction adjustments. Further discussion will be had with the assembly / design team as to the future course of action. Kissel suggests that -- even as the first article stands now -- the resulting measured transfer functions with the mechanical adjustments would/should happily meet A+ O5 requirements. %%%%%%%%%%% Begin kLOG (You missed these...) %%%%%%%%%%%%%% I got a debrief yesterday from Betsy, Oli, and Ibrahim of the comparison between - measured transfer function results from the first article construction and - what had been deemed the production model parameter set for the BBSS, i.e. what's discussed in LHO:75787. The existing "production" model parameter set starts from Mark's update to the BBSS parameter set post-final-design after adjusting for the production wire thicknesses (see TripleLite2_mark.barton_20211212bbss_production_triplep.m, changed at rev 11625, circa Sep 2023). Oli successfully copied over to the usual matlab formating to create bbssopt.m (created at rev 11734, circa Jan 2024). At the start of the debrief, there were (only!!) 3 outstanding issues / questions they had: (1) The overall magnitude scale for all DOFS for all measured transfer functions was a consistent factor of ~3.15x more than the model estimates, (2) After browsing through the EULER-basis drive to OSEM-basis response plots, and some of the off-diagonal EULER-basis showed little-to-no coherence, and 
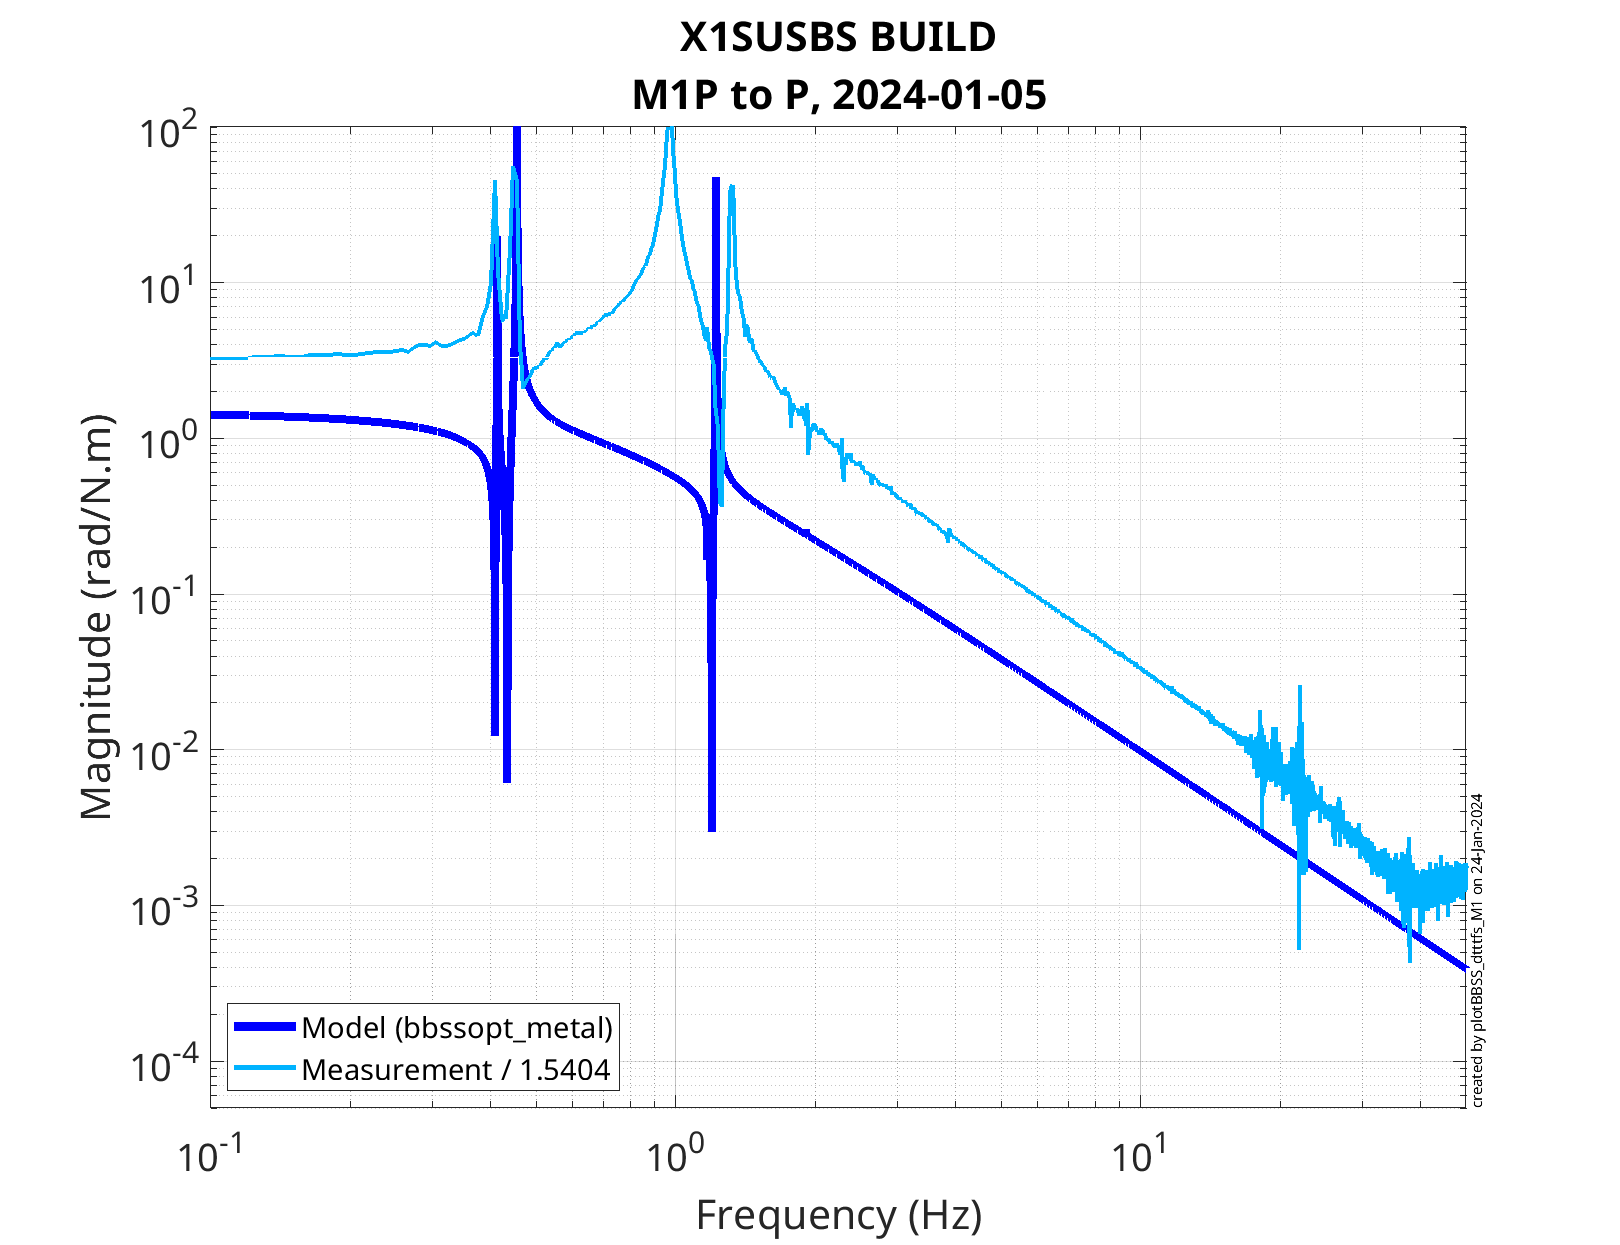
(3) The measured M1 Pitch to Pitch transfer function's frequency response was significantly different than the model. For (1), this is typically a sign of a mis-calibration of the data. We reviewed the calibration of the measured data from the processing script, plotBBSS_dtttfs_M1.m, created by Oli and Ibrahim in Nov 2023. The DTT templates that measure the transfer function use the pre-calibrated output of the sensors for response channels i.e. the channels come in units of microns and microradians, so they only need a factor of 1e-6 [meters / micrometers]. The only substantial thing that needs calibrated into physical units during post-processing is the excitation. The review of the calibration of the exciation revealed nothing suspicious in the script based on our current expected knowledge of chain - the test stand electronics (an 18-bit DAC = 20 / 2^18 [V/ct]), - BBSS coil driver (a TTOP coil driver, coupled with a BOSEM coil = 11.9 [mA/V]), - 10x10 magnet strength (1.694 [N/A]). - (lever arms and numbers of actuators are pre-calibrated out via the EUL2OSEM matrix, generated by make_susbbss_projections..m, and installed in EPICs) The above factors result in an overall calibration of 1 / 1.5405 [(m/N) / (um/DAC ct) or (rad/N.m) / [urad/DAC ct]] that's displayed in the legend of each of the plots from LHO:75787. In the end, we were more interested in understanding (2) and (3) rather than getting to the bottom of the calibration. Further, the test stand is some old, pre-aLIGO concoction whose records and modifications are unclear. So we figure we just move on, accepting that we need to fudge the data by the extra factor of 3.15x. We'll get serious about figuring it out if there's still such a discrepancy after moving the BBSS over to the production H1 system. For (2), all concerns can we waived off with expectations. (a) The first plot of concern was the P to F1F2F3 plot (page 17 of 2024-01-05_1000_X1SUSBS_M1_ALL_TFs.pdf), in that the magnitude of the F2 and F3 TFs were low and/or noisy. This is expected because F2 and F3 OSEMs are along the (center of mass / axis of pitch rotation) of the BBSS's top mass. So they see no pitch by construction (for better or worse). (b) The second collection of plots of concern were the off-diagonal DOFs, (i) showing noise and/or (ii) the opposite -- showing well-resolved cross-coupling in DOFs that we *don't* want cross-coupled. We shouldn't be mad about (i) -- e.g. page 7 showing incoherence between L response to V drive and V response to L drive. What power is resolved in those transfer functions -- typically on/around resonances -- is because the TFs were taken undamped an in air. So there's just a ton of movement that an FFT might / cross-correlation might *think* is coherent with the drive, but it's really not. We looked closer at any of the off-diagonal TFs that *were* resolved, (ii) -- e.g. page 9 showing well-resolved cross-coupling between R response to V drive and V response to R drive. In each of these TFs, we found that the magnitude of the cross-coupling, off-diagonal TF was less, if-not-MUCH less that the on-diagonal TF, which is good. Where it was close, it sort-of "is what it is." Little attention has been typically paid to mitigating the off-diagonal transfer functions during the design phase of LIGO suspensions to-date. Further, they often are a result of the unique construction of each individual instantiation of the suspension type. There's no much we can do about it post construction, and what we *do* do if it proves problematic to the detector, is dance around the problem with fancy controls techniques if needed. 
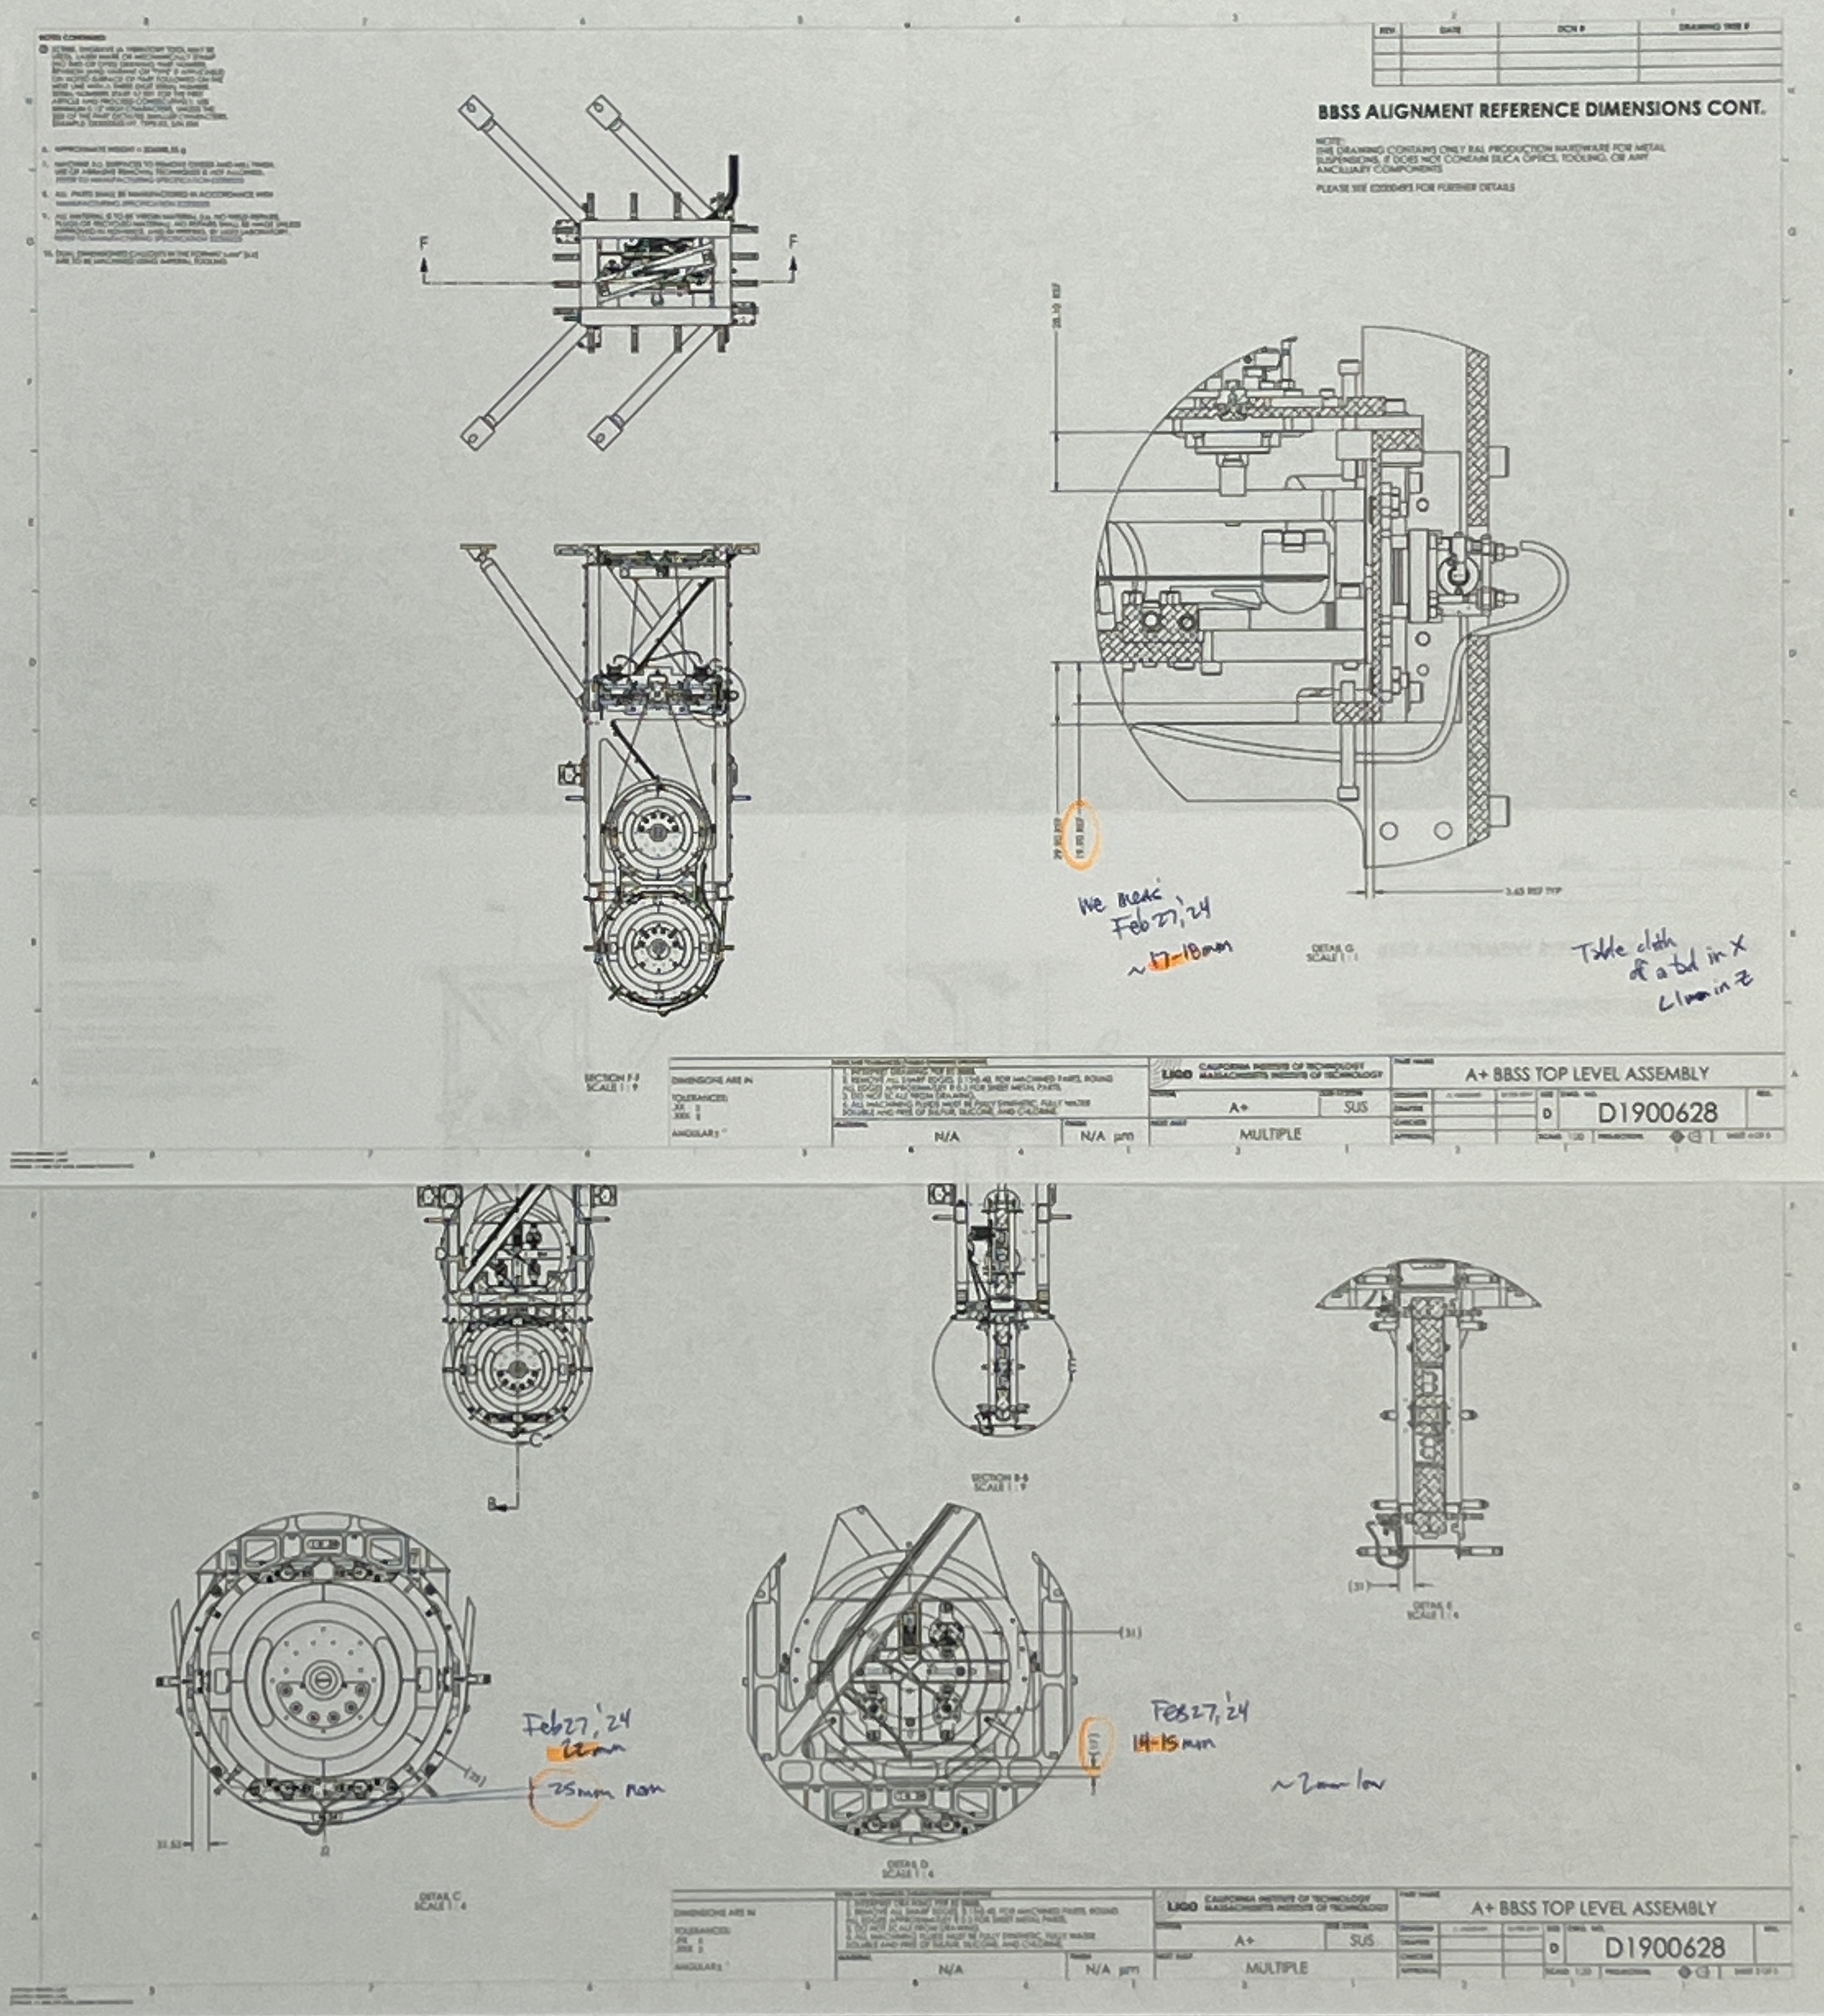
For (3), we arrive at the meat of this aLOG :: The *model* of the M1 Pitch to Pitch transfer function looked very weird to me. Betsy mentions the during the construction of the first article they 
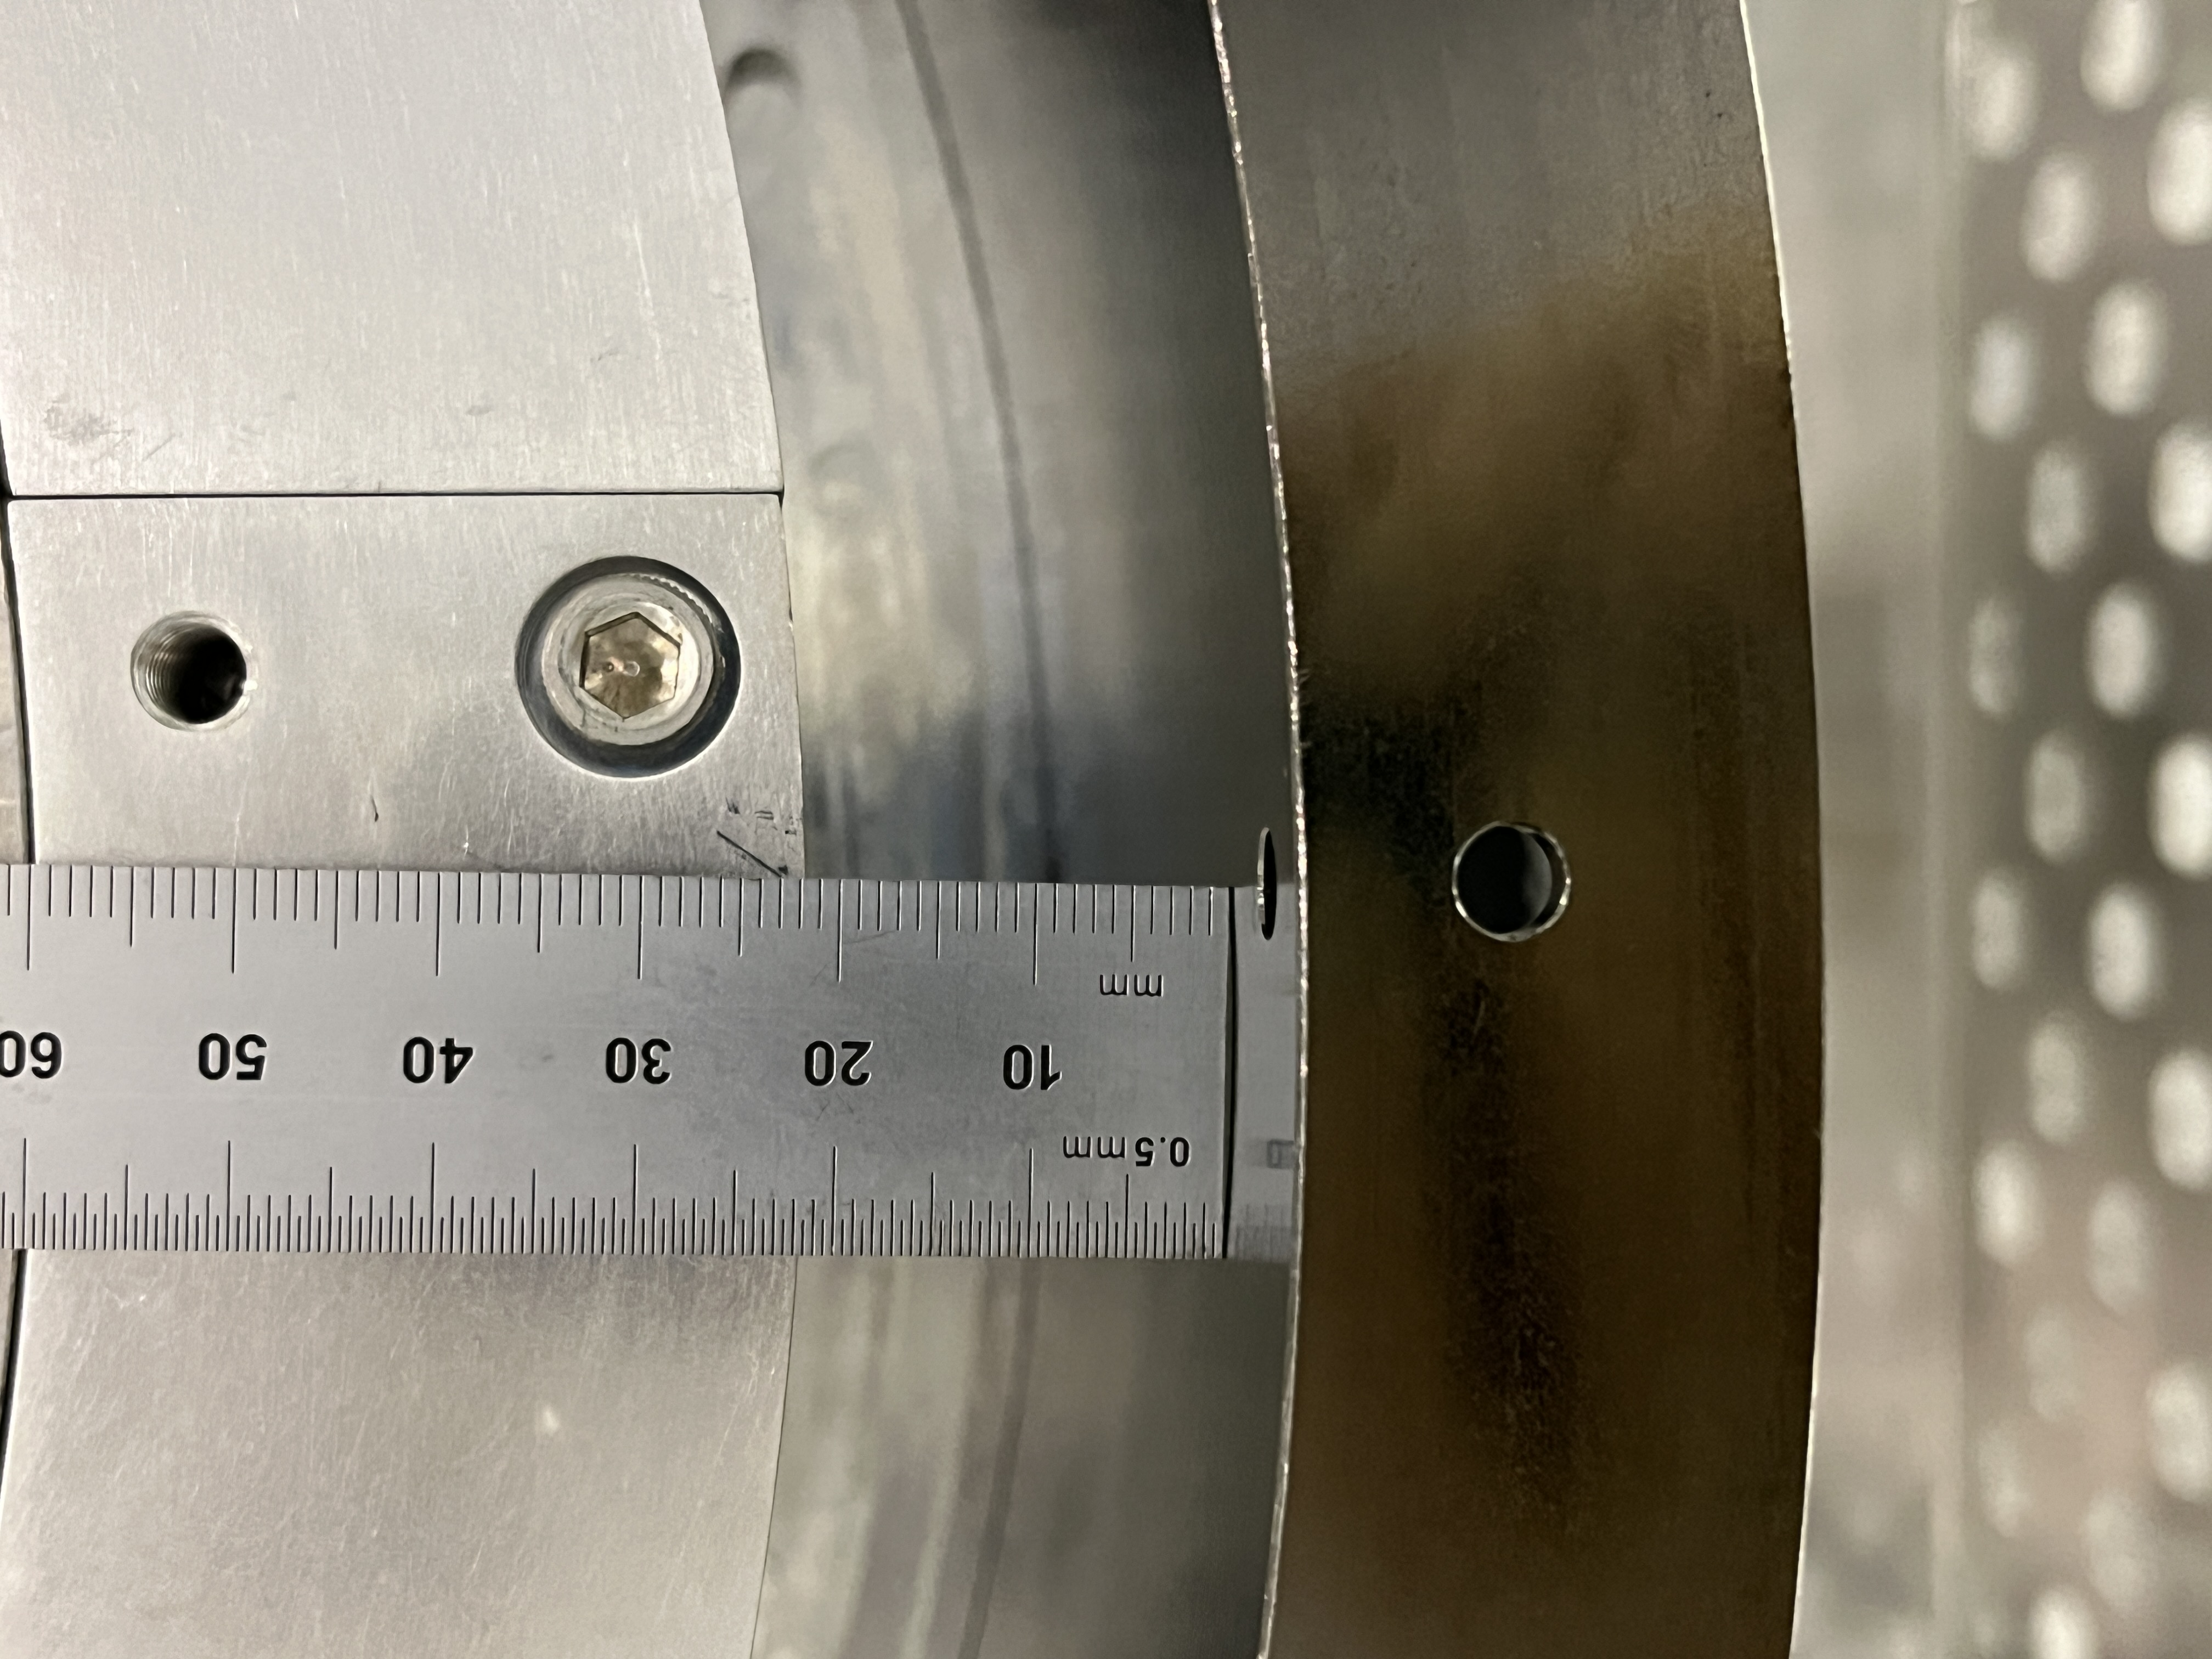
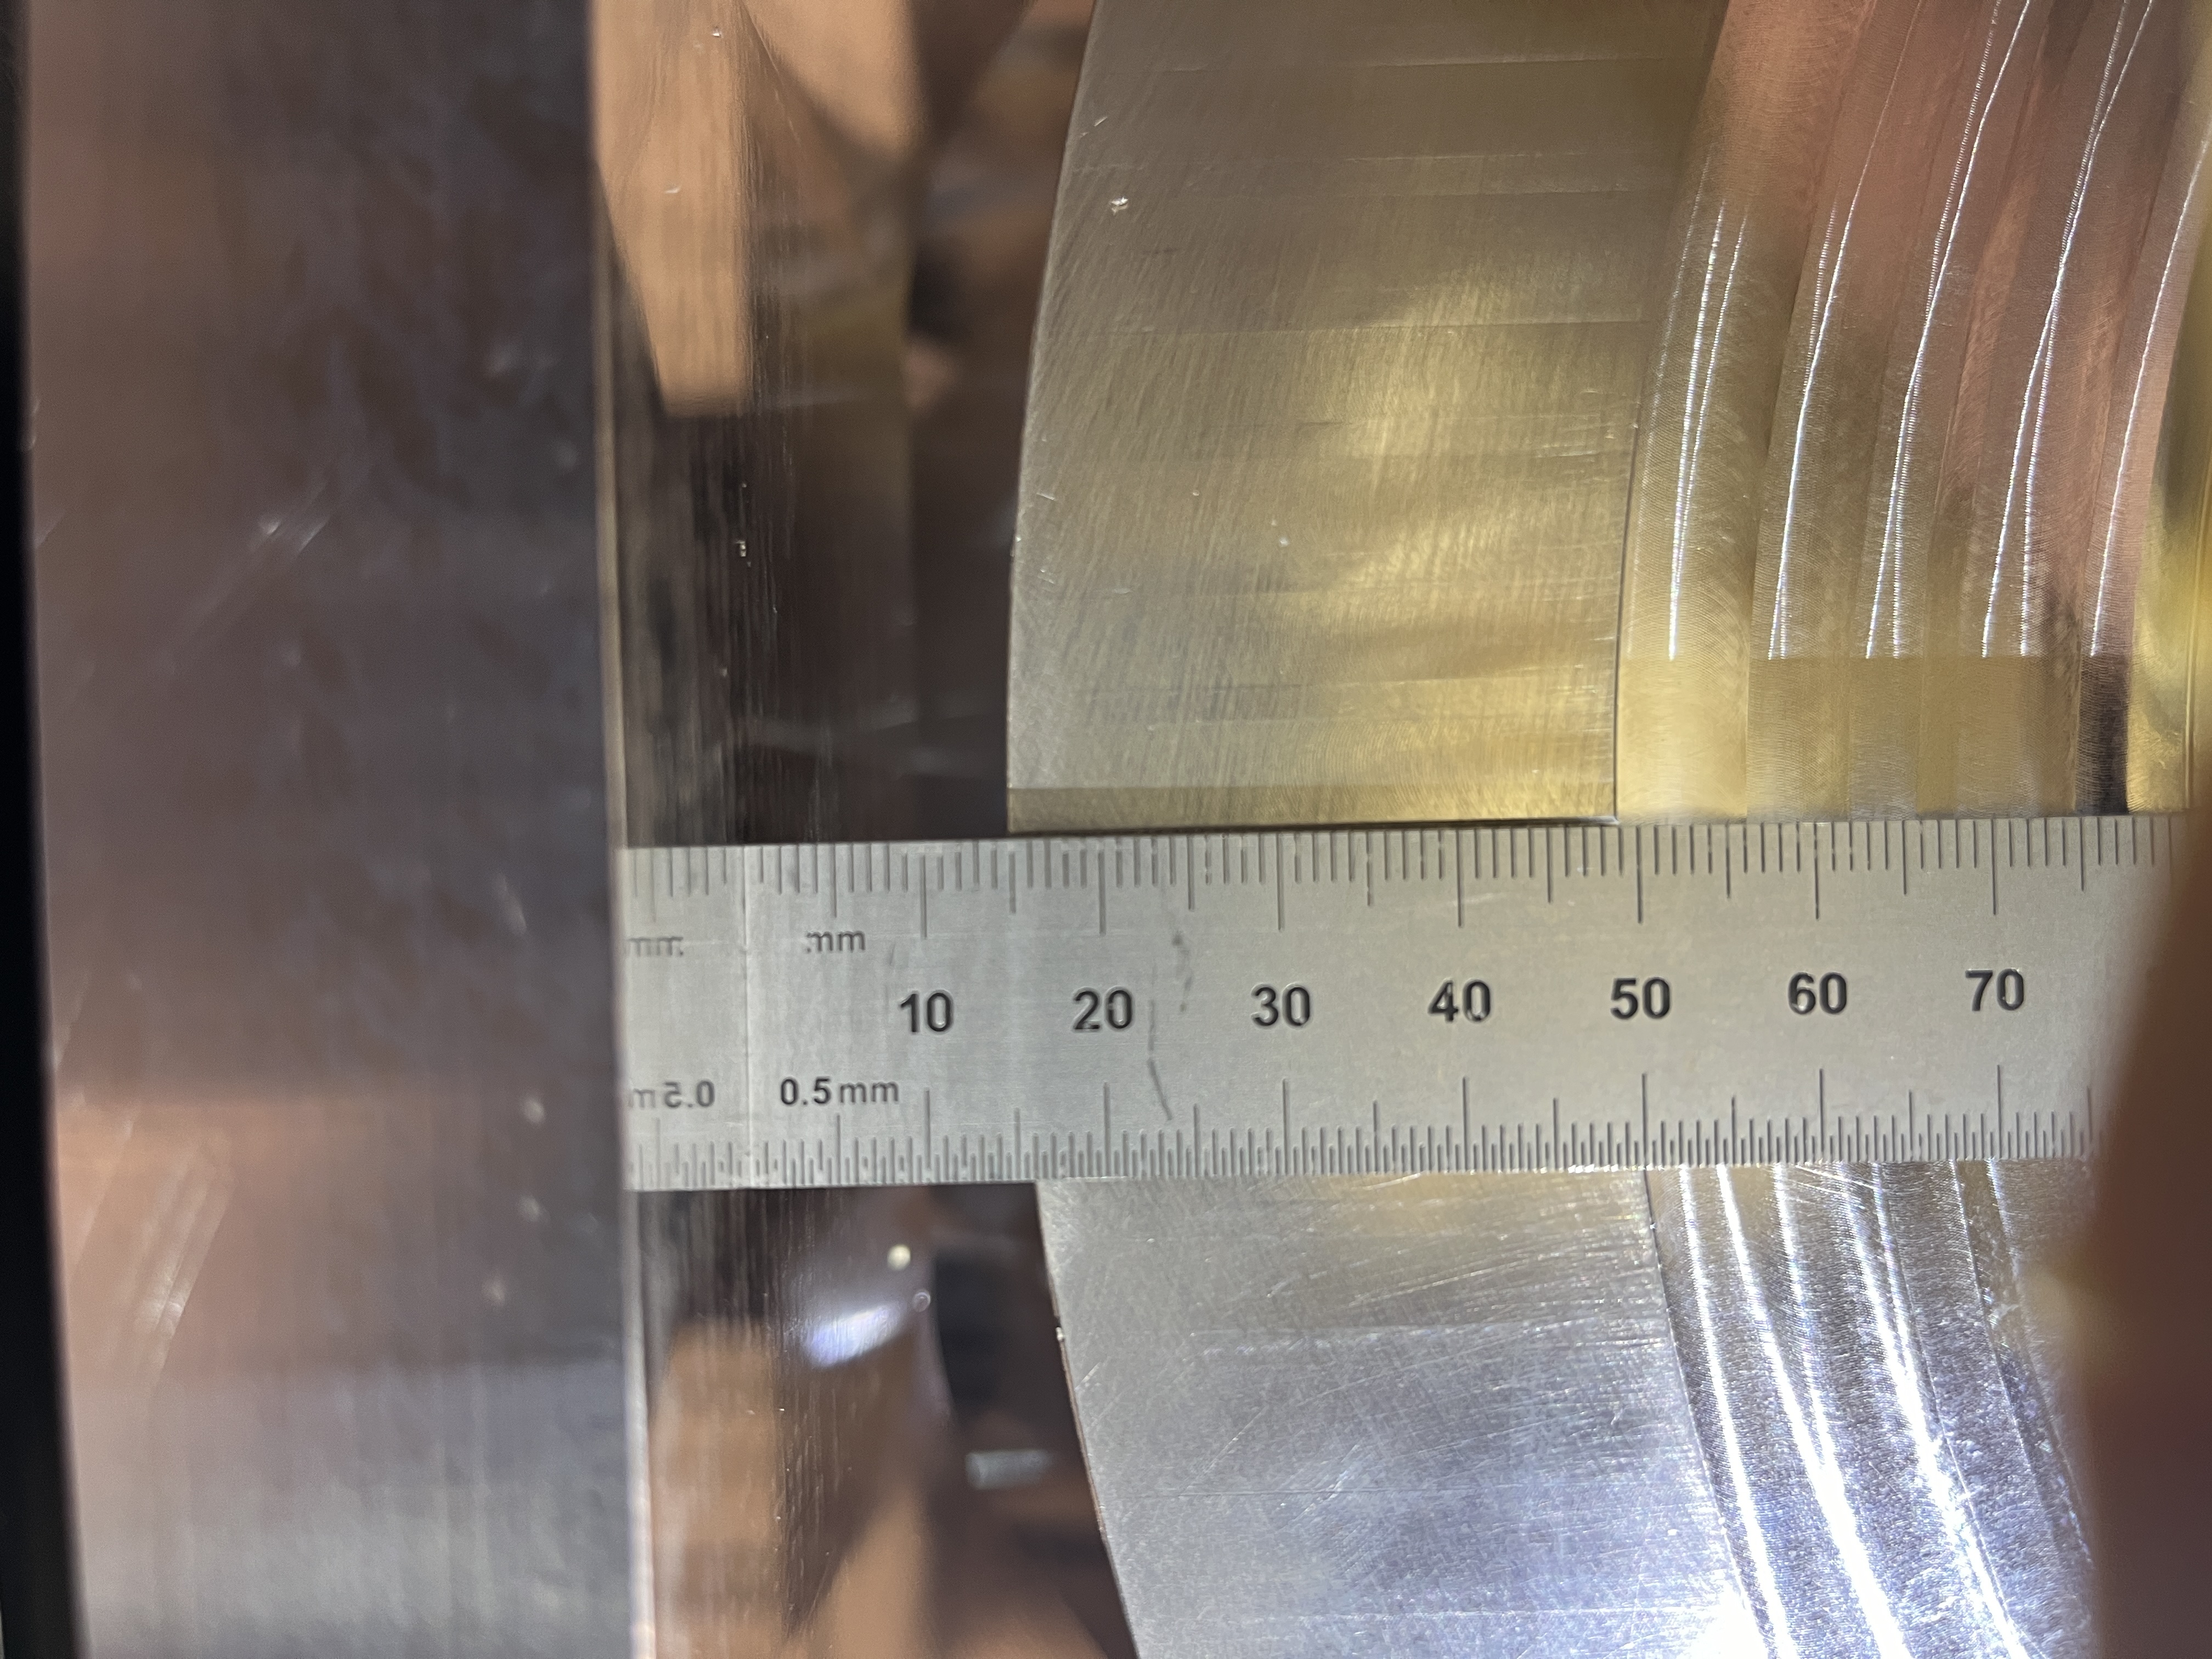
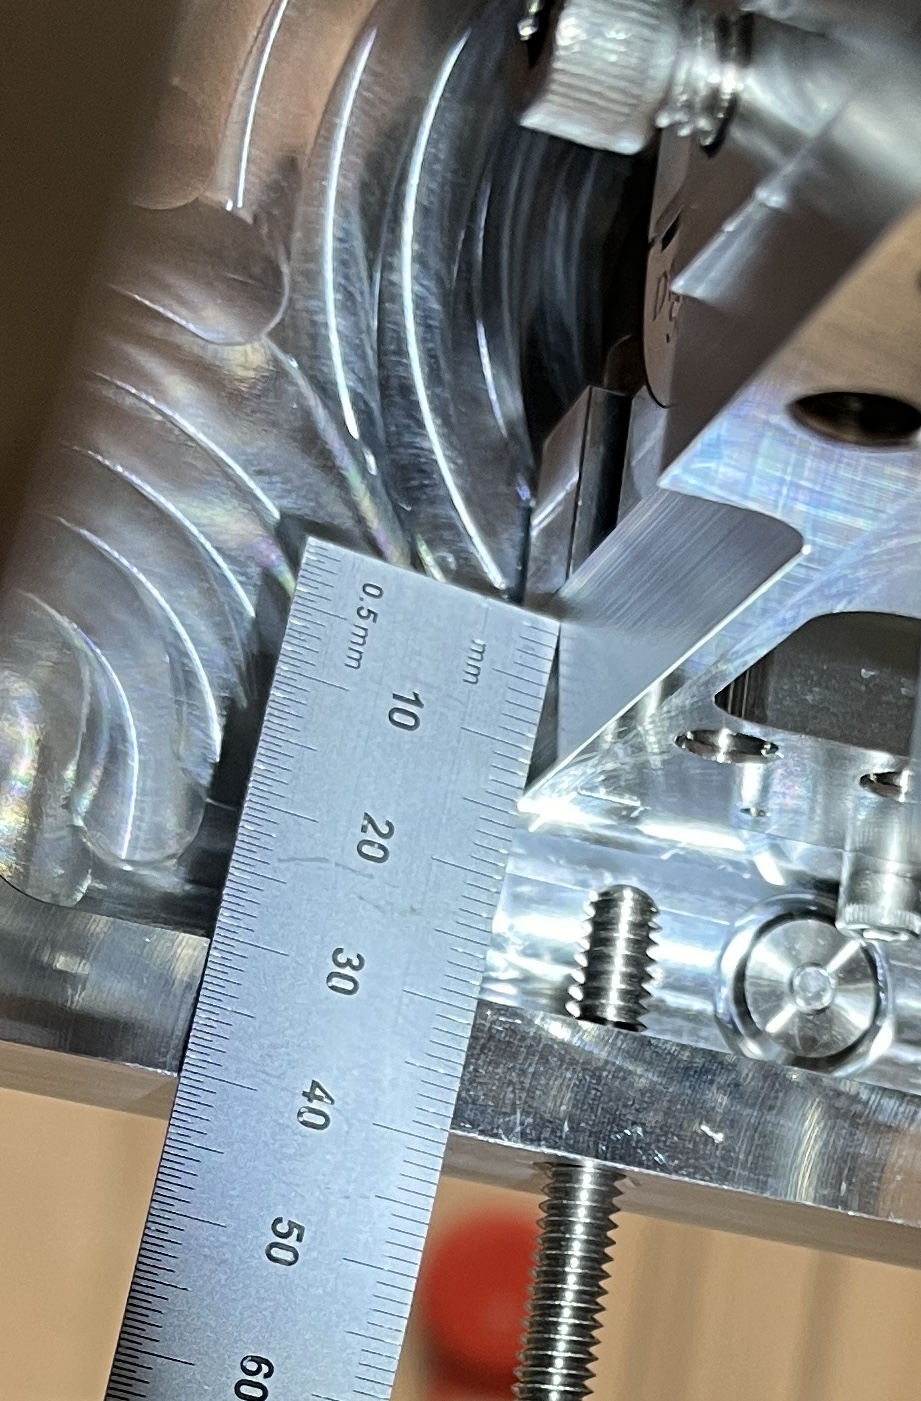
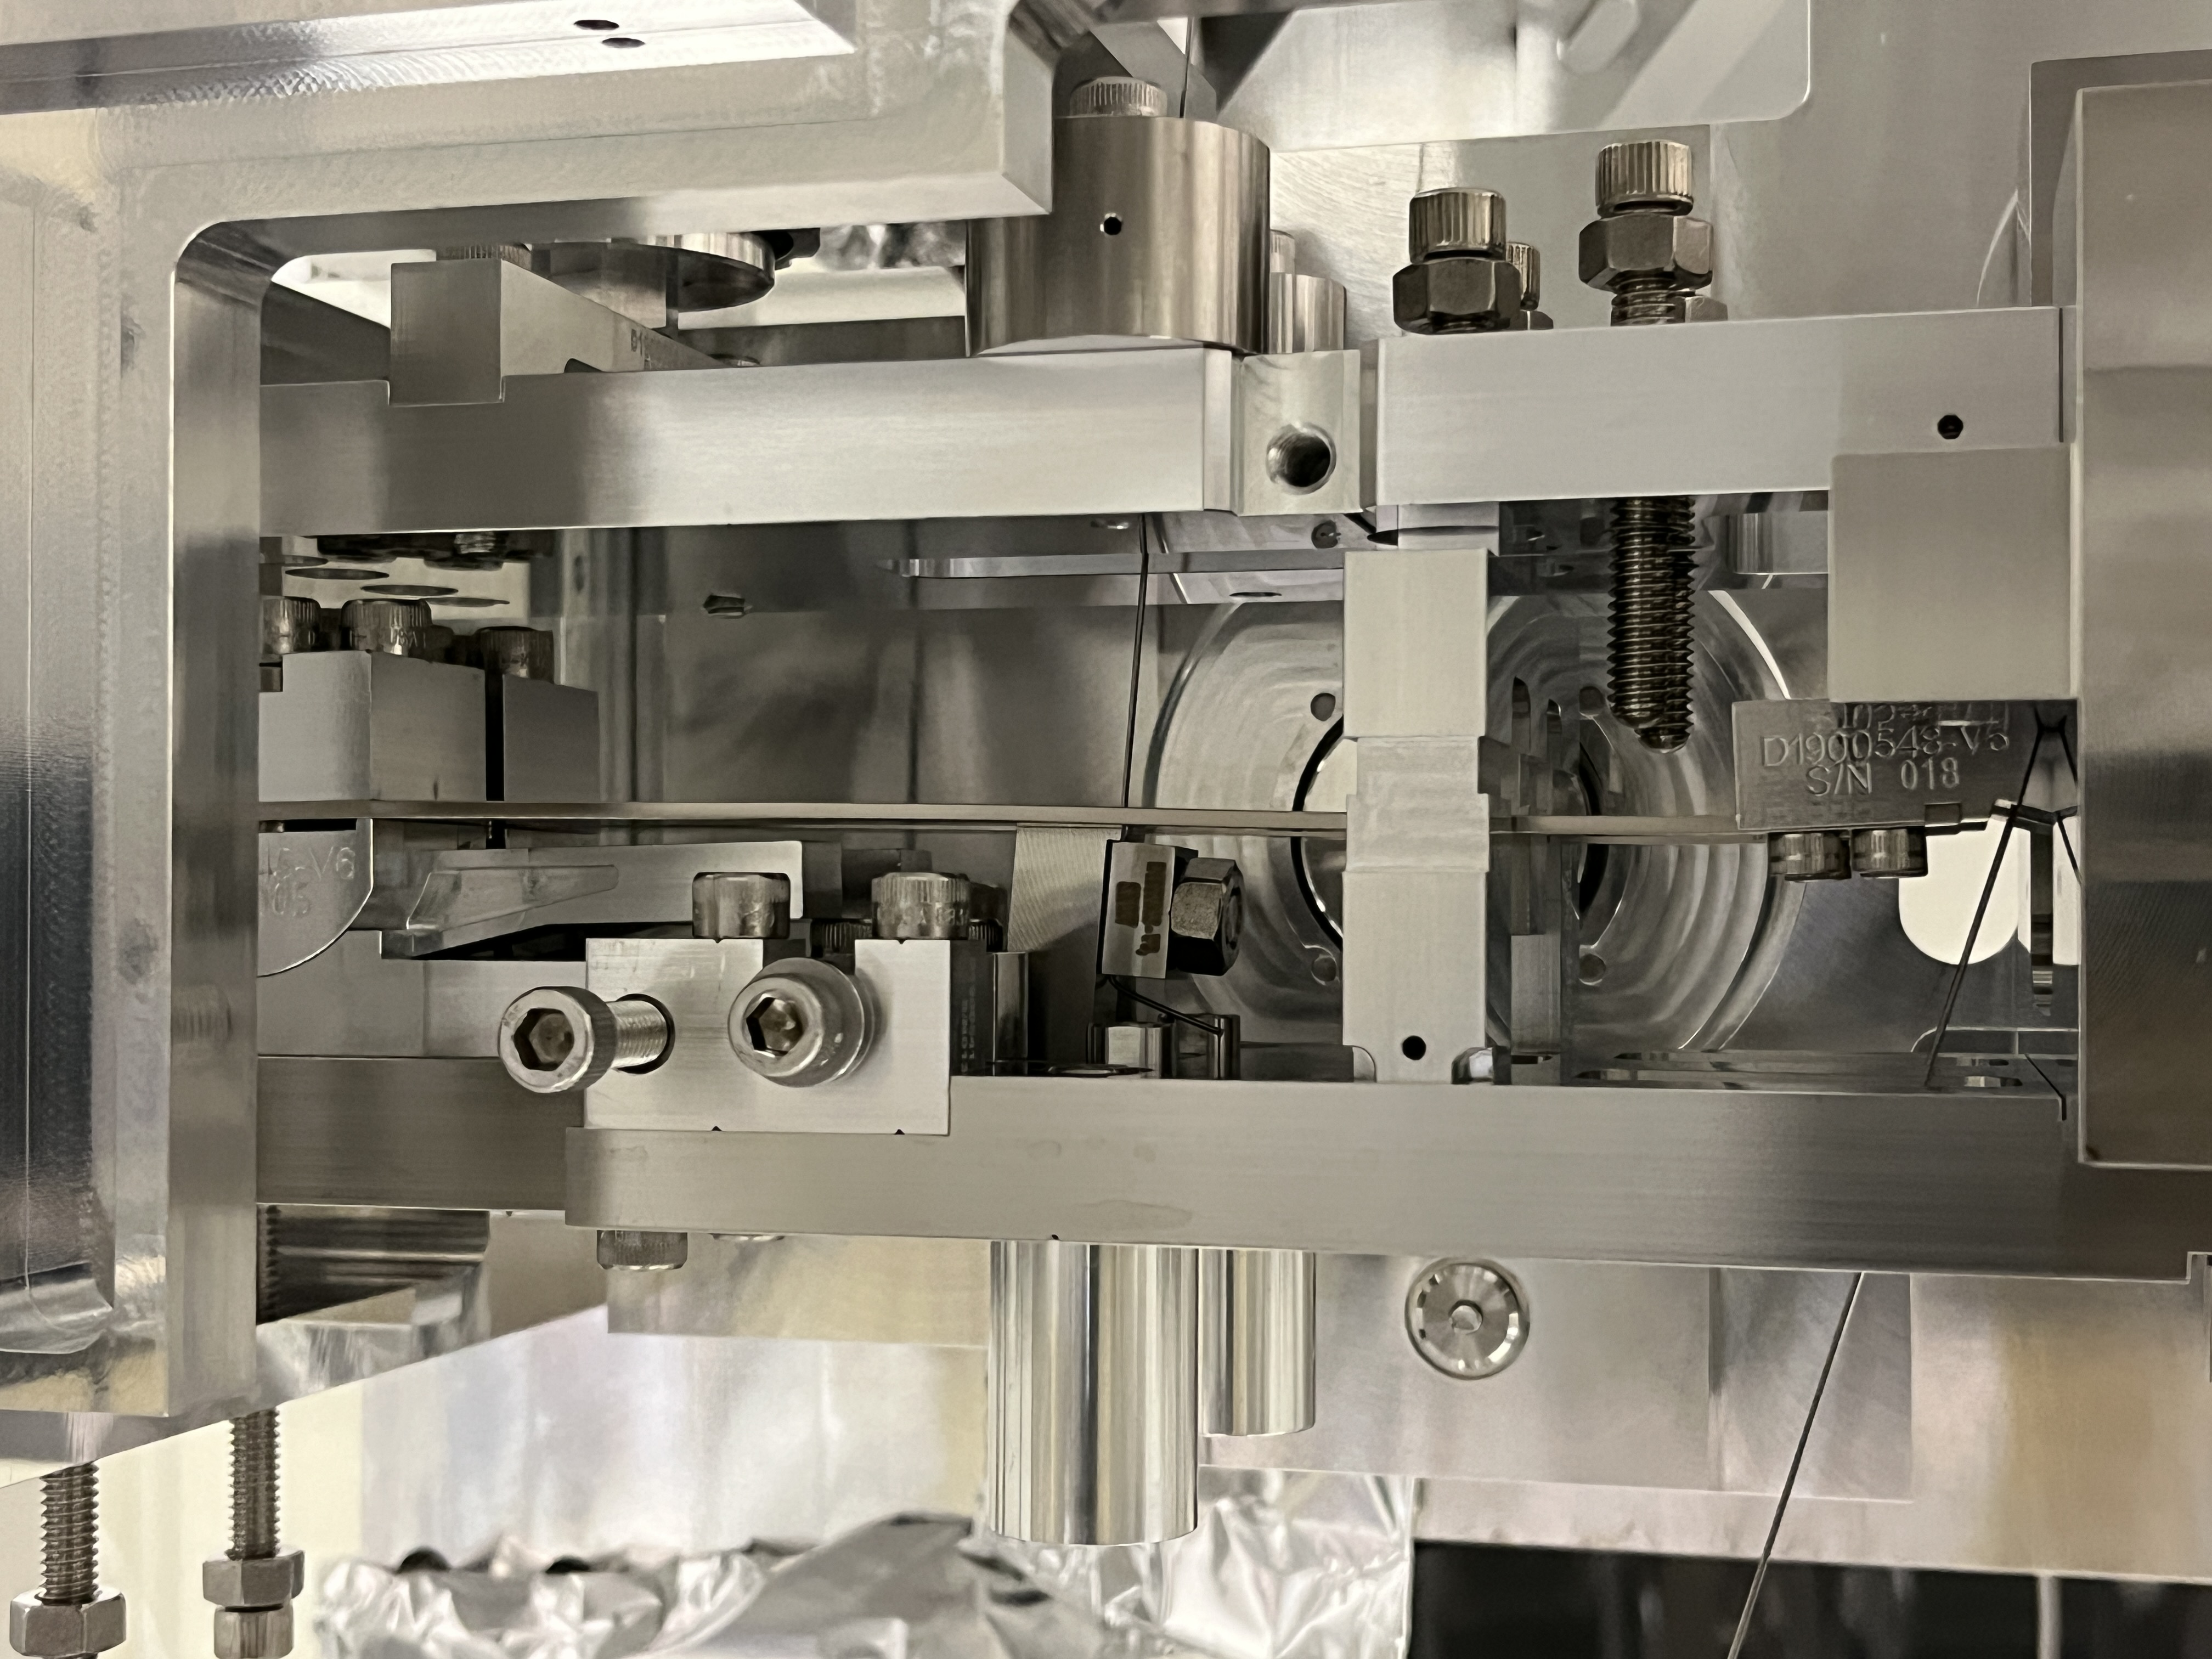
(a) found a discrepancy between the fastener model vs. measured mass budget that resulted in an unclear relationship between the center of mass of each stage and their suspension points (typically called the "d" parameters) (b) acknowledged there would be uncertainty in the location of the suspension point for the bottom mass / dummy optic given the wire-loop + optic prism system since the final distances between masses have not been measured. This, coupled with the fact that no *other* DOFs disagreed with the model besides P to P, led me to suspect the model parameters that only impact the pitch dynamics may be incorrect: (i) each stages' separation between suspension point and center of mass, the "d" parameters, and (ii) the pitch moments of inertia. For a reminder of the physical meaning of all of the triple suspension parameters, see T040072. As such, using the bbssopt.m "production" or "Final Design" (FD) parameter set as starting point, we tweaked these parameters by 10%-ish or factors of 2 to gather intuition of of how it would impact the response of the P to P transfer function. As a result, we have come to the conclusion that, in order to explain the data, we need to - increase "d1" by + 5 [mm]. This is the separation between the top (M1) mass center of mass and it's M1 to to M2 blade tip heights. In the absolute sense, this is increasing the "physical" d1 from -0.5 [mm] to +4.5 [mm], and - increase "d4" by 1.5 [mm]. This is the separation between the bottom (M3) mass / dummy optic center of mass and the wire/prism break-off point. In the absolute sense, this is increasing the "physical" d4 from +2.6 [mm] to +4.1 [mm]. Check out the attached plots which demonstrate this. Citing discussion of overall scale (1) from above, all *measured* transfer functions have been scaled to the model by a factor of (1 / 3.15). This just makes comparing model to measured frequency response a lot more clear. First attachment :: comparison between the final design model parameters and a variety of reasonable deviations of d1 between *decreased* by 2.5 [mm] and *increased by 5 [mm]. You'll notice that once d1 surpasses +1.0 [mm], the transfer function starts to look more like a standard triple suspension's transfer funtion. a d1 of FD + 5.0 [mm] lines up well with the upper two resonances of the measured data, but reduces the frequency of the lowest two L and P modes to below the data. Second attachment :: comparison between the final design model parameters and a variety of reasonable deviations of d4. You'll notice that d4 really only have an impact on the lowest two L and P modes. Third attachment :: comparison between the final design model parameters and a variety of reasonable deviations of the top (M1) mass' moment of inertia, the I1y parameter. Fourth attachment :: comparison between the final design model parameters and a variety of reasonable deviations of the middle (M2) mass' moment of inertia, the I2y parameter. Fifth attachment :: comparison between the final design model parameters and a variety of reasonable deviations of the bottom (M3) mass' moment of inertia, the I3y parameter. None of the modeled changes to the moment of inertia -- shown in the third, fourth, and fifth attachments -- show promise in reproducing the measured results. Sixth and Final attachment :: comparison between the final design model parameters and one with only d1 increased by +5 [mm], and d4 increased by +1.5 [mm]. The modified model in this last attachment fits the data the best, so we conclude that the issues with mechanical construction (3a) and (3b) are consistent with the measured data :: the reconfigured mass budget needed from fastener issues resulted in a deviation from design value for d1, and the imprecision of the mass-to-mass distances and wire-loop / prism system resulted in a roughly ~2 [mm] slop for this assembly. %%%%%%%%%%% End kLOG (You missed these...) %%%%%%%%%%%%%% Big Picture Systems Level Commentary by Jeff :: If these measured transfer functions end up being the reality of the final frequency response of the BBSS -- this will be totally fine. The pitch isolation one gets above the resonances (defined mostly by the moment of inertia) is the same, the lowest L and P modes are sufficiently low, and the details of where the rest of the resonances land are totally inconsequential / amenable to a damping and global control design.
Today, Ibrahim and I made measurements of the BBSS Suspended masses compared to the dimensions shown on the various sheets of BBSS TOP LEVEL ASSEMBLY drawing D1900628. The BBSS is still nicely hung from the last RAL visit, very little pitch error by eye. It seems that all of the Top Mass, Penultimate Mass and Bottom Dummy Mass are 2mm low compared to the structure, together in the same direction, all ~2mm low. On the various sheets it shows reference nominal dimensions which we compared the as-built to (see attached). So, it seems that any overall height adjustment to the new suspension, if needed, would be in the upper stages.
tagging EPO for BBSS pics.
Update on these results: 76071
Verification that the d4 value is correct: 82138
Down for maintenance at 16:06 UTC