Hi everyone it's been a while since I posted!
Julia Rice and I had a chat with Peter F today about motivating the electrostatic violin mode damper we've been building at Syracuse. We came away with a couple of questions to answer:
1. What's the actual displacement of the fibers when the violin modes are excited, and is our shadow sensor noise low enough to measure the modes.
2. What is the origin of the two violin modes per fiber? Is it fiber ellipticity built into the fibers themselves or asymmetry their attachment points AKA the ear/horn. If it's the former, we'd expect the main oscillation axis of the modes to be randomly oriented. If it's the latter we'd expect 4 modes per test mass to be dominant in DARM, and 4 modes to be much weaker, we'd also perhaps expect to see a regular spacing between pairs of modes.
I still have remote access (thanks Dave for helping me get my ports sorted with NoMachine), so I logged in to grab some plots of violin modes excited vs damped times.
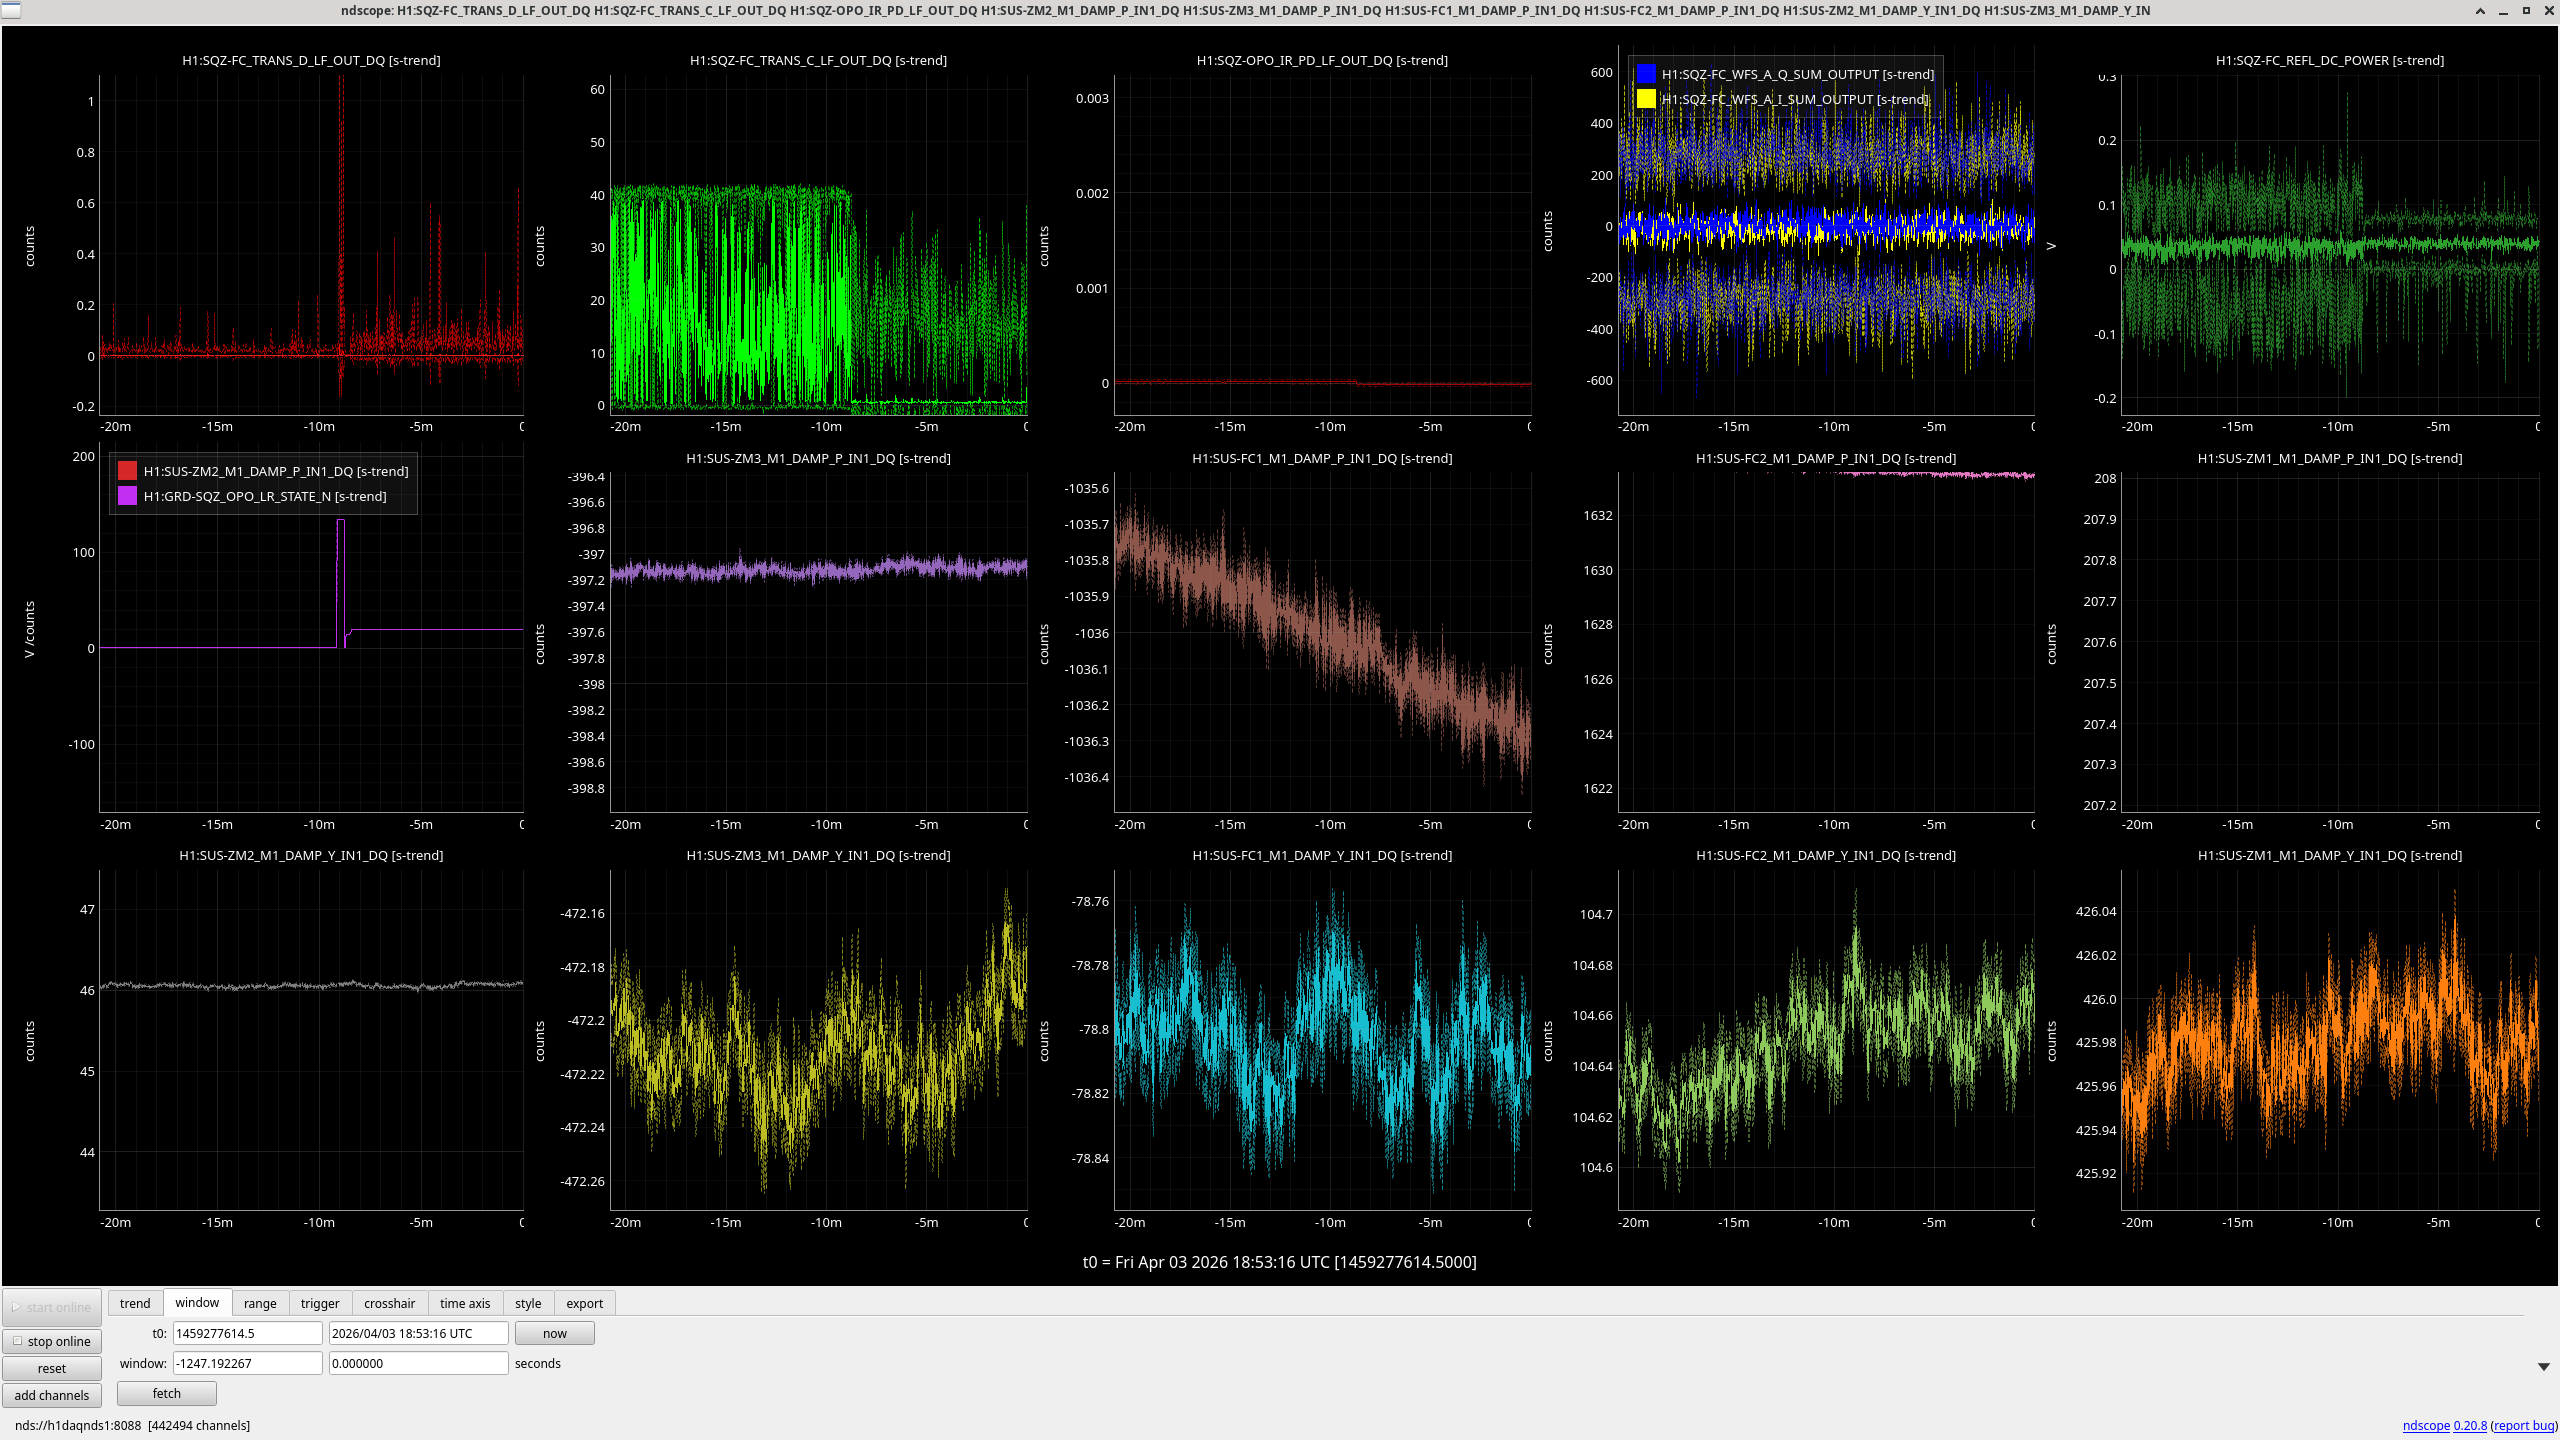
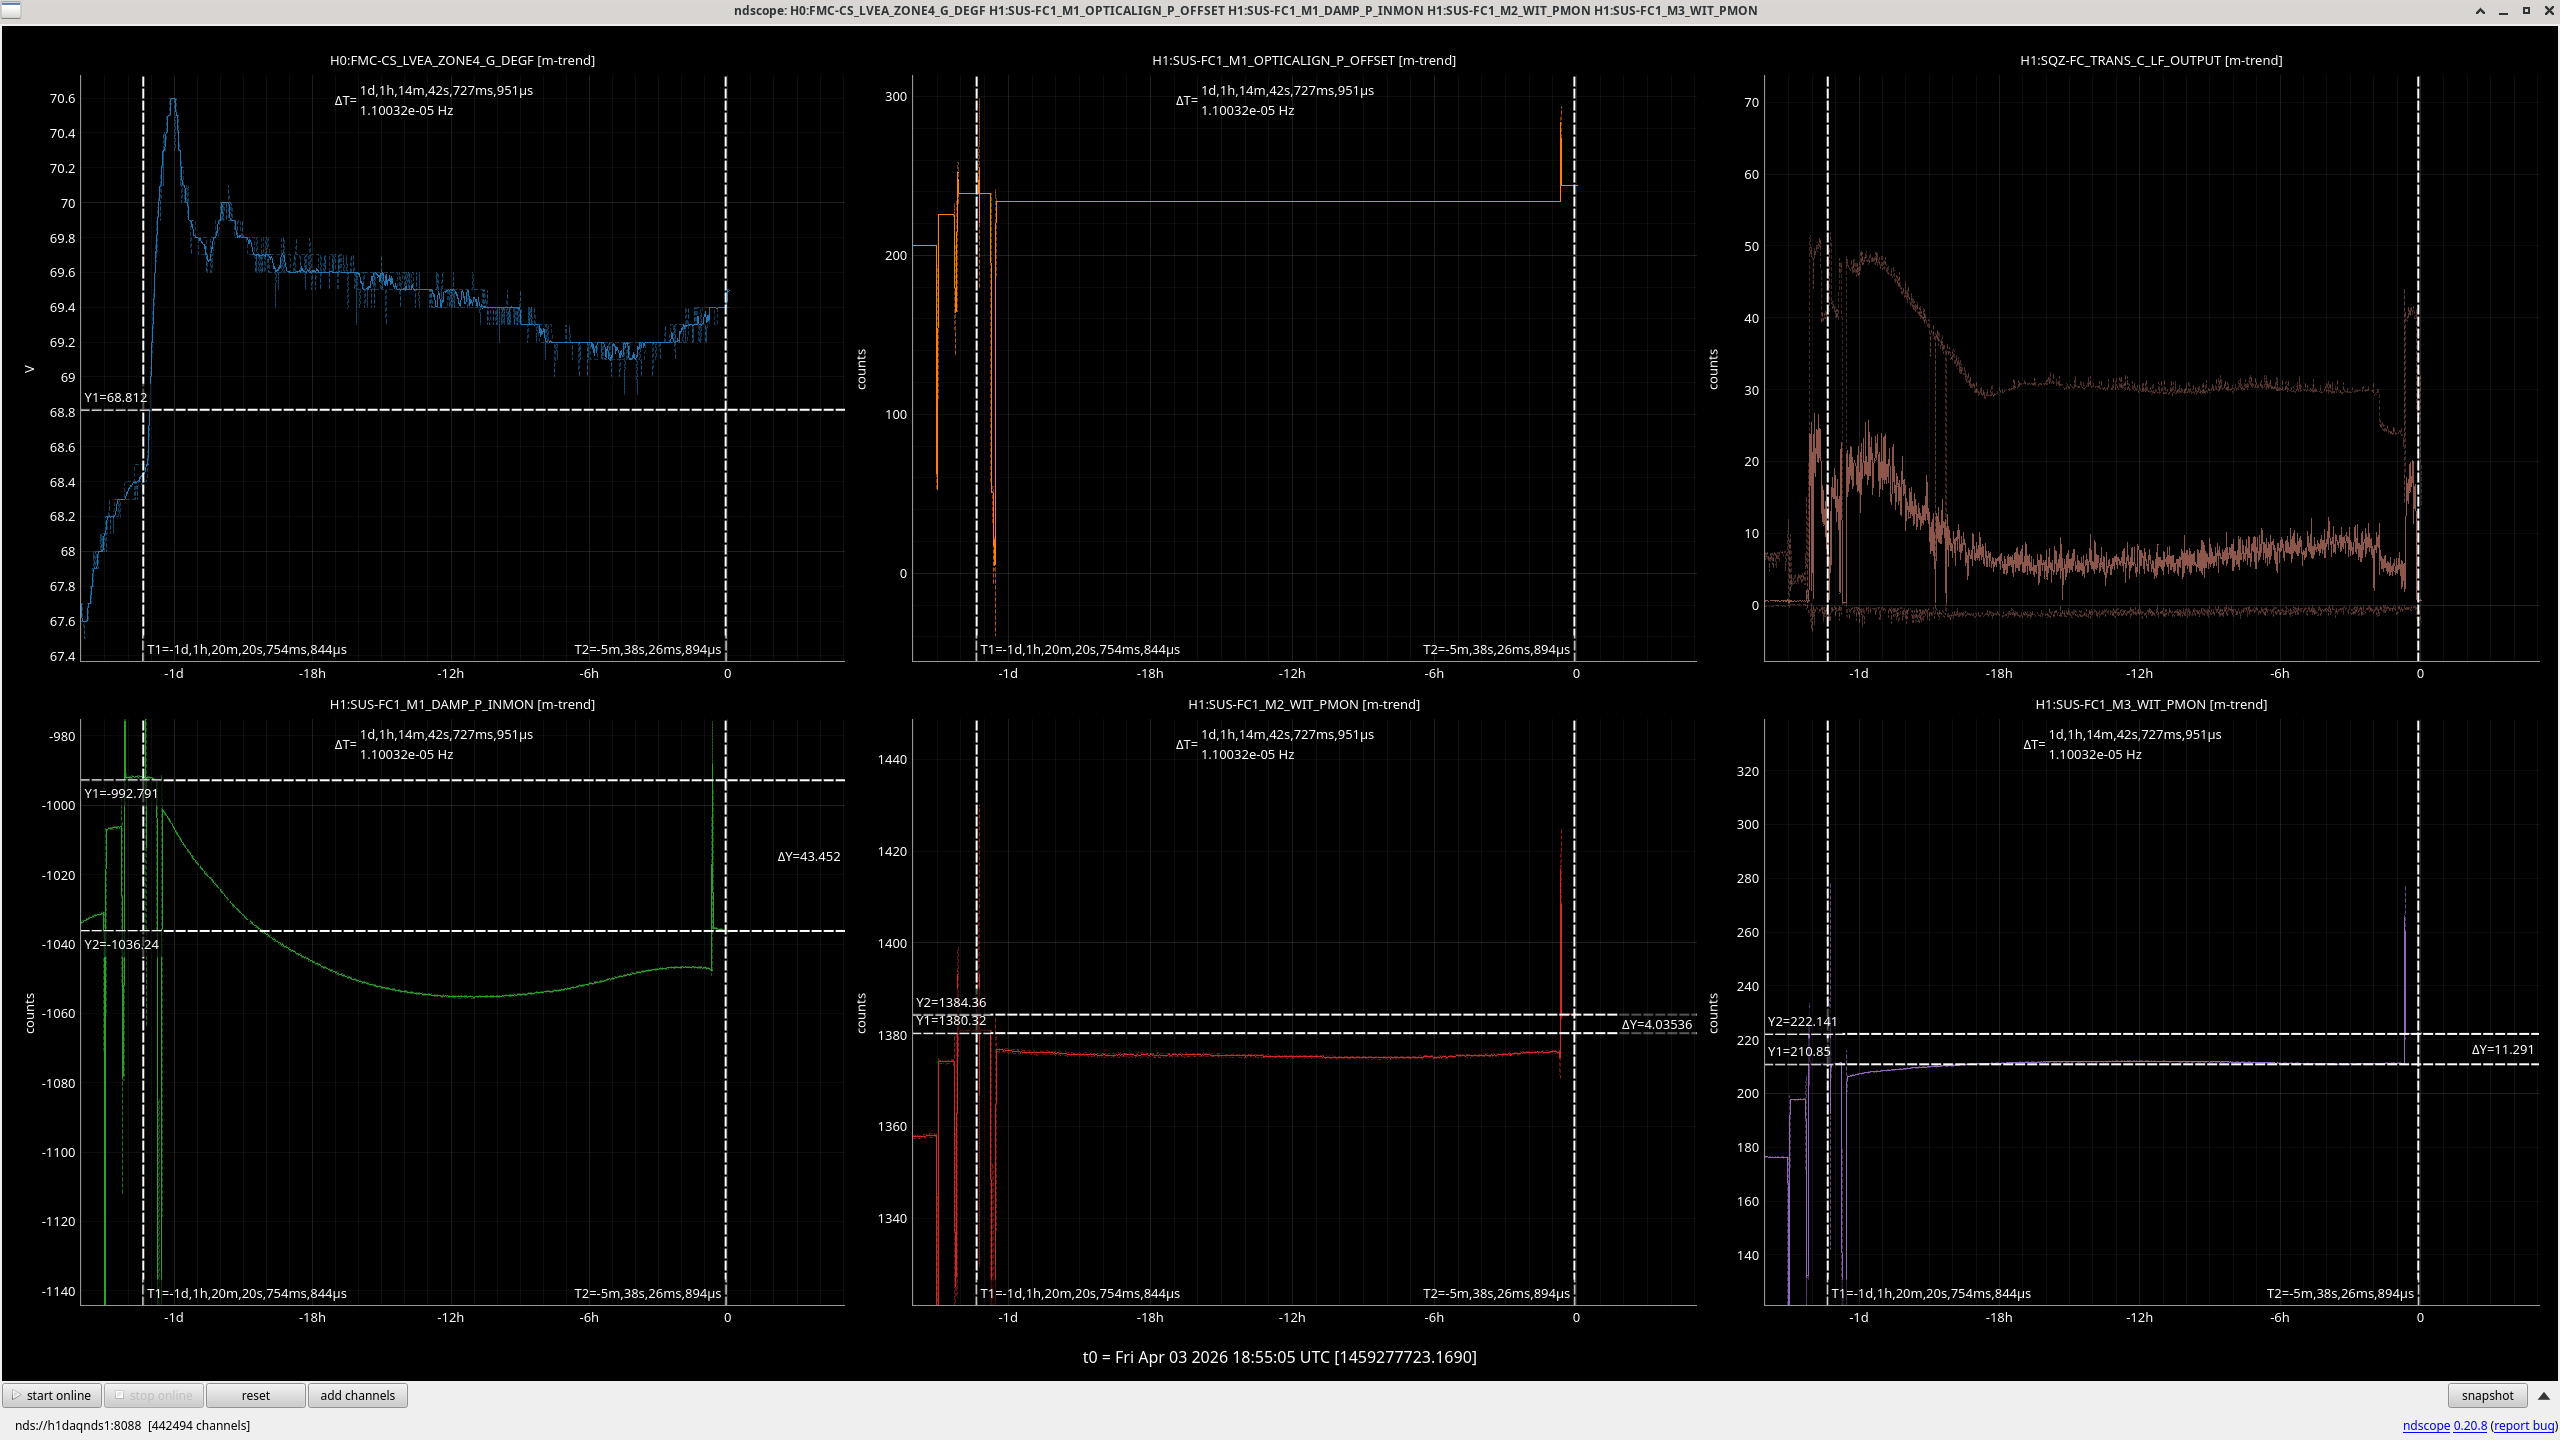
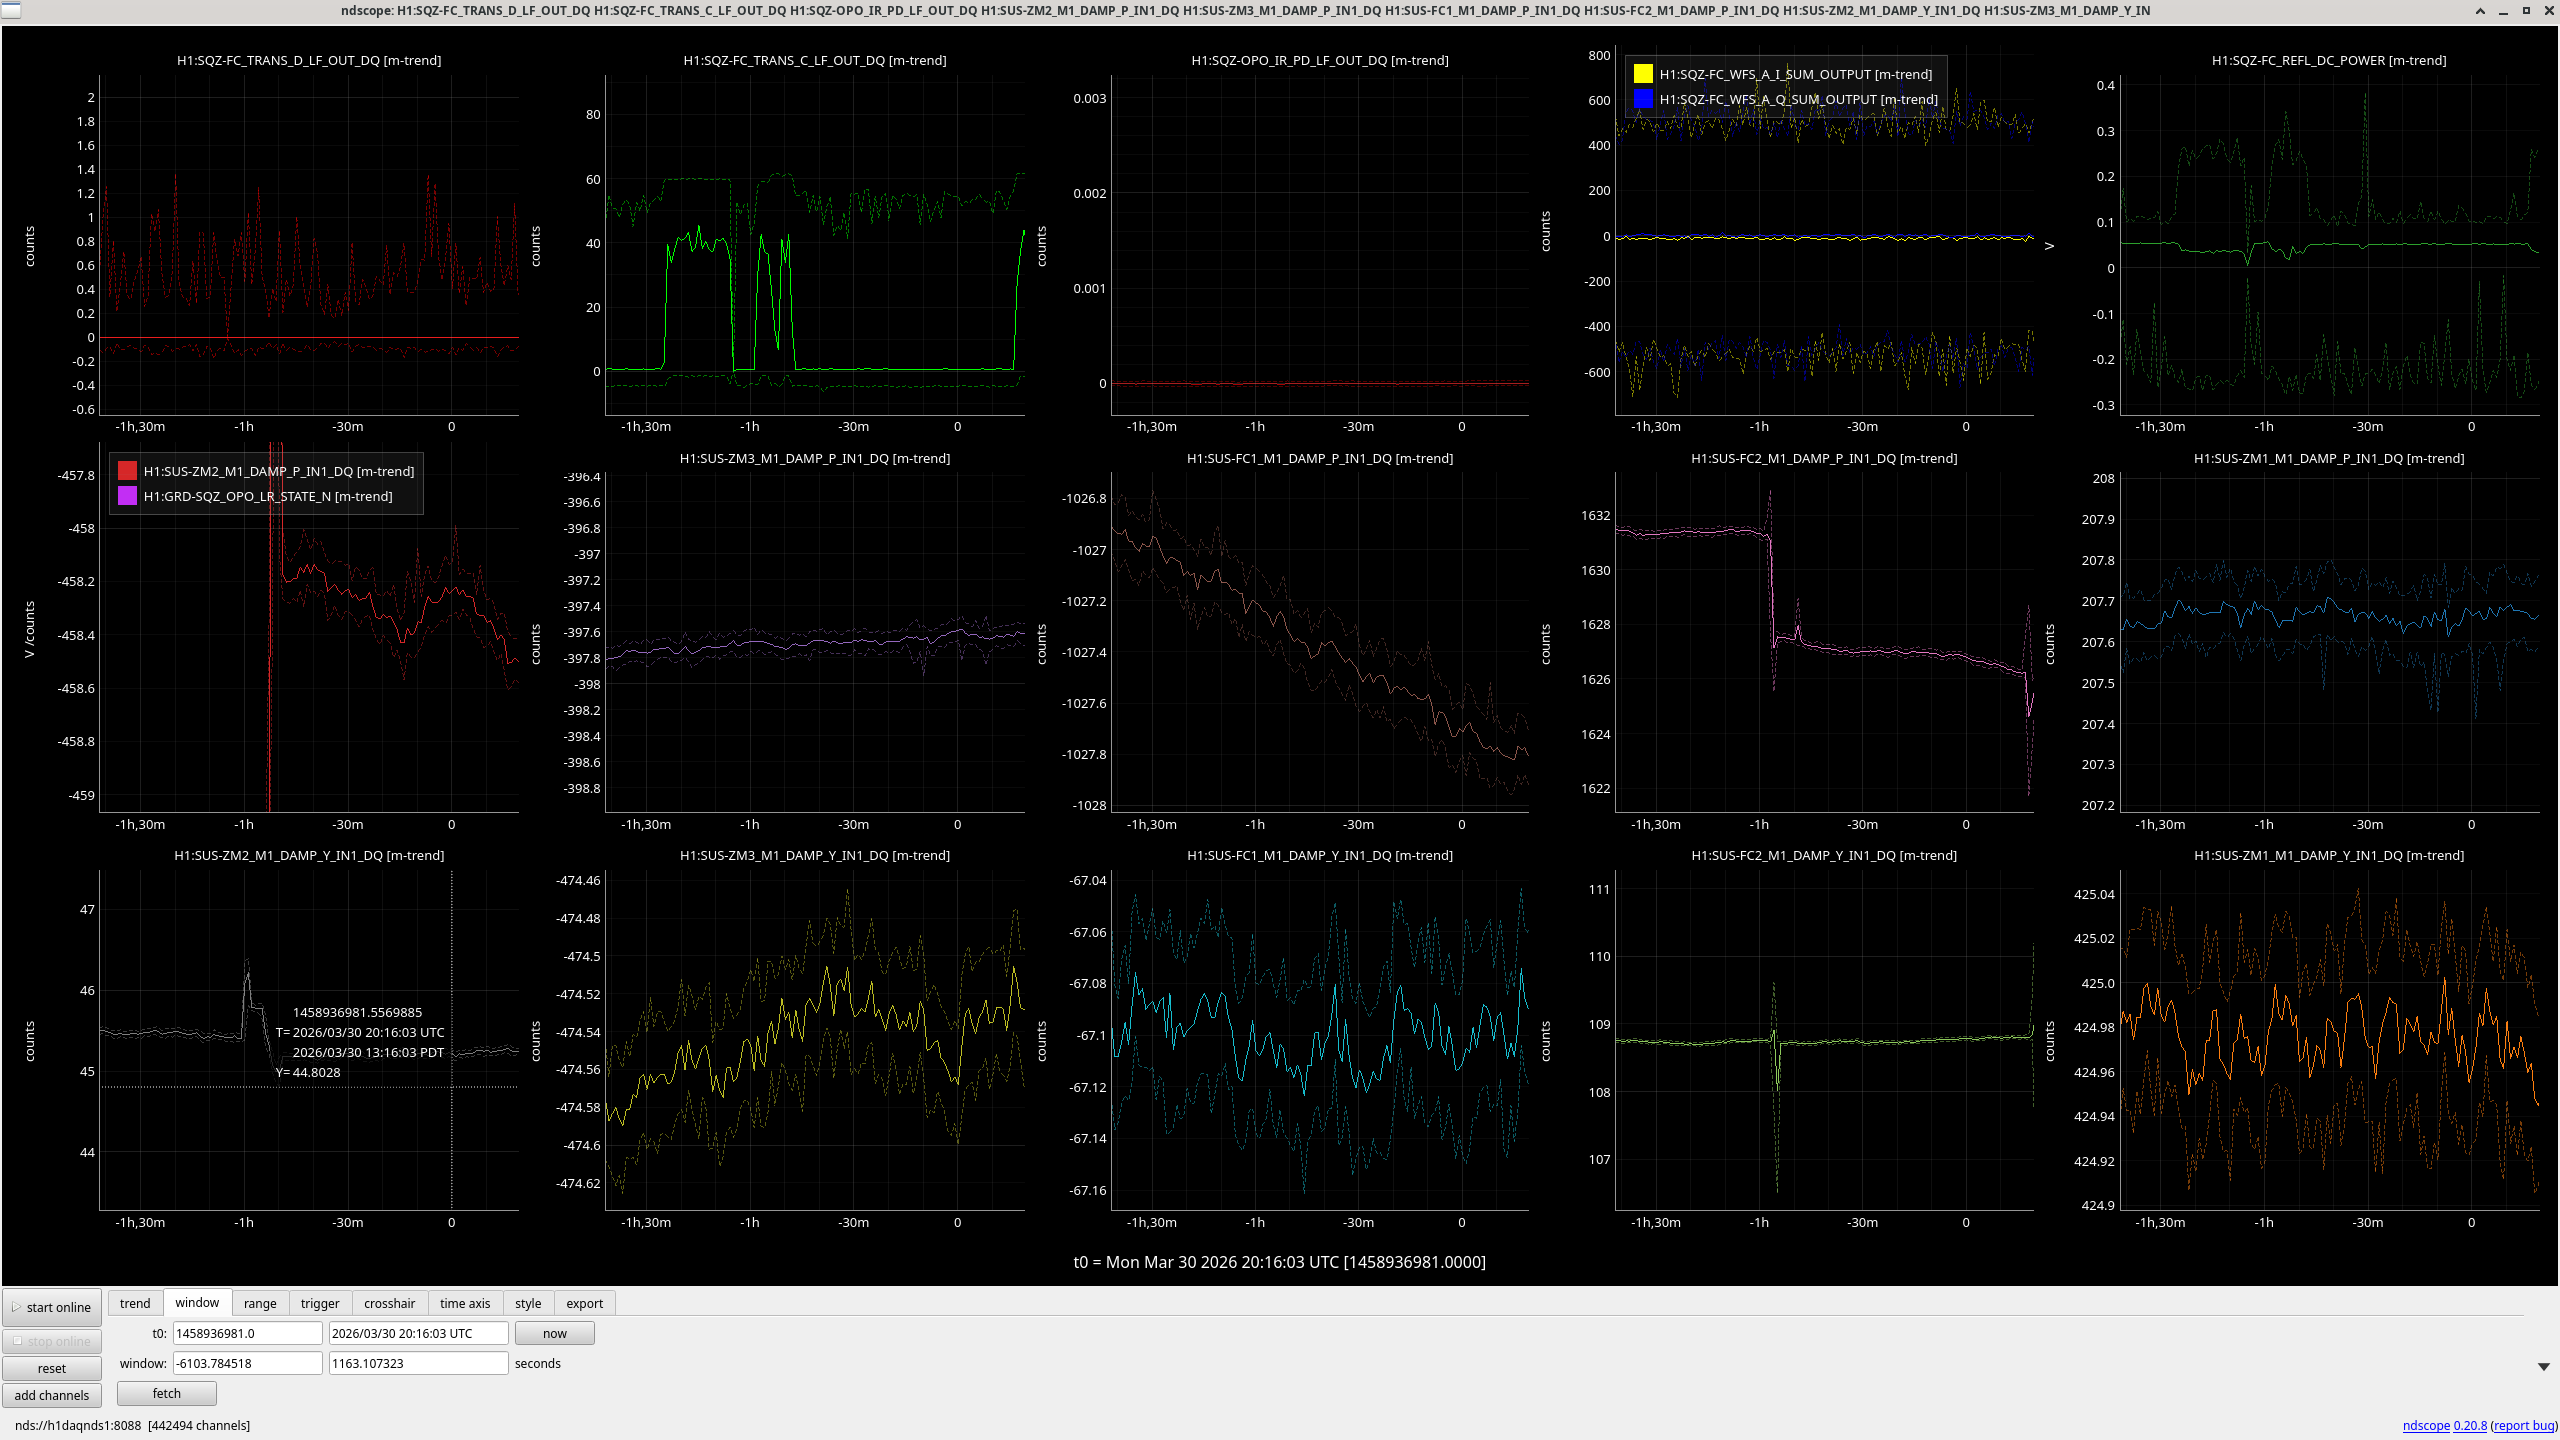
I found an excited time and a quiet time by plotting the ISC_LOCK guardian state and the monitor for ITMY MODE5 which I know is a problematic mode (first plot). I used 5 November 2025 17:59:09 UTC, gps 1447264767 for the modes excited time since this was after many locking attempts with the mode5 monitor was ~20k counts. I used 17 November 2025 20:57:12 UTC, GPS 1447448250 as my quiet time AKA t=0 on the first plot.
Second plot is the money plot! When the modes are excited their amplitudes in DARM range between 1e-16m/rt(Hz) and 1e-14m/rt(Hz), we can roughly convert this to fiber displacement by multiplying by the fiber to test mass mass ratio. We did some back of the envelope calculations with Stefan and there's a factor of 2pi in there somewhere too.
I labelled the plot referencing this handy violin mode spreadsheet from Rahul et al, which set me thinking about the violin mode origin in question 2 above...
I can see the regular spacing with one large mode and one smaller mode in the ETMs for the excited spectrum. BUT it's not like there is 4 modes visible in DARM and 4 that are totally anti-aligned: the smaller modes are still very much visible in the DARM spectrum.
ETMX9 (516.781 Hz) has a small buddy ETMX7 (516.678)
ETMX1 (511.2993 Hz) had a small buddy ETMX6 (511.18)
ETMX3 (508.938 Hz) has a small buddy ETMX4 (508.844)
ETMX8 (507.36) has a small buddy ETMX2 (507.493)
For the first 3 pairs, the bigmode is higher in frequency, not sure if significant. Also, in the damped spectrum the larger modes can become sufficiently damped that the smaller mode is now louder in DARM, I wonder if that might be because we have spent many more hours tuning and damping the settings for the large modes?
There are also some modes that break the trend: ETMY1 and ETMY6 are very close together.
For the ITMs, things are less clear. ITMY1 and ITMY2 are similar height in DARM, same with ITMX8 and ITMX7, and ITMX3 and ITMX5. Things are confusing around the clusters of modes 504 Hz and 508 Hz.
I had previously always assumed that ITMY mode5 and mode6, the extremely close modes, are on the same fiber. But perhaps mode5 is on the same fiber as mode7, and mode6 is on the same fiber as mode8!
To better visualise the data, I made a table of the mode "buddies" and their frequency separations here, check it out if your interested. There is a goofy plot in there with no x-axis and mode spacing on the y-axis. The frequency spacing of pairs of modes is centered around 0.1Hz.
I do think there is scientific value to having a shadow sensor at the fiber: it's clear that the modes are not perfectly aligned or anti-aligned with the DARM axis, I was able to identify all 32 modes. In the egregious case of ITMY, at least 7 of the 8 modes are large in DARM. That being said, the regularity of the spacing means I am quite confident (for most modes!) which two modes are on the same fiber.
Please let me know if I've missed something or if you have any thoughts!


