Mark B. and Gerardo
(This alog is based on final numbers from Gerardo - a typo was discovered in one of the ear positions used in discussions yesterday.)
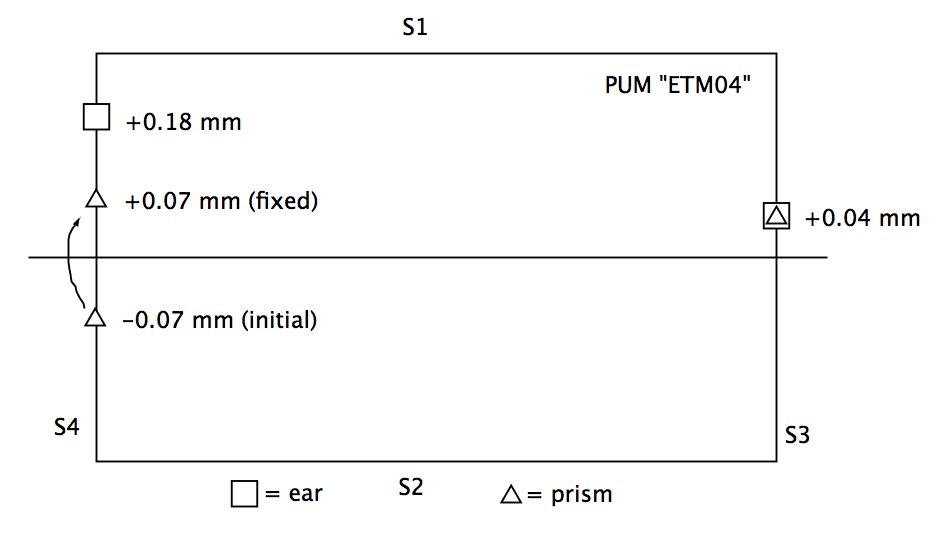
The PUM "ETM04" had been selected for use in the ETMx quad at LHO. While reviewing its history in preparation for welding, Betsy, Gerardo and Angus discovered that one ear, on the S4 surface, had been flagged as 0.18 mm from the front-back centerline, outside the 0.1 mm tolerance. (It was one of the first to have ears bonded, before the procedure had been entirely perfected.) Even a small front-back error produces a large pitch torque from the weight of the test mass below, which can produce a significant static pitch in the final suspended chain.
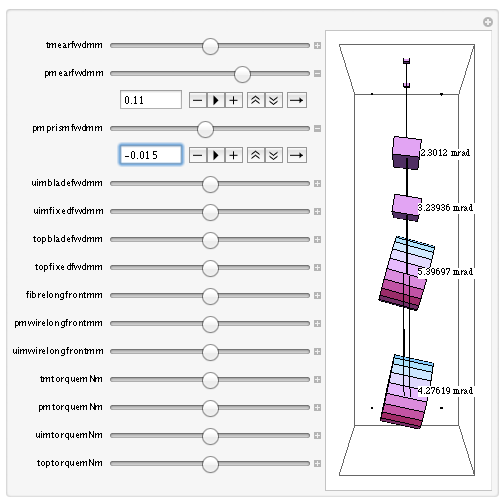
The positions of the ears and prisms are as in the first attachment. The prism on the S4 surface is at -0.07 mm, which adds to the pitch torque. The ear and and prism on the S3 surface are at 0.04 mm, which subtracts a small net torque. The net expected pitch imbalance is per the second attachment: 4.3, 5.4, 3.2 and 2.3 mrad at the various masses, from the bottom up.
The average misposition of the ears is (0.18+0.04)/2 = +0.11 mm. Since it is not possible to remove and reposition the ears after several years of curing of the bonds, to salvage the mass requires moving the prisms to an average position of +0.055 mm (the weighting of the prisms is -2 that of the ears because the tension on the associated wires is double, and upwards rather than downwards). Since removing prisms is time-consuming and slightly risky, it is preferable to move just one if possible. The easiest possibility is to move the S4 prism from -0.07 mm to +0.07 mm, so that the average is (0.07+0.04)/2 = +0.055 mm as desired. This means that the PUM will sit at a yaw angle set by the prisms of (0.07-0.04)/326.5 = 0.09 mrad, and the test mass will be a yaw angle set by the S4 ear and prism of (0.18-0.07)/326.5 = 0.34 mrad. These are small enough to be easily trimmed statically and should have a negligible effect on the dynamics. (A comparison of TFs with and without the misposition and fix will be posted as a comment.)
However this moving of the prism can't be done in time to use the assembled welding crew in the next few days, so PUM "ETM03" has been prepared and allocated to LHO ETMx (per alog 6800), and, assuming a quick and successful rework, "ETM04" will be used next up as ETMx at LLO in a few weeks.


HAM 2 is now on the run list.
HAM 3 is now in run mode as well.